231
Evaluation of three pose estimation algorithms for model-based Roentgen stereophotogrammetric analysis B L Kaptein1*, E R Valstar1,3, B C Stoel2, P M Rozing1 and J H C Reiber2 1 Department of Orthopaedics, Leiden University Medical Center, Leiden, The Netherlands 2 Division of Image Processing, Department of Radiology, Leiden University Medical Center, Leiden, The Netherlands 3 Pattern Recognition Group, Department of Imaging Science and Technology, Faculty of Applied Sciences, Delft University of Technology, Leiden, The Netherlands
Abstract: Model-based roentgen stereophotogrammetric analysis (RSA) uses a three-dimensional surface model of an implant in order to estimate accurately the pose of that implant from a stereo pair of roentgen images. The technique is based on minimization of the difference between the actually projected contour of an implant and the virtually projected contour of a model of that same implant. The advantage of model-based RSA over conventional marker-based RSA is that it is not necessary to attach markers to the implant. In this paper, three pose estimation algorithms for model-based RSA are evaluated. The algorithms were assessed on the basis of their sensitivities to noise in the actual contour, to the amount of drop-outs in the actual contour, to the number of points in the actual contour and to shrinkage or expansion of the actual contour. The algorithms that were studied are the iterative inverse perspective matching (IIPM ) algorithm, an algorithm based on minimization of the difference (DIF ) between the actual contour and the virtual contour, and an algorithm based on minimization of the non-overlapping area (NOA) between the actual and virtual contour. The results of the simulation and phantom experiments show that the NOA algorithm does not fulfil the high accuracy that is necessary for model-based RSA. The IIPM and DIF algorithms are robust to the different distortions, making model-based RSA a possible replacement for marker-based RSA.
1 INTRODUCTION In total joint arthroplasty, fixation of the implant in the surrounding bone is of greatest importance for the success of the treatment. Poor implant–bone fixation may lead to mechanical loosening of the implant; this is a continuous process that starts with micromotion of the implant and leads to destruction of the bone and migration of the implant and ends with a necessary revision of the implant. To study the fixation of implants, roentgen stereophotogrammetric analysis (RSA) was developed by Selvik [1]. With this accurate three-dimensional measurement technique, micromotion between the implant and the surrounding bone can be assessed at an early stage [2–4]. The reported accuracy of RSA ranges between 0.05 and 0.5 mm for translations and between 0.15° and 1.15° for rotations (95 per cent confidence interval [5, 6 ]). Since it has been demonstrated that The MS was received on 5 August 2003 and was accepted after revision for publication on 5 April 2004. * Corresponding author: Department of Orthopaedics, Leiden University Medical Center, PO Box 9600, 2300 RC Leiden, The Netherlands. email:
[email protected] H06003 © IMechE 2004
mechanical loosening of implants can be predicted by the assessment of the continuing micromotion with RSA [7, 8], this measurement technique is a valuable tool to study new implant designs, new operation techniques and new bone cements in clinical trials. To achieve the demonstrated high accuracy of RSA, it has been necessary until today to mark the implant and the surrounding bone with tantalum beads. From the projections of these markers, detected in a stereo pair of roentgen images, their three-dimensional positions are reconstructed, resulting in an accurate calculation of the pose of the implant relative to the bone [6, 9, 10]. One of the difficulties in RSA is that the marking of the prosthesis drastically increases the costs and lengthens the start-up period of an RSA study. Another problem is that the markers, which are attached to the implant, are often overprojected by the implant itself. To avoid the necessity to use markers on the implant for RSA, a model-based RSA method was developed [11]. This technique is based on minimizing the nonoverlapping area (NOA) between the virtual projections of a three-dimensional surface model of an implant with the actual projections of the implant as it appears in a Proc. Instn Mech. Engrs Vol. 218 Part H: J. Engineering in Medicine
232
B L KAPTEIN, E R VALSTAR, B C STOEL, P M ROZING AND J H C REIBER
roentgen image. If the implant is an asymmetric object, its projection is unique in most instances. Therefore, the pose of an implant can be estimated from its projections by finding the pose of the corresponding model, such that the projections of this model has a minimal difference with the projection of the implant that is recorded by the roentgen system. Three-dimensional pose estimation based on twodimensional projections originates from three-dimensional vision [12, 13] and has also been used in roentgen fluoroscopic analysis [14–19]. In a pilot study carried out at Leiden University Medical Center [20], the NOA was used as a measure of the difference between the actual and the virtual projections. It was concluded that the established accuracy of conventional marker-based RSA could not be reached with this specific approach for model-based RSA due to the relatively large dimensional differences between the computer aided design (CAD) model of the implant and the actual implant. To overcome this problem, it became clear that it is necessary to remove the unreliable parts of the contours originating from inaccurate parts of the model. These drop-outs in the contours are also generated in the case of a partial overlap of the projections of the prosthetic components. It was therefore necessary to develop an improved model-based RSA algorithm that can handle contours that contain drop-outs. The aim of the present study is to evaluate two improved model-based RSA algorithms and to compare them with the original NOA algorithm. The algorithms were assessed on the basis of their sensitivities to noise in the actual contour, to the amount of drop-outs in the actual contour, to the number of points in the actual contour and to shrinkage or expansion of the actual contour. For these tests, data from a phantom experiment as well as a computer simulation experiment were used.
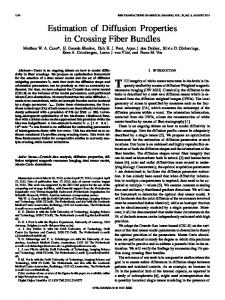
2 MATERIAL AND METHODS In this study, an RSA set-up was used that contained two synchronized roentgen tubes positioned at approximately 1.5 m above a film cassette. Each roentgen tube was directed towards one-half of the roentgen film at an angle of 20° relative to the normal vector of the roentgen film. A carbon calibration box with 1 mm tantalum markers was positioned underneath the roentgen table. This calibration box defines the laboratory coordinate system and is used to calculate accurately the positions of the roentgen foci. In clinical RSA studies, the patient is situated with the implant above the calibration box. In Fig. 1, an image of a typical RSA set-up is presented. The phantom consisted of the femoral or tibial component rigidly clamped inside a small carbon box in which 17 beads were attached to the edges. With a rotational device it was possible to rotate this phantom box in reproducible poses with respect to the calibration box. The roentgen films were scanned at 150 dots/in using a Vidar VXR-12 film scanner ( Vidar, Lund, Sweden) and the RSA-CMS software (MEDIS Medical Imaging Systems BV, Leiden, The Netherlands) was used to detect automatically and to label both the markers of the calibration box and the markers of the phantom. The calibration calculations of the RSA-CMS software provided the direct linear transformation (DLT ) parameters [21]. The DLT parameters describe among others the positions of the roentgen foci that are necessary for the virtual projection of the model in modelbased RSA. The RSA-CMS software was extended with the Canny edge detector in order to detect the prosthesis contours [22]. The contours were transformed into polygons by converting each pixel of the detected contours into a polygon node. Subsampling of these nodes by a factor
Fig. 1 (a) The RSA set-up consists of two synchronized roentgen tubes and a calibration box. The roentgen films are positioned underneath this box. (b) The joint of interest is positioned at the crossing of the X-ray bundles, so that a stereo image is created Proc. Instn Mech. Engrs Vol. 218 Part H: J. Engineering in Medicine
H06003 © IMechE 2004
ALGORITHMS FOR MODEL-BASED ROENTGEN STEREOPHOTOGRAMMETRIC ANALYSIS
of 10 reduced the high level of redundancy in the contours. Contour parts of structures other than the implant of interest were manually removed. The model of the implant is described by a large number of triangular surface elements. In this study, a model was used that was generated by reversed engineering of a knee implant (Interax total knee prosthesis, Stryker Howmedica Osteonics Corporation, Rutherfort, USA). The models of both the femoral component and the tibial component of this implant consisted of 5000 triangular elements. Note that, in order to minimize the influence of the difference between the model and the actual implant, the implant that was used to generate the model was also used in the phantom experiments.
3 POSE ESTIMATION ALGORITHMS To assess the three-dimensional pose of the implant, the difference between the actually projected contour (‘actual contour’) and the virtually projected contour (‘virtual contour’) needs to be minimized. For this, three algorithms were tested. The iterative inverse perspective matching (IIPM ) algorithm uses an iterative scheme to minimize the difference between the virtual contour and the actual contour. In the other two algorithms, the minimization of the difference between the virtual contour and the actual contour (DIF ) and the minimization of the NOA between the virtual contour and the actual contour are achieved by means of a sequential quadratic programming (SQP) minimization scheme as described by Spellucci [23]. 3.1 Iterative inverse perspective matching (IIPM ) algorithm The first algorithm is based on the work of Wunsch [13]. For each point of the actual contour, the closest position on the virtual contour is selected (Fig. 2). These closest positions on the virtual contour are back projected on to the three-dimensional model. These points are used as source landmarks for an iterative closest point (ICP) algorithm based on the work of Besl amd McKay [24]. The target landmarks are selected by projecting the source landmarks on to the projection lines of the corre-
Fig. 2 Closest connection line between point A of the actual i contour, and its projection position Ap on the virtual i contour H06003 © IMechE 2004
233
sponding points on the actual contour (Fig. 3). The ICP algorithm reduces the distances between the target and source landmarks in an iterative manner. 3.2 Contour difference (DIF ) algorithm The second algorithm minimizes the difference between the actual contour and the virtual contour [18]. The difference is defined by the mean value of the shortest distances between each point of the actual contour and the virtual contour (Fig. 2). 3.3 Non-overlapping area (NOA) algorithm The third algorithm minimizes the NOA between the actual contour and the virtual contour, which is defined by the area that is not common to both contours [20]. Note that this algorithm requires that both the actual contours and the virtual contours are closed. In contrast with the other methods, it is necessary to close the contours that contained drop-outs by connecting the end points of the contour by a straight line.
4 EXPERIMENTS AND RESULTS In the experiments, the phantom was positioned in nine standardized poses (0, 10 and 20° exo-rotation in all possible combinations with 0, 10 and 20° flexion). For each of the nine RSA radiographs, a human operator manipulated the model in a virtual scene (Fig. 3) in order to set its initial pose. The final pose of the model was estimated by one of the automatic algorithms. Since the implant is rigidly clamped inside the phantom box, there is no change in relative pose between the implant and the markers, and so the calculated migration of the implant relative to the phantom box can be considered as a measure of the error of the model-based RSA algorithm. A marker-based RSA was used to measure the pose of the phantom box, and the migration between the model and the phantom box for successive radiographs was calculated. To reduce the large amount of data, the calculated translation is presented as the median and maximum of the Euclidean norm of the translation vector in millimetres. The translation vector is defined as the translation of the midpoint of the three-dimensional model relative to the midpoint of the phantom box. The rotation is calculated by using helical axes, a helical axis describes the instantaneous movement of a rigid body. It is described by a rotation about and a translation along the so-called helical axis. We calculated the median and maximum of the nine rotations about this helical axis. To provide some idea about what the components of the migration errors look like, Table 1 shows a typical example of the migration errors for a complete actual Proc. Instn Mech. Engrs Vol. 218 Part H: J. Engineering in Medicine
234
B L KAPTEIN, E R VALSTAR, B C STOEL, P M ROZING AND J H C REIBER
Fig. 3 Virtual scene in which an operator interactively sets the initial pose of the femoral model. The operator can manipulate the poses of both the model and the camera. Manipulating the camera is important to obtain an optimal view of the scene. The scene also contains the projection lines from the roentgen foci. The connection lines between the actual and virtual contour are the shortest distance lines between these contours
Table 1 Typical example of the components of the errors in translation and rotation for a complete actual contour of the femoral and tibial components subsampled by 10 per cent calculated using the IIPM method Translation* (mm)
Femoral component Tibial component
Rotation† (deg)
x
y
z
Tr.‡
R x
R y
R z
Rot.§
0.05 −0.04
−0.04 −0.02
0.13 0.03
0.15 0.05
−0.00 −0.04
0.06 −0.07
−0.02 −0.01
0.07 0.08
* Translations are labelled x, y, z. † Rotations are labelled R , R and R . x y z ‡ Tr. is the translation of the midpoint of the component. § Rot. is the rotation about the helical axis.
contour for the femoral and tibial components, calculated using the IIPM method with 10 per cent subsampling. 4.1 Influence of the number of points in the actual contour In this experiment, the number of points in the original detected contour is reduced by means of subsampling. Using a sampling percentage of 1 per cent means that every hundredth point of the contour was used in the pose estimation algorithm. Figure 4 shows a typical example of a contour sampled at 1 per cent. The results in Table 2 show that only the NOA method produces larger errors when the sampling percentage is lower than 5 per cent. This table also shows that, especially for the tibial component, the rotation error of the IIPM method is lower than the rotation errors for the DIF and NOA methods. Considering the results of this experiment, a standard sampling rate of 10 per cent was chosen for all other experiments in order to reduce the calculation time while maintaining the accuracy of the results. Proc. Instn Mech. Engrs Vol. 218 Part H: J. Engineering in Medicine
Fig. 4 Typical example of a subsampled contour. The subsampled femur and tibia contours contain 16 and 17 points respectively, which is 1 per cent of the original contours
4.2 Influence of the size of drop-outs in the actual contour In this experiment, a part of the actual contour of the components was removed. This simulates a worst-case scenario in which the component is partially occluded by the other component of the knee prosthesis. 5, 25, 50 and 75 per cent of the actual contour were removed. Figure 5 shows a typical example of the sizes of these drop-outs. The results in Table 3 show that the NOA H06003 © IMechE 2004
ALGORITHMS FOR MODEL-BASED ROENTGEN STEREOPHOTOGRAMMETRIC ANALYSIS
235
Table 2 Errors in translation and rotation for different sampling percentages of the actual contour 1%
Femur
Tibia
5%
10%
100%
Tr.* (mm)
Rot.† (deg)
Tr.* (mm)
Rot.† (deg)
Tr.* (mm)
Rot.† (deg)
Tr.* (mm)
Rot.† (deg)
IIPM
Med.‡ Max.§
0.13 0.33
0.11 0.15
0.16 0.31
0.13 0.22
0.16 0.31
0.13 0.20
0.14 0.34
0.13 0.22
DIF
Med.‡ Max.§
0.15 0.33
0.23 0.36
0.16 0.29
0.19 0.37
0.16 0.30
0.18 0.42
0.14 0.30
0.18 0.35
NOA
Med.‡ Max.§
0.39 0.59
0.83 1.16
0.16 0.40
0.19 0.27
0.15 0.35
0.19 0.35
0.14 0.32
0.19 0.38
IIPM
Med.‡ Max.§
0.14 0.25
0.35 1.22
0.11 0.23
0.15 0.31
0.12 0.23
0.17 0.29
0.12 0.21
0.13 0.26
DIF
Med.‡ Max.§
0.16 0.28
0.46 0.81
0.12 0.24
0.18 0.28
0.12 0.27
0.20 0.34
0.10 0.20
0.13 0.32
NOA
Med.‡ Max.§
2.32 5.15
5.53 11.58
0.15 0.22
0.26 0.79
0.12 0.26
0.19 0.52
0.13 0.23
0.17 0.32
* Tr. is the translation of the midpoint of the component. † Rot. is the rotation about the helical axis. ‡ Med. is the median of eight calculated migrations. § Max. is the maximum value of the eight calculated migrations.
Fig. 5 Typical example of drop-outs in the contour of (a) the femur and (b) the tibia. An error of 75 per cent means that, for the femur component, only the contour part above the horizontal 75 per cent line is used for pose estimation and, for the tibia component, only the contour part below the horizontal 75 per cent line
Table 3 Errors in translation and rotation for different inaccuracy sizes of the actual contour 75%
Femur
Tibia
50%
25%
5%
Tr.* (mm)
Rot.† (deg)
Tr.* (mm)
Rot.† (deg)
Tr.* (mm)
Rot.† (deg)
Tr.* (mm)
Rot.† (deg)
IIPM
Med.‡ Max.§
0.17 0.96
0.37 2.61
0.17 0.35
0.17 0.63
0.13 0.34
0.16 0.24
0.15 0.32
0.17 0.23
DIF
Med.‡ Max.§
0.41 4.11
1.19 8.33
0.14 0.28
0.22 0.38
0.14 0.33
0.18 0.34
0.15 0.31
0.19 0.35
NOA
Med.‡ Max.§
12.76 16.93
11.99 22.10
6.60 7.01
9.82 12.32
0.94 6.23
5.15 8.35
0.13 0.29
0.14 0.32
IIPM
Med.‡ Max.§
0.52 2.86
1.09 7.00
0.18 0.45
0.48 0.90
0.14 0.22
0.24 0.44
0.13 0.24
0.16 0.45
DIF
Med.‡ Max.§
2.61 4.88
4.09 8.39
0.26 0.43
0.46 0.70
0.16 0.30
0.17 0.34
0.14 0.23
0.19 0.43
NOA
Med.‡ Max.§
5.68 16.59
9.07 19.32
6.62 19.37
10.56 22.36
6.41 11.87
9.78 19.61
0.34 1.04
0.85 3.11
* Tr. is the translation of the midpoint of the component. † Rot. is the rotation about the helical axis. ‡ Med. is the median of the eight calculated migrations. § Max. is the maximum value of the eight calculated migrations. H06003 © IMechE 2004
Proc. Instn Mech. Engrs Vol. 218 Part H: J. Engineering in Medicine
236
B L KAPTEIN, E R VALSTAR, B C STOEL, P M ROZING AND J H C REIBER
method produces very large errors when part of the contour is lacking. For the DIF and IIPM methods, implemented to handle incomplete contours, the error increases when more than 25 per cent of the contour is lacking.
error in the pose estimation algorithm. The results in Table 4 show that, without noise, all methods are able to estimate the pose of the model exactly. Increasing the noise results in larger errors for all methods, but the IIPM method is less sensitive to this noise than is the DIF method, which in its turn is less sensitive than the NOA method. Note that, with higher noise levels, the calculated rotation error of the tibial component is larger than the calculated rotation error of the femoral component.
4.3 Influence of noise on the actual contour In this experiment, uniformly distributed noise was added to the coordinates of the points of the actual contour in a direction perpendicular to the local direction of the contour. To exclude the influence of the contour detection and calibration, the actual contours were computer generated. For this, the models were positioned in the same poses as were used in the phantom experiments, described in this paper. The virtually projected contours were recorded and distorted by the noise to be used as actual contours. In Fig. 6 a typical example of an actual contour distorted with noise is shown. Because the actual pose of the model was known in this experiment, the migration between the actual pose and the estimated pose was calculated. Because of this, the error in the calculated migration is exclusively determined by the
4.4 Influence of shrinkage or expansion of the contour In this experiment, the size of the contour was changed by adding or subtracting an expanding vector to the points of the actual contour in a direction perpendicular to the local tangent direction of the actual contour. In this way, the contour is shrunk or expanded, simulating a systematic error in the contour. The lengths of the expanding vectors were chosen to be −0.5, −0.1, 0.1 and 0.5 mm respectively. To relate this to the spatial resolution of the images, the size of a pixel is 0.17 mm (150 dots/in). The results in Table 5 show that, except for a larger median and maximum value for rotation of the tibia component for an expanding vector of 0.1 mm, an expanding vector of −0.1 or 0.1 mm does not have much influence on the results. An expanding vector of −0.5 or 0.5 mm results in larger error values for all tests.
5 DISCUSSION Fig. 6 Typical example of a computer-generated, virtually projected contour of femur and tibia components distorted by uniformly distributed noise in the range from −1 to 1 mm
One of the main difficulties in RSA is the marking of the prostheses. It drastically increases the costs and lengthens the start-up period of an RSA study. RSA
Table 4 Errors in translation and rotation for different noise levels of the actual contour 1.0
Femur
Tibia
0.5
0.1
0.0
Tr.* (mm)
Rot.† (deg)
Tr.* (mm)
Rot.† (deg)
Tr.* (mm)
Rot.† (deg)
Tr.* (mm)
Rot.† (deg)
IIPM
Med.‡ Max.§
0.12 0.29
0.43 0.70
0.06 0.13
0.22 0.35
0.01 0.03
0.04 0.06
0.00 0.01
0.00 0.01
DIF
Med.‡ Max.§
0.16 0.48
0.55 0.95
0.10 0.22
0.34 0.54
0.02 0.05
0.05 0.09
0.01 0.01
0.01 0.03
NOA
Med.‡ Max.§
0.36 0.65
0.67 1.04
0.13 0.23
0.44 0.60
0.04 0.06
0.09 0.15
0.01 0.02
0.02 0.03
IIPM
Med.‡ Max.§
0.22 0.46
1.24 2.84
0.12 0.31
0.83 1.30
0.02 0.03
0.17 0.30
0.01 0.02
0.02 0.03
DIF
Med.‡ Max.§
0.35 0.56
2.69 6.15
0.22 0.41
1.33 4.81
0.03 0.05
0.21 0.37
0.01 0.02
0.04 0.10
NOA
Med.‡ Max.§
0.34 0.53
1.09 2.67
0.14 0.69
0.96 2.78
0.06 0.49
0.32 3.75
0.01 0.03
0.10 0.19
* Tr. is the translation of the midpoint of the component. † Rot. is the rotation about the helical axis. ‡ Med. is the median of the eight calculated migrations. § Max. is the maximum value of the eight calculated migrations. Proc. Instn Mech. Engrs Vol. 218 Part H: J. Engineering in Medicine
H06003 © IMechE 2004
ALGORITHMS FOR MODEL-BASED ROENTGEN STEREOPHOTOGRAMMETRIC ANALYSIS
237
Table 5 Errors in translation and rotation for different sizes of the actual contour −0.5
Femur
Tibia
−0.1
0.1
0.5
Tr.* (mm)
Rot.† (deg)
Tr.* (mm)
Rot.† (deg)
Tr.* (mm)
Rot.† (deg)
Tr.* (mm)
Rot.† (deg)
IIPM
Med.‡ Max.§
0.21 0.35
0.53 0.74
0.12 0.26
0.17 0.24
0.13 0.28
0.12 0.20
0.20 0.48
0.35 0.72
DIF
Med.‡ Max.§
0.40 0.54
1.15 1.66
0.13 0.26
0.22 0.26
0.14 0.33
0.14 0.24
0.34 0.45
1.06 1.74
NOA
Med.‡ Max.§
0.45 0.55
1.18 1.65
0.14 0.21
0.25 0.30
0.15 0.37
0.16 0.28
0.41 0.56
1.04 1.88
IIPM
Med.‡ Max.§
0.31 0.90
0.98 2.97
0.14 0.22
0.15 0.54
0.12 0.32
0.38 0.94
0.50 2.99
1.64 6.57
DIF
Med.‡ Max.§
0.46 0.96
1.38 3.41
0.13 0.28
0.26 0.66
0.19 0.27
0.42 0.78
0.65 0.91
2.23 4.33
NOA
Med.‡ Max.§
0.37 1.01
1.11 3.22
0.17 0.32
0.14 0.79
0.12 0.27
0.35 0.66
0.51 1.24
1.98 4.02
* Tr. is the translation of the midpoint of the component. † Rot. is the rotation about the helical axis. ‡ Med. is the median of the eight calculated migrations. § Max. is the maximum value of the eight calculated migrations.
with standard implants is less expensive and less complicated and so the main barrier to start an RSA study is removed, increasing the number of RSA studies. Because RSA is considered to be the golden standard to measure the micromotion of implants with respect to the bone in total joint arthroplasty, an increase in the number of RSA studies implies an increase in the knowledge about the process of aseptic loosening of the implant. The goal of this paper was to evaluate two improved pose estimation algorithms and to compare their results with the results of the NOA algorithm. Improvement in the NOA algorithm is necessary because this algorithm cannot handle contours that contain drop-outs. The algorithms were assessed on the basis of their sensitivities to noise in the actual contour, to the amount of dropouts in the actual contour, to the number of points in the actual contour and to shrinkage or expansion of the actual contour. The results of experiments 4.1 and 4.2 (Table 2 and Table 3 respectively) show that the DIF and IIPM methods are not very sensitive to subsampling of the actual contours, or drop-outs in the actual contours; only for very low sampling rates ( lower than 5 per cent) or very large drop-outs ( larger than 25 per cent) do larger errors occur. This insensitivity can be explained by the fact that these methods only use the separate points of the actual contour while the NOA method needs a complete and closed contour. In all experiments, a 10 per cent uniform sampling of the contours was chosen. In experiment 4.3, the influence of noise in the actual contour was studied. The results in Table 4 show that, in perfect conditions, the poses of the femoral and tibial components can be calculated perfectly. For higher noise values, the error in orientation of the tibial component becomes large compared with the error in orientation of the femoral component. This H06003 © IMechE 2004
is a result of the shape of the tibial component but, as the phantom experiments show better results, the noise in the detected actual contours is not a problem. In experiment 4.4, the actual contour was shrunk or expanded. The results show that shrinkage or expansion of the actual contour by a small value of 0.1 mm does not have much influence on the results. Since the size of a pixel is 0.17 mm, it may be concluded that the contour detection algorithm detects the contour correctly. In the current study, the SQP optimization scheme as described by Spellucci [23] was used to find the minimum in the solution space. To reduce the sensitivity of the algorithm to local minima, a more robust optimization scheme could be used. The disadvantages of more robust optimization schemes are that they require many more function calls. Therefore, a difference measure that has fewer local minima in the solution space is preferred to minimize calculation time. Because all other comparable pose estimation methods that have been presented in the literature were not tested in double-focus experiments, the results reported here cannot be compared with results from the literature. In the noise experiments, computer-generated actual contours distorted with noise were used. Because of this, the only variables in these experiments were the noise and the model that was used in the experiment (tibial or femoral ). Because, for higher noise levels, the error in the orientation was larger for the tibial component than for the femoral component, it can be concluded that the accuracy of model-based RSA depends on the shape of the projected contours of the component, and the changes in this shape when the object is rotated. When a clinical model-based RSA study of a specific implant is considered, it is necessary to carry out new simulation experiments using the model for that specific implant in order to estimate the possible accuracy for that implant. Proc. Instn Mech. Engrs Vol. 218 Part H: J. Engineering in Medicine
238
B L KAPTEIN, E R VALSTAR, B C STOEL, P M ROZING AND J H C REIBER
Based on the results of all experiments, it is clear that the IIPM and DIF methods are preferable over the NOA method under all circumstances. Since the IIPM method uses an iterative algorithm, it uses fewer function calls than the DIF method that needs partial derivatives to be calculated. This makes the IIPM method the fastest of the three methods tested in this study.
6 CONCLUSIONS From the results presented in this paper, it is concluded that the new model-based RSA algorithms, IIPM and DIF, are more robust to varying parameters than is the old NOA algorithm. These new algorithms increase the accuracy of model-based RSA. However, clinical experiments must prove whether model-based RSA is an accurate replacement for marker-based RSA.
7
8
9 10
11
12
ACKNOWLEDGEMENTS The authors are very grateful to MEDIS Medical Imaging Systems BV and the Dutch Technology Foundation STW for their financial support of this project. The authors are also very grateful to StrykerHowmedica Osteonics for providing the CAD models and prosthetic components, TNO Industry for providing the RE models of the prosthetic components, and to Eric Garling for the assistance with obtaining the RSA radiographs.
REFERENCES 1 Selvik, G. Roentgen stereophotogrammetry. A method for the study of the kinematics of the skeletal system. Acta Orthop. Scand. Suppl., 1989, 232, 1–51. 2 Ryd, L., Hansson, U., Blunn, G., Lindstrand, A. and Toksvig-Larsen, S. Failure of partial cementation to achieve implant stability and bone ingrowth: a long-term roentgen stereophotogrammetric study of tibial components. J. Orthop. Res., 1999, 17, 311–320. 3 Nilsson, K. G., Karrholm, J., Carlsson, L. and Dalen, T. Hydroxyapatite coating versus cemented fixation of the tibial component in total knee arthroplasty: prospective randomized comparison of hydroxyapatite-coated and cemented tibial components with 5-year follow- up using radiostereometry. J. Arthroplasty, 1999, 14, 9–20. 4 Nelissen, R. G., Valstar, E. R. and Rozing, P. M. The effect of hydroxyapatite on the micromotion of total knee prostheses. A prospective, randomized, double-blind study. J. Bone Jt Surg., 1998, 80A, 1665–1672. 5 Ka¨rrholm, J. Roentgen stereophotogrammetry. Review of orthopedic applications. Acta Orthop. Scand., 1989, 60, 491–503. 6 Valstar, E. R., Vrooman, H. A., Toksvig-Larsen, S., Ryd, L. and Nelissen, R. G. Digital automated RSA compared to Proc. Instn Mech. Engrs Vol. 218 Part H: J. Engineering in Medicine
13
14
15
16
17
18
19
20
21
22 23 24
manually operated RSA. J. Biomechanics, 2000, 33, 1593–1599. Ka¨rrholm, J., Borssen, B., Lowenhielm, G. and Snorrason, F. Does early micromotion of femoral stem prostheses matter? 4–7-year stereoradiographic follow-up of 84 cemented prostheses. J. Bone Jt Surg., 1994, 76B, 912–917. Ryd, L., Albrektsson B. E., Carlsson L., Dansgard F., Herberts P., Lindstrand A., Regner L. and ToksvigLarsen S. Roentgen stereophotogrammetric analysis as a predictor of mechanical loosening of knee prostheses. J. Bone Jt Surg., 1995; 77B, 377–383. Bo¨rlin, N. High precision measurements in digital radiographs. Report, Umea˚ University, Umea˚, Sweden, 1997. Vrooman, H. A., Valstar, E. R., Brand, G. J., Admiraal, D. R., Rozing, P. M. and Reiber, J. H. Fast and accurate automated measurements in digitized stereophotogrammetric radiographs. J. Biomechanics, 1998, 31, 491–498. de Jong, F. W. Mechanical analysis of hydroxyl-apatite coated knee prosthesis. Thesis, Technical University Eindhoven, The Netherlands, 1997. Lowe, D. G. Three-dimensional object recognition from single two-dimensional images. Artif. Intell., 1987, 31, 355–395. Wunsch, H. G. Registration of CAD-models to images by iterative inverse perspective matching. In Proceedings of the 13th International Conference on Pattern Recognition, Vienna, Austria, 1996, pp. 77–83. Banks, S. A. and Hodge, W. A. Accurate measurement of three-dimensional knee replacement kinematics using single-plane fluoroscopy. IEEE Trans. Biomed. Engng, 1996, 43, 638–649. Hoff, W. A., Komistek, R., Dennis, D. A., Gabriel, S. M. and Walker, S. A. Three-dimensional determination of femoral–tibial contact positions under in vivo conditions using fluoroscopy. Clin. Biomechanics, 1998, 13, 455–472. Lavalle´e, S. and Szeliski, R. Recovering the position and orientation of free-form objects from image contours using 3D distance maps. IEEE Trans. PAMI, 1995, 17, 378–390. Gue´ziec, A., Wu, K., Kalvin, A, Williamson, B., Kazanzides, P. and Van Vorhis, R. Providing visual information to validate 2-D to 3-D registration. Med. Image Analysis, 2000, 4, 357–374. Fukuoka, Y., Hoshino, A. and Ishida, A. A simple radiographic measurement method for polyethylene wear in total knee arthroplasty. IEEE Trans. Rehabil. Engng, 1999, 7, 228–233. Banks, S. A., Markovich, G. D. and Hodge, W. A. The mechanics of knee replacements during gait. In vivo fluoroscopic analysis of two designs. Am. J. Knee Surg., 1997, 10, 261–267. Valstar, E. R., de Jong, F. W., Vrooman, H. A., Rozing, P. M. and Reiber, J. H. C. Model-based roentgen stereophotogrammetry of orthopaedic implants. J. Biomechanics, 2001, 34, 715–722. Chen, L., Armstrong, C. W. and Raftopoulos, D. D. An investigation on the accuracy of three-dimensional space reconstruction using the direct linear transformation technique. J. Biomechanics, 1994, 27, 493–500. Canny, J. A computational approach to edge detection. IEEE Trans. PAMI, 1986, 8, 679–698. Spellucci, P. DONLP2. http://www.mathematik.tu-darmstadt.de/, 2001. Besl, P. J. and McKay, N. D. A method for registration of 3-D shapes. IEEE Trans. PAMI, 1992, 14, 239–256. H06003 © IMechE 2004