International Journal of
Geo-Information Article
Event-Driven Distributed Information Resource-Focusing Service for Emergency Response in Smart City with Cyber-Physical Infrastructures Changjiang Xiao 1,2 ID , Nengcheng Chen 1,2, * and Zeqiang Chen 1,2 1
2 3
*
ID
, Jianya Gong 1,2,3 , Wei Wang 1,2 , Chuanbo Hu 1
State Key Lab for Information Engineering in Surveying, Mapping and Remote Sensing, Wuhan University, 129 Luoyu Road, Wuhan 430079, China;
[email protected] (C.X.);
[email protected] (J.G.);
[email protected] (W.W.);
[email protected] (C.H.);
[email protected] (Z.C.) Collaborative Innovation Center of Geospatial Technology, 129 Luoyu Road, Wuhan 430079, China School of Remote Sensing and Information Engineering, Wuhan University, 129 Luoyu Road, Wuhan 430079, China Correspondence:
[email protected]; Tel.: +86-138-8601-9231
Academic Editors: Carlos Granell Canut and Wolfgang Kainz Received: 24 May 2017; Accepted: 3 August 2017; Published: 15 August 2017
Abstract: The smart city has become a popular topic of investigation. How to focus large amounts of distributed information resources to efficiently cope with public emergencies and provide support for personalized decision-making is a vitally important issue in the construction of smart cities. In this paper, an event-driven focusing service (EDFS) method that uses cyber-physical infrastructures for emergency response in smart cities is proposed. The method consists of a focusing service model at the top level, an informational representation of the model and a focusing service process to operate the service model in emergency response. The focusing service method follows an event-driven mechanism that allows the focusing service process to be triggered by public emergencies sensed by wireless sensor networks (WSNs) and mobile crowd sensing, and it integrates the requirements of different societal entities with regard to response to emergencies and information resources, thereby providing comprehensive and personalized support for decision-making. Furthermore, an EDFS prototype system is designed and implemented based on the proposed method. An experiment using a real-world scenario—the gas leakage in August 2014 in Taiyuan, China—is presented demonstrating the feasibility of the proposed method for assisting various societal entities in coping with and efficiently responding to public emergencies. Keywords: smart city; cyber-physical infrastructure; focusing service; geospatial information; mobile crowd sensing; event-driven mechanism; emergency response
1. Introduction The smart city, one of the most popular topics and the most cutting-edge issues, has attracted widespread attention and has renovated the traditional city concept [1–5]. In analogy to a living organism, the intelligence of a smart city resides in its increasingly effective combination of digital telecommunication networks (the nerves), ubiquitously embedded intelligence (the brains), sensors and tags (the sensory organs), and software (the knowledge and cognitive competence) [6]. Moreover, from the perspective of a system, a smart city can also be regarded as a dynamic and complex system that evolves in space and time following trajectories that are hard to predict [7], mainly including a physical part and a cyber part, which is also called cyber-physical systems (CPS) [8–12]. Figure 1 presents a conceptual diagram of an operational smart city. As depicted in this figure,
ISPRS Int. J. Geo-Inf. 2017, 6, 251; doi:10.3390/ijgi6080251
www.mdpi.com/journal/ijgi
ISPRS Int. J. Geo-Inf. 2017, 6, 251 ISPRS Int. J. Geo-Inf. 2017, 6, 251
2 of 22 2 of 22
the sensing belong to belong the physical component the CPS and sensing figure, the infrastructures sensing infrastructures to the physical of component of comprise the CPS various and comprise devices such as diverse heterogeneous sensors (in situ/remote and fixed/mobile sensors, such as various sensing devices such as diverse heterogeneous sensors (in situ/remote and fixed/mobile radio-frequency identification [RFID], identification the Moderate Resolution Imaging Spectroradiometer sensors, such as radio-frequency [RFID], the Moderate Resolution [MODIS], Imaging and the Global Positioning sensors in smart phones) [13,14]. Theincommunication Spectroradiometer [MODIS],System and the[GPS] Global Positioning System [GPS] sensors smart phones) infrastructures (e.g., 3G/4G/ZigBee/Wi-Fi/WiMAX/WSN) and cloud computing infrastructures [13,14]. The communication infrastructures (e.g., 3G/4G/ZigBee/Wi-Fi/WiMAX/WSN) and cloud (e.g., Amazon EC2, Microsoft Azure, Xen Cloud Hive,Platform, Impala, Storm, Pig, computing infrastructures (e.g., Amazon EC2, Platform, MicrosoftHadoop, Azure, HBase, Xen Cloud Hadoop, and SPARK) the cyber ofbelong the CPS. HBase, Hive, belong Impala,toStorm, Pig,component and SPARK) to the cyber component of the CPS.
Figure Figure 1. 1. Conceptual Conceptual diagram diagram of of an an operational operational smart smart city. city.
The operational smart city is driven by various information resources, including both data and The operational smart city is driven by various information resources, including both data and service resources. Data resources consist of archived data (e.g., basic geographic data, archived service resources. Data resources consist of archived data (e.g., basic geographic data, archived historical sensing data, remote sensing images, unmanned aerial vehicle images, RFID data, and historical sensing data, remote sensing images, unmanned aerial vehicle images, RFID data, and video video monitoring data) and real-time data streams (e.g., monitoring data for city water, electricity, monitoring data) and real-time data streams (e.g., monitoring data for city water, electricity, fuel, fuel, and gas supplies) produced by sensing webs. Service resources include geospatial data services and gas supplies) produced by sensing webs. Service resources include geospatial data services built on built on interoperable standards [15], e.g., the Web Feature Service (WFS) [16] for geographical interoperable standards [15], e.g., the Web Feature Service (WFS) [16] for geographical features, the Web features, the Web Map Service (WMS) [17] for geo-registered map images, the Web Coverage Service Map Service (WMS) [17] for geo-registered map images, the Web Coverage Service for raster data, for raster data, the Sensor Observation Service (SOS) [18] for near-real-time sensor observations, the the Sensor Observation (SOS) for near-real-time sensor the for Websmart Processing Web Processing ServiceService (WPS) [19] for[18] encapsulating analysis and observations, decision models cities, Service (WPS) [19] for encapsulating analysis and decision models for smart cities, the Sensor Event the Sensor Event Service (SES) [20] for filtering of and subscription to sensor observations (events), Service [20] for filtering of (WNS) and subscription to sensor observations (events),various and the Web and the (SES) Web Notification Service [21] for message notification. Meanwhile, public Notification Service (WNS) [21] for message notification. Meanwhile, various public emergencies, such emergencies, such as security incidents, transportation accidents, and accidents involving public as security incidents, transportation accidents, and accidents involving public facilities and equipment, facilities and equipment, occur frequently and can result in heavy casualties and economic losses occurThese frequently and can result in heavy and losses [22]. These rich information [22]. rich information resources cancasualties be utilized toeconomic assist smart-city decision-makers in coping resources can be utilized to assist smart-city decision-makers in coping with are public emergencies with public emergencies and making decisions. However, these resources overflowed and and are making decisions. However, these resources are overflowed and are geographically distributed on geographically distributed on different network nodes. Thus, discovering proprietary information different network nodes. Thus, discovering proprietary information resources efficiently and focusing resources efficiently and focusing them on the effective handling of and personalized decision-making them onfor thepublic effective handling of personalized decision-making support is support emergencies is and an urgent problem that must be solved for for thepublic smart emergencies city paradigm an urgent must be solvedservice for thehas smart city paradigm [2]. To help solve this problem, [2]. To helpproblem solve thisthat problem, focusing been proposed in some studies. focusing service has been proposed in some studies. Focusing service, in essence, focuses massive amounts of information resources on a specific task and provides personalized service to the various roles involved. Some preliminary work has been conducted in this area, primarily concerning its conceptual aspects. Yang et al. considered
ISPRS Int. J. Geo-Inf. 2017, 6, 251
3 of 22
Focusing service, in essence, focuses massive amounts of information resources on a specific task and provides personalized service to the various roles involved. Some preliminary work has been conducted in this area, primarily concerning its conceptual aspects. Yang et al. considered focusing service to be one of the main solutions to providing personal, accurate service of the intent information resources [23]. Huang et al. viewed information focusing as a new means of information service and presented the concept of and a mathematical model for semantic relatedness-based information focusing [24]. Zhu et al. proposed a hierarchical semantic constraint model for focusing remote sensing information services, in which constraints establish the connections among user semantics, the data service and processing services, and basic semantic reasoning toward service discovery, selection, and composition [25]. The combination of data and services on demand is one method of focusing the massive amounts of available information resources and thus realizing focusing service. Yue et al. developed a semantic-enhanced geospatial catalog service to satisfy the demands for the discovery and analysis of geospatial information (geospatial data, services/service chains) in a cyber infrastructure [26]. Yang et al. proposed a RESTFul-based workflow interoperation method to integrate heterogeneous workflows, e.g., one workflow to access sensor information and one to process it, into an interoperable unit [27]. Furthermore, Chen et al. used SensorML to construct a geoprocessing e-Science workflow model to internally integrate the sensor system, observation, and processes (physical and non-physical) under a sensor web environment [28]. Moreover, for operation in a cloud environment, an agent-based approach was proposed to support the execution of workflows that require large amounts of computational resources and expensive hardware in one or multiple clouds [29]. These works have primarily explored the technical possibilities and feasibility of various types of workflow design, implementation and execution. Additionally, these studies have paid considerable attention to remote sensing sensors for large-scale applications, such as province-scale normalized difference vegetation index (NDVI) calculations [28], rather than applications of in situ or mobile smart sensors, which are more relevant to the rapid operation of cities because of their low cost, relatively simple deployment, high accuracy, continuity and instantaneity. Event-driven mechanism is critical for rapid public emergency response that has a minimum tolerance for time of reaction to events in smart cities. Yu et al. proposed a BPEL-based geoprocessing web service workflow that can be executed automatically upon the triggering of an event, such as the acquisition of a new observation at a new time, to perform the message-level coordination of sensors and earth science models in the Sensor Web environment [30]. Fan et al. considered both Observations & Measurements (O&M) information and the state changes of tasks as events and designed an active on-demand service method for geospatial data retrieval based on an event-driven architecture [31]. These studies have addressed micro and abstract events exceptionally well. However, they are somewhat unsuitable for macro urban public emergency scenarios. Thus, developing a new focusing service method driven by macro urban events for rapid emergency response in smart cities is a necessity. To achieve the above goal, this paper proposes an urban macro event-driven distributed information resource-focusing service method for public emergency response in smart cities with cyber-physical infrastructures. It utilizes in situ sensors and sensors in smart phones to collect the context parameters of public emergencies and uses these parameters and other web-accessible data resources distributed on different network nodes as inputs to the analysis and decision-making models to produce analysis and decision results [32]. These results, with their necessary descriptions, can be further shared on the web for application by different societal entities. This study offers the following four contributions: (1) An event-driven focusing service model is proposed. In the model, macro urban public emergencies trigger the focusing service process, and the requirements of handling urban public emergencies and urban information resources are integrated to assist different societal entities in their rapid response to public emergencies and making sensible decisions.
ISPRS Int. J. Geo-Inf. 2017, 6, 251
4 of 22
(2) An informational representation of the proposed focusing service model (IRFSM) is developed. It enables the focusing service model to operate in cyber infrastructures, seamlessly bridging public emergency and information resources. (3) An event-driven focusing service process is established based on the IRFSM. It provides operational procedures for the execution of the focusing service throughout the entire lifecycle of public emergency response. (4) A focusing service prototype system is developed based on the proposed focusing service model, its informational representation and the focusing service process. It is leveraged for public emergency response in a real-world scenario (the gas leakage in August 2014 in Taiyuan, China) to test its feasibility and effectiveness in assisting various societal entities to achieve personalized rapid response to public emergencies. The remainder of the paper is organized as follows. In Section 2, the proposed method is detailed, including the focusing service model, its informational representation and the focusing service process. In Section 3, an experiment to test the proposed method is presented, considering the gas leakage event that occurred in August 2014 in Taiyuan, China, as a study case. Section 4 provides discussions of the proposed method, including its feasibility, advantages, scope and limitations. Finally, in Section 5, several conclusions are provided, including possible directions for future work. 2. Methods This paper proposes an event-driven distributed information resource-focusing service method for public emergency response in smart cities. The proposed method, from a macro perspective, consists of a focusing service model that provides an in-depth analysis of the focusing service provision process, offering guidance for rapid response to public emergencies. To make the model operate smoothly and to seamlessly integrate the requirements of public emergency handling, rich urban information resources, and decision-making, a bridge between public emergencies and urban information resources—an informational representation of the focusing service model—is established. 2.1. Focusing Service Model The focusing service model, as depicted in Figure 2, is based on the object and process models introduced by Governance Enterprise Architecture (GEA) [33,34] with the addition of event-driven concepts and features. In the proposed service model, the focusing service is triggered by public emergency events in smart cities and serves various societal entities, including governments, enterprises and citizens. Being a generic model, the service description covers many different areas of application in public emergency response, making it highly flexible for use in different cases of focusing service provision. Public Administration Entities are a type of Governance Entities that participate in service provision, fulfilling one of the following roles during the focusing service provision phase:
• • • •
Service Provider that provides the focusing service to Societal Entities, i.e., government decision-makers, enterprises, and citizens. Evidence Provider that provides Service Providers with the necessary Evidence to execute the Focusing Service. Consequence Receiver that should be informed following the execution of the Focusing Service. Service Collaborator that participates in providing the focusing service.
ISPRS Int. J. Geo-Inf. 2017, 6, 251
5 of 22
ISPRS Int. J. Geo-Inf. 2017, 6, 251
5 of 22
Figure 2. 2. Event-driven Event-driven focusing focusing service service model model for for city city information information resources. resources. Figure
Preconditions set the general framework in which the focusing service should be performed Preconditions set the general framework in which the focusing service should be performed and the underlying business rules that should be fulfilled for its successful execution. Preconditions and the underlying business rules that should be fulfilled for its successful execution. Preconditions can be formally expressed as a set of clauses (or rules) and are validated by a Piece of Evidence can be formally expressed as a set of clauses (or rules) and are validated by a Piece of Evidence serving a Purpose. Because Evidence is pure information, it is stored in Evidence Placeholders (e.g., serving a Purpose. Because Evidence is pure information, it is stored in Evidence Placeholders (e.g., an administrative document). an administrative document). The Outcome refers to the different types of results that a focusing service may have. The The Outcome refers to the different types of results that a focusing service may have. The focusing focusing service model defines three types of Outcomes: service model defines three types of Outcomes: • Output, which is the documented decision of the Service Provider regarding the service • Output, is the documented the Service regarding service requestedwhich by a Societal Entity. This isdecision currentlyofembedded andProvider reaches the client in the the form of requested by a Societal Entity. This is currently embedded and reaches the client in the form of an Evidence Placeholder. an Evidence • Effect, whichPlaceholder. is the change in the state of the real world that is caused by the execution of a • Effect, which is the change in the state the of the real world thatisis the caused by the execution ofcertificate, a service. service. In public administration, service Effect actual permission, In public administration, service Effect is the actual certificate, restriction or restriction or punishment the to which a citizen is entitled. In permission, cases in which public administration punishment to which a citizen is entitled. In cases in which public administration refuses the refuses the provision of a service, there is no effect. provision of a service, there is no effect. • Consequence, which is information regarding the executed focusing service that needs to be • Consequence, which is information regarding executed focusing service that needs to be forwarded to interested parties, i.e., other publicthe agencies (Consequence Receivers). forwarded to interested parties, i.e., other public agencies (Consequence Receivers). 2.2. Informational Representation of the Focusing Service Model 2.2. Informational Representation of the Focusing Service Model The focusing service model is an abstract conceptual model that depicts the roles of the The focusing model is an abstract conceptual model that depicts roles of the participants participants in theservice focusing service, the constraints of the focusing service,the the inputs and outcomes in the focusing service, the constraints of the focusing service, the inputs and outcomes of the focusing of the focusing service, the service object of the focusing service and the service mechanism service, the service object of the focusing high-level service andguidance the servicefor mechanism (event-driven), ultimately (event-driven), ultimately providing the focusing service for public providing high-level guidance for the focusing service for public emergency response. To allow itthe emergency response. To allow the focusing service model to operate in cyber infrastructures, is focusing modelan to informational operate in cyber infrastructures, it isfocusing necessary to establish informational necessaryservice to establish representation of the service model,an bridging public representation the focusingresources. service model, bridging public emergency and information resources. emergency andofinformation The IRFSM is specific to the type and event stage. PutPut another way,way, it is ait prearranged plan The IRFSM is specific to theevent event type and event stage. another is a prearranged for type of type publicofemergency at a certain Fromstage. an information service perspective, plana certain for a certain public emergency at stage. a certain From an information service perspective, it is also an abstract service chain for retrieving and processing information resources and producing results for assistance in decision-making. Figure 3 presents a UML diagram of the proposed IRFSM.
ISPRS Int. J. Geo-Inf. 2017, 6, 251
6 of 22
it is also an abstract service chain for retrieving and processing information resources and producing results for assistance in decision-making. Figure 3 presents a UML diagram of the proposed IRFSM. ISPRS Int. J. Geo-Inf. 2017, 6, 251
6 of 22
Figure 3. UML diagram of the IRFSM. Figure 3. UML diagram of the IRFSM.
2.2.1. Metadata 2.2.1. Metadata The proposed IRFSM consists of five aspects of information, in accordance with the focusing The proposed IRFSM consists of five aspects of information, in accordance with the focusing I, IRFSMRE, IRFSMCS, IRFSMA, IRFSMC}, service model, which can be expressed as IRFSM = {IRFSM service model, which can be expressed as IRFSM = {IRFSMI , IRFSMRE , IRFSMCS , IRFSMA , IRFSMC }, where the individual items represent “Identification”, “Related Event”, “Component Service”, where the individual items represent “Identification”, “Related Event”, “Component Service”, “Administrative” and “Constraints” information, respectively. “Administrative” and “Constraints” information, respectively. (1) Identification. The Identification information specifies the basic information regarding the (1) Identification. The Identification information specifies the basic information regarding the IRFSM for its discovery, including the name, abstract, keywords, identification, applications and IRFSM for its discovery, including the name, abstract, keywords, identification, applications and provider of the abstract focusing service chain. The identification of each service chain in the provider of the abstract focusing service chain. The identification of each service chain in the registration center is unique. The remaining information is useful for the discovery of a desired registration center is unique. The remaining information is useful for the discovery of a desired abstract focusing service chain. abstract focusing service chain. (2) Related Event. The Related Event information describes the related event type and stage to (2) Related Event. The Related Event information describes the related event type and stage to which the abstract focusing service chain is applicable. It can be used to quickly discover the most which the abstract focusing service chain is applicable. It can be used to quickly discover the most suitable abstract focusing service chain when a public emergency occurs. suitable abstract focusing service chain when a public emergency occurs. (3) Component Service. The Component Service information consists of a complex process and a (3) Component Service. The Component Service information consists of a complex process and figure. The complex process consists of one or more atom processes and the control flows between a figure. The complex process consists of one or more atom processes and the control flows between them. Each atom process can be regarded as a model that performs a specific function. The figure is them. Each atom process can be regarded as a model that performs a specific function. The figure is further composed of process figures and flow figures for the visualization of the abstract service chain. The Outcome is also part of the Component Service information and is represented by OutputParam.
ISPRS Int. J. Geo-Inf. 2017, 6, 251
7 of 22
further composed of process figures and flow figures for the visualization of the abstract service chain. The Outcome is also part of the Component Service information and is represented by OutputParam. (4) Administration. The Administration information includes contact, history, and document features that are important for administrative management of the abstract focusing service chain. In particular, the history information records the update history of the abstract focusing service chain. (5) Constraints. The Constraints information includes legal constraint and security constraints that affect the accessibility of the abstract service chain. 2.2.2. Input and Output Input and output are both critical for the IRFSM, describing what it requires and what it can produce. (1) Input: The entire IRFSM is registered in a registration center in advance and is managed by the registration center through functional interfaces. Inputs for the discovery of the IRFSM are event information (event type and event stage). (2) Output: Basically, an output consists of an output name, output format (which is helpful for later use; commonly used formats are GeoTIFF, TIFF, and Shape), output value (this can be a literal value or a reference to a web-accessible resource, e.g., a GetFeature request or a Map request indicating a reference to an interoperable result published as a WFS or WMS service), and output generation time (this should be in a standard date and time format, such as ISO 8601 [e.g., 2004-04-18T12:03:04.6Z], which is an information interchange representation of dates and times) as well as the ID of the event, service, and service chain that produced the output. Using this information, the origins of the output (provenance information) can be readily identified. Because focusing service is, in essence, a personalized service, the output differs for different Societal Entities (government, enterprise and citizen users):
•
•
•
Government users: Government users, the administrators of a smart city, are concerned about rescue information and the reduction and evaluation of losses caused by public emergencies. Thus, the shortest paths to a public emergency site and the nearest available facilities that can be immediately used for rescue and alleviation should be output, as should casualties and economic losses. Enterprise users: Enterprise users may be more concerned with the losses caused, such as the degrees of damage to natural gas pipelines and power grids. This information can help companies to evaluate their losses and determine the compensation required from insurance companies or for other societal entities. Citizen users: Citizen users usually pay more attention to their own ranges of activity, i.e., where they can go and where they cannot, their escape routes, their ability to receive alerts when an emergency occurs, and information regarding the evolution of an emergency over time. Thus, for citizens, timely alerts and warnings should be provided, and detailed information about the evolution of emergencies should also be provided in a timely manner.
2.2.3. Formalization XML Schema is a language for defining the structure of XML document instances that belong to a specific document type. The UML of the IRFSM can be mapped to an XML Schema; thereafter, XML representations of the IRFSM can be established based on the constraints provided by the established XML Schema. Such XML representations are registered in the registration center, and the XML Schema can be used to validate these XML representations. 2.3. Focusing Service Process The process of focusing service is sophisticated and systematic, as is shown in Figure 4. Many entities with different roles are involved in the interactions that are necessary for focusing service,
ISPRS Int. J. Geo-Inf. 2017, 6, 251
8 of 22
typically including the registration center, public emergency events, information resources, focusing service software and societal entities. The registration center, which is the core of the focusing service, registers public emergency event information, the data resources of the smart city, the analysis and decision-making model services available in the smart city, the available abstract focusing service chains (the IRFSM), and the analysis and handling results for public emergencies. Considering different characteristics and other possible applications of these resources, the registration center also provides other operation interfaces, which generally include query and updating interfaces. Entities with the five roles listed above interact with each other directly or indirectly, with the registration center as the pivot, to form the overall process of the event-driven focusing service: (1) Registration of information resources. To make information resources more easily manageable and discoverable, these resources are first registered in the registration center, thereby laying a solid resource foundation for the event-driven focusing service. (2) Triggering by events. The entire process of the focusing service is triggered by the initiation or phase transformation of a public emergency. Once triggered, the focusing service software initiates the focusing service process. (3) Query and retrieval of abstract focusing service chain(s). The focusing service software queries and retrieves the abstract focusing service chain(s) that are related to the type and specified stage of the event through the query interfaces provided by the registration center. (4) Service instance binding and data linking. Because the abstract focusing service chain is not executable, it must be instantiated before it can be executed. This process involves binding every model in the service chain to a service instance that resides in a certain web server and linking data resources as inputs to these models. For data linking, an SOS can provide open spatio-temporal sensor observations through the GetObservation interface with the specified filters, e.g., eventTime, procedure, observedProperty, and featureOfInterest. A WFS can provide geographical features through the GetFeature interface, and a WMS can provide geo-registered map images through the Map interface with spatio-temporal filters [35] specified. (5) Execution of the focusing service chain instance and establishment of a description of the analysis results. The instantiated service chain is executed by a workflow engine, such as Apache ODE, to obtain the intermediate results (results of executing a sub-service chain) and final results (results of executing the entire service chain). The proposed method establishes a description that relates every result, including both intermediate and final results, to a public emergency, a service chain, and models in the service chain, thus facilitating the provenance of results. (6) Registration and sharing of analysis results. The focusing service software publishes the analysis results, making them accessible through the web. Meanwhile, a description of the analysis results (stored in the OutputParam element of OutputParamType, as depicted in Figure 3) is registered through an interface provided by the registration center, making these results discoverable and reusable by different societal entities. (7) Retrieval of analysis results. Societal entities retrieve the analysis results of public emergencies from the registration center through the discovery interfaces provided. (8) Decision-making. Societal entities make their own decisions in response to public emergencies based on the analysis results retrieved in step 7.
ISPRS Int. J. Geo-Inf. 2017, 6, 251
9 of 22
ISPRS Int. J. Geo-Inf. 2017, 6, 251
9 of 22
Figure 4. Event-driven focusing service process. Figure 4. Event-driven focusing service process.
The focusing service process described above can be utilized throughout the entire lifecycle of Theemergency focusing service process described above can be abstract utilized throughout the entire lifecycle of public response because the preregistered focusing service chains already public emergency response because the preregistered abstract focusing service chains already consider consider the various phases of emergencies. the various phases of emergencies. 3. System Implementation and Experiment 3. System Implementation and Experiment 3.1. System Implementation 3.1. System Implementation To test test the the proposed proposed method, method, aa focusing focusing service service prototype prototype system system is is developed developed based based on on the the To proposed focusing service model, its informational representation, and the focusing service process. proposed focusing service model, its informational representation, and the focusing service process. The architecture of the prototype system is illustrated in Figure 5, including four layers: a resource The architecture of the prototype system is illustrated in Figure 5, including four layers: a resource layer, a component layer, a business layer and a representation layer. In particular, the resource layer, a component layer, a business layer and a representation layer. In particular, the resource layer layer manages distributed information resources through the CSW (an implementation of the manages distributed information resources through the CSW (an implementation of the registration registration center) in a unified manner. The prototype system assists in decision-making for public center) in a unified manner. The prototype system assists in decision-making for public emergencies emergencies through the collaborative application of networked and distributed information resources. through the collaborative application of networked and distributed information resources.
ISPRS Int. J. Geo-Inf. 2017, 6, 251
10 of 22 10 of 22
Model abstract focusing service chain
Register abstract focusing service chain
Event-driven discovery of abstract focusing service chain
Instantiate abstract focusing service chain
Execute focusing service chain instances
Share analysis results
Sharing analysis results
Orchestrating services
Instantiating abstract focusing service chain Modeling abstract focusing service chain
Interaction with CSW
Business Layer
Interfaces for display of results
Component Layer
Interfaces for function manipulation
Representation Layer
ISPRS Int. J. Geo-Inf. 2017, 6, 251
Public emergency event info
Abstract focusing service chains
Analysis results
Analysis & decisionmaking model service
Geographical data interoperable service
Sensor Web service
Resource Layer
CSW
Figure 5. Architecture of focusing service prototype system. Figure 5. Architecture of focusing service prototype system.
The prototype system performs three main functions: (1) the modeling and registration of The performs threeismain functions: (1) the modeling and registration of abstract abstractprototype focusing system service chains, which realized by the component for modeling abstract focusing focusing chains, which is realized by the component for (2) modeling abstract focusing service service service chains and the component for interacting with the CSW; the discovery and instantiation chains and thefocusing component for interacting with CSW;by (2)the the component discovery and abstract of abstract service chains, which is the realized for instantiation instantiating of abstract focusing service chainswhich and the component for component interacting with the CSW; and (3) thefocusing execution of focusing service chains, is realized by the for instantiating abstract service focusing service chain instances and the sharing of analysis results, which is realized by the chains and the component for interacting with the CSW; and (3) the execution of focusing service chain component for sharing orchestrating services, the which component for sharing analysis results, and the instances and the of analysis results, is realized by the component for orchestrating component for interacting with theanalysis CSW. Communication the system modules with is achieved services, the component for sharing results, and theamong component for interacting the CSW. through three types of interfaces: (1) interfaces for interacting with the CSW, (2) interfaces for Communication among the system modules is achieved through three types of interfaces: (1) interfaces interacting with the workflow engine, and (3) interfaces for utilizing information resources. for interacting with the CSW, (2) interfaces for interacting with the workflow engine, and (3) interfaces
for utilizing information resources. 3.2. Gas Leakage Scenario 3.2. GasTypes Leakage of Scenario public emergency events that frequently occur in cities include gas leakages, pipe breakages, and utility outages etc.events Gas leakage is the mostoccur dangerous to the generalgas public for thatpipe it Types of public emergency that frequently in cities include leakages, may explode when exposed to flame or sparks if not handled correctly or in time. In addition to breakages, and utility outages etc. Gas leakage is the most dangerous to the general public for that causing fire and explosion hazards, leaking flammable gases can kill vegetation, including large it may explode when exposed to flame or sparks if not handled correctly or in time. In addition to trees, and release powerful greenhouse gases into the atmosphere [36]. To help alleviate this causing fire and explosion hazards, leaking flammable gases can kill vegetation, including large trees, problem, Google Earth Outreach and the Environmental Defense Foundation (EDF) are now and release powerful greenhouse gases into the atmosphere [36]. To help alleviate this problem, Google working together, utilizing Google Street View cars mounted with mobile methane sensors to find Earth andunder the Environmental Defense Foundation are now working together, utilizing andOutreach assess leaks streets and sidewalks and publishing(EDF) interactive thematic maps of leakage in Google Street View cars mounted with mobile methane sensors to find and assess leaks under streets certain US cities. and sidewalks and publishing interactive thematic maps of leakage in certain US cities.
ISPRS Int. J. Geo-Inf. 2017, 6, 251
11 of 22
Gas leakage is also a serious problem in China, particularly in cities with decades-old gas pipelines that may suffer from aging and erosion. Taiyuan, the capital of Shanxi Province, uses coal gas ISPRS Int. J. Geo-Inf. 2017, 6, 251 11 of 22 and natural gas as its two main energy sources and is therefore one such city. Currently, the total length of the city’s gas ispipelines is more than in 2700 kilometers, making effective management Gas leakage also a serious problem China, particularly in cities with decades-old gas of the pipelines that may suffer from aging and gas erosion. Taiyuan, capital of Shanxi uses coalbuilding pipelines and monitoring and addressing leaks vitallythe important. WithProvince, the smart city gas and natural gas as itsone twoof main sourcescities and isof therefore one suchof city. Currently, theUrban-Rural total boom, Taiyuan has become theenergy pilot smart the Ministry Housing and length of the city’s gas pipelines is more than 2700 kilometers, making effective management of the Development (MoHURD) of China. One major goal of the construction of smart Taiyuan is to achieve pipelines and monitoring and addressing gas leaks vitally important. With the smart city building real-time/near-real-time monitoring and effective management of gas pipelines by adopting Internet boom, Taiyuan has become one of the pilot smart cities of the Ministry of Housing and Urban-Rural of Things (IoT) technologies. Development (MoHURD) of China. One major goal of the construction of smart Taiyuan is to Onachieve 15 August 2014, a truck monitoring crashed into a pipeline, leadingofto gas leakage event at the real-time/near-real-time and effective management gasa pipelines by adopting Internet of Things (IoT) technologies. intersection of Xuefu Road and Changzhi Road. It was reported by nearby citizens through smart 15 August 2014, a truck crashed intowere a pipeline, leading to situ a gassensors leakage and eventtransmitted at the phones, andOnvarious parameters of the leakage gathered by in to intersection of Xuefu Road and Changzhi Road. It was reported by nearby citizens through smart the Smart City Intelligent Decision Making Center (SCIDMC) in Taiyuan in near real time. At the phones, and various parameters of the leakage were gathered by in situ sensors and transmitted to SCIDMC, cloud platform was deployed that ran (SCIDMC) a CSW instance to register and manage the a Smart City Intelligent Decision Making Center in Taiyuan in near real time. At the diverse information resources, multiple WPS instances to serve analysis and decision models, SCIDMC, a cloud platform was deployed that ran a CSW instance to register and manage diversemultiple instances of MongoSOS (an SOS implementation sensors live sensor observations that information resources, multiple WPS instancesfor to serving serve analysis andand decision models, multiple instances of implementation for servingenvironments), sensors and live sensor observations was developed byMongoSOS our team (an andSOS is suitable for distributed and multiple GeoServer thattowas developed by our teamdata. and is suitable for distributed environments), and multiple instances serve basic geographical Figure 6 depicts the scenario. GeoServer instances to serve basic geographical data. Figure 6 depicts the scenario.
Figure 6. The gas leakage scenario and platform deployment at the Smart City Intelligent Decision
Figure Making 6. The gas leakage scenario and platform deployment at the Smart City Intelligent Decision Center (SCIDMC). Making Center (SCIDMC). 3.2.1. Model Service severity of the consequences caused by a gas leakage depends on the amount and extent of 3.2.1. ModelThe Service expansion of the leakage. The amount of leakage further depends on the intensity of the leakage
The severity ofduration. the consequences byofa the gasamount leakage the of amount and extent source and its Analysis andcaused prediction anddepends expansionon extent the leakage of expansion of the leakage. The amount of leakage further depends on the intensity of the are of fundamental importance for severity evaluation and emergency response. Because the gas in leakage this scenario was natural gas, whose density is approximately 0.7174 kg/m³, equivalent to a fraction source and its duration. Analysis and prediction of the amount and expansion extent of the leakage of 0.5548 relative to that of air 0 °C andevaluation 101.325 kPa,and the Gaussian plume model isBecause suitable for are of fundamental importance foratseverity emergency response. the gas in 3 this scenario was natural gas, whose density is approximately 0.7174 kg/m , equivalent to a fraction of 0.5548 relative to that of air at 0 ◦ C and 101.325 kPa, the Gaussian plume model is suitable for calculating the expansion of the leakage. The Gaussian plume model has ten input parameters: pipeline
ISPRS Int. J. Geo-Inf. 2017, 6, 251 ISPRS Int. J. Geo-Inf. 2017, 6, 251
12 of 22 12 of 22
pressure, atmospheric pressure, environmental temperature, leak diameter, leak duration, pipeline height, wind direction, windofspeed, latitudeThe of the leak, and longitude theten leak. Theparameters: output of the calculating the expansion the leakage. Gaussian plume modelofhas input pipeline pressure, atmospheric pressure, temperature, leak diameter, leak duration, model is the mass concentration of gas atenvironmental every specified location. To allow the model to be used pipeline wind direction, speed, latitude the leak, and longitude the process leak. The online in anheight, interoperable manner,wind the Gaussian plume of model is encapsulated as aofWPS and outputthrough of the model is the mass concentration of gas at every specified location. To allow the model invoked the standard interfaces. to It beisused in an manner, the Gaussian plume model is encapsulated as a WPS to not online sufficient to interoperable simply calculate the expansion extent of gas leakage; it is also important process and invoked through the standard interfaces. know which buildings, facilities and populations are or will be affected by the gas leakage and its It is not sufficient simply calculate the expansion extent of gasthe leakage; it is also important to expansion. Thus, overlaytoanalysis is a necessity; in such an analysis, expansion of the gas leakage know which buildings, facilities and populations are or will be affected by the gas leakage and its is overlaid on basic geographical data, such as maps of buildings and populations. There are many expansion. Thus, overlay analysis is a necessity; in such an analysis, the expansion of the gas leakage open-source implementations of overlay analysis models, which can also be encapsulated as a WPS is overlaid on basic geographical data, such as maps of buildings and populations. There are many process and invoked through the web. open-source implementations of overlay analysis models, which can also be encapsulated as a WPS Knowledge of the shortest paths that relevant staff can take to reach the leakage site is also process and invoked through the web. critical for rescue and urgent repair, both of which are time-sensitive tasks. A shortest-path analysis Knowledge of the shortest paths that relevant staff can take to reach the leakage site is also model can facilitate the acquisition of this information. Similar to overlay analysis models, there are critical for rescue and urgent repair, both of which are time-sensitive tasks. A shortest-path analysis many open-source implementations of this suchinformation. models available variety analysis of programming languages, model can facilitate the acquisition of Similarintoa overlay models, there are which can also be encapsulated as a WPS process and invoked through the web. many open-source implementations of such models available in a variety of programming languages, which can also be encapsulated as a WPS process and invoked through the web. 3.2.2. Sensors and Data 3.2.2. Data 3.2.1, the Gaussian plume model requires ten input parameters. Among these As Sensors stated inand Section parameters, the pipeline be measured a pressure mounted on theAmong pipeline; As stated in Sectionpressure 3.2.1, thecan Gaussian plume by model requiressensor ten input parameters. thethese atmospheric pressure, environmental temperature, and leak position (latitude, longitude) parameters, the pipeline pressure can be measured by a pressure sensor mounted on thecan bepipeline; measuredthe by atmospheric sensors embedded in smart phones, supposing thatand a personal mobile sensor web pressure, environmental temperature, leak position (latitude, (PMSW) app can (Figure 7) is installed on eachembedded to publishin sensor to MongoSOS in a timely longitude) be measured by sensors smartobservations phones, supposing that a personal fashion; windweb speed and wind direction be obtained by looking up the MongoSOS to obtain mobilethe sensor (PMSW) app (Figure 7)can is installed on each to publish sensor observations to MongoSOS in a timely fashion; the wind speed and wind direction can be obtained by looking up observations from the wind sensors placed by the Weather Bureau that are located nearest to the leak; MongoSOS to leak obtain observations from theprior windknowledge sensors placed by pipeline; the Weather that of arethe thethe diameter of the can be estimated from of the andBureau the height locatedcan nearest to the leak; diameter ofrecords. the leak can be estimated from prior knowledge of the pipeline be obtained fromthe construction pipeline; and the height of the pipeline can be obtained from construction records.
Figure 7. A screenshot of the personal mobile sensor web app. Figure 7. A screenshot of the personal mobile sensor web app.
ISPRS Int. J. Geo-Inf. 2017, 6, 251 ISPRS Int. J. Geo-Inf. 2017, 6, 251
13 of 22 13 of 22
Basic geographical geographical data, data, including including base base map map data, data, administrative administrative division division data, data, road road net net data, data, Basic gazetteer data, data, building building data, data, and and population population and and juridical juridical person person information information data, data, are are necessary necessary gazetteer for evaluating and predicting the impact on and harm to nearby human activities caused by the the for evaluating and predicting the impact on and harm to nearby human activities caused by leakage and expansion of the gas through overlay analysis and for determining the shortest paths to leakage and expansion of the gas through overlay analysis and for determining the shortest paths thethe emergency site GeoServer, to emergency sitethrough throughshortest-path shortest-pathanalysis. analysis.These Thesedata datacan canbe be retrieved retrieved from from GeoServer, which provides a standard and interoperable WFS and WMS service for basic geographical features which provides a standard and interoperable WFS and WMS service for basic geographical features and map images. and map images. 3.3. Experimental Experimental Process Process and and Results Results 3.3. Figure8 8illustrates illustrates process forleakage gas leakage emergency in A Taiyuan. A public Figure thethe process for gas emergency responseresponse in Taiyuan. public emergency emergency evolves in the fourmonitoring phases: the monitoring phase, the warning phase, the and response phase, evolves in four phases: phase, the warning phase, the response phase, the recovery and the recovery and evaluation phase. Government departments, enterprises, and citizens focus and evaluation phase. Government departments, enterprises, and citizens focus on different tasks on in different phases, tasks in different phases, andprovides the focusing service provides different outcomes and different and the focusing service different outcomes and decision-making support decision-making support for each of them during these phases. for each of them during these phases. Government •
Ⅰ Monitoring Phase
• •
Monitor large-scale construction work. Receive alarm information from the public. Utilize municipal digital monitoring center, urban data acquisition and monitoring system to detect malfunction of gas.
Verify the alarm of gas leakage
Ⅱ Warning Phase
Public Emgerncy (Gas leakage) Evolves Ⅲ Reponse Phase
Citizen
Gas supply enterprise: Monitor change of consumption, quality and pressure of gas, and malfunction of gas supply equipment
Report gas leakage
Gas supply enterprises: Check in-site condition, carry out professional disposal and report to government Report in-site condition
Receive report; evaluate severity and affected area of gas leakage emergency; determine the warning level; issue, adjust and cancel warning
Receive warning and take precautions
Receive warning and take precautions (adjust activities etc.)
Issue/Adjust/Cancel warning Emergency rescue: Polices, firefighters, medical staffs inform arrive at the scene, cordon off the scene, rescue trapped people.
Gas supply enterprises: Close the upstream and downstream valves; Participate in urgent repair. Escape to safe places
Upgrade emergency response level if the situation is prone to escalation. •
Ⅳ Recovery & Evaluation Phase
Enterprise
• • •
•
Gas leakage emergency has been controlled effectively. Repair is performed in order. Secondary and derivative disasters have been eliminated. Declare the end of emergency reponse.
Evacuate staffs to safe places
Gas supply enterprises: Participate in urgent repair. Evaluate losses caused. Evaluate losses caused.
Evaluate losses caused.
Figure Figure 8. 8. Gas Gas leakage leakage emergency emergency response response process. process.
3.3.1. Monitoring Monitoring Phase Phase 3.3.1. In the the monitoring monitoring phase, phase, gas gas pipelines pipelines are monitored monitored by various various sensors, such as gas detectors, In smoke alarms, alarms, fire fire detectors, detectors, and and video video sensors. sensors. Citizens Citizens and and inspectors inspectors can can also also report report malfunctions malfunctions smoke of gas gas pipelines pipelines or or gas gas leakages leakages to to government government departments. departments. Once Once an an abnormality abnormality is is monitored monitored or or of reported, the monitoring phase evolves into the warning phase, and the focusing service is triggered and begins operation.
ISPRS Int. J. Geo-Inf. 2017, 6, 251
14 of 22
reported, monitoring ISPRS Int. J.the Geo-Inf. 2017, 6, 251phase evolves into the warning phase, and the focusing service is triggered 14 of 22 and begins operation. 3.3.2. Warning Phase 3.3.2. Warning Phase As stated in Figure 8, the most important task for government departments is to determine the As stated Figure 8, the most important task and for government departments is to determine severity of andinthe area affected by the gas leakage expansion; based on this information, the the severity of and the area affected by the gas leakage and expansion; based on this information, government issues a suitable level of warning. As discussed in Section 3.2.1, the Gaussian plume the government issuesanalysis a suitable level can of warning. discussed in Sectionthis 3.2.1, the Gaussian model and overlay model be usedAs together to perform task. In step 0 plume of the model and overlay analysis model can be used together to perform this task. In step 0 of the proposed proposed focusing service process, an abstract focusing service chain containing these two models focusing service process, abstract focusing service chain thesein two foradvance. the warning for the warning phase ofanthe gas leakage emergency has containing been registered themodels CSW in The phase of the gas leakage emergency has been registered in the CSW in advance. The abnormality abnormality monitored or reported in the monitoring phase triggers the focusing service prototype monitored or reported in the monitoring theinstantiate focusing service prototype system to system to retrieve this registered abstract phase servicetriggers chain and it by binding model service retrieve this registered abstract and instantiate by binding model service instances (WPS processes) and service linkingchain data (real-time sensorit data from MongoSOS andinstances archived (WPS processes) and linking data (real-time sensor data from MongoSOS and archived WFS/WMS WFS/WMS data service from GeoServer). Figure 9 shows a service chain instance for evaluating the data service fromleakage GeoServer). Figure 9 shows service chain instance forresults evaluating the impact of impact of gas and expansion. Thea intermediate and final are contained in gas the leakage andinformational expansion. The intermediate and final results are contained the proposed proposed representation of the focusing service modelinand registeredinformational in the CSW. representation of the focusing service model and registered in the CSW. These can beplatforms, obtained These results can be obtained from the CSW through the web and displayedresults on various from the CSW through the web and displayed on various platforms, including 3D 10. desktop including 3D desktop platforms and 2D mobile platforms, as shown in Figure Basedplatforms on these and 2D mobile platforms, as shown in Figure 10. Based on these results, the warning level, time, results, the warning level, time, message type, message content, area, and extent of the alert are message type, message content, area, and extent of the alert are determined by the government determined by the government and issued to enterprises and citizens to inform them to takeand the issued to enterprises and citizens to inform them to take the appropriate precautions. appropriate precautions.
Figure 9. 9. A A service service chain chain instance instance for for evaluating evaluating the the impact impactof ofgas gasleakage leakageand andexpansion. expansion. Figure
ISPRS Int. J. Geo-Inf. 2017, 6, 251
15 of 22
ISPRS Int. J. Geo-Inf. 2017, 6, 251
15 of 22
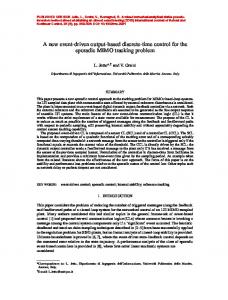
Figure 10. Gas expansion area shown on: (a) an Android 2D platform; (b) the Gaea 3D GIS platform. Figure 10. Gas expansion area shown on: (a) an Android 2D platform; (b) the Gaea 3D GIS platform.
3.3.3. Response Phase 3.3.3. Response Phase Emergency rescue and urgent repair are the two main tasks in this phase. Thus, the police Emergency rescue and urgent repair are the two main tasks in this phase. Thus, the police stations, stations, fire stations, hospitals, and other public facilities nearest to the scene of the gas leakage fire stations, hospitals, and other public facilities nearest to the scene of the gas leakage emergency and emergency and the shortest paths for them to reach the scene should be determined. As explained in the shortest paths for them to reach the scene should be determined. As explained in Section 3.2.1, Section 3.2.1, the overlay analysis model and shortest-path analysis model can be utilized together to the overlay analysis model and shortest-path analysis model can be utilized together to perform this perform this task. In step 0 of the proposed focusing service process, an abstract focusing service task. In step 0 of the proposed focusing service process, an abstract focusing service chain containing chain containing these two models for the response phase of the gas leakage emergency has been these two models for the response phase of the gas leakage emergency has been registered in the CSW registered in the CSW in advance. The evolution from the warning phase to the response phase in advance. The evolution from the warning phase to the response phase triggers the focusing service triggers the focusing service prototype system to retrieve this registered abstract service chain and prototype system to retrieve this registered abstract service chain and instantiate it through binding instantiate it through binding model service instances (WPS processes) and linking data (archived model service instances (WPS processes) and linking data (archived WFS/WMS data service). Figure 11 WFS/WMS data service). Figure 11 illustrates a service chain instance for finding the shortest paths illustrates a service chain instance for finding the shortest paths along which relevant staff can reach along which relevant staff can reach the emergency scene in the shortest amount of time. The results the emergency scene in the shortest amount of time. The results are contained in the proposed IRFSM are contained in the proposed IRFSM and registered in CSW. These results can be obtained from the and registered in CSW. These results can be obtained from the CSW through the web and displayed CSW through the web and displayed on various platforms, including 3D desktop platforms and 2D on various platforms, including 3D desktop platforms and 2D mobile platforms. Figure 12 shows mobile platforms. Figure 12 shows the shortest paths (red and blue solid lines) displayed on Gaea (a the shortest paths (red and blue solid lines) displayed on Gaea (a 3D GIS platform). Based on these 3D GIS platform). Based on these results, rescue staff and urgent repair staff (from both government results, rescue staff and urgent repair staff (from both government departments and gas enterprises) departments and gas enterprises) can perform their duties (as shown in Figure 13) in the shortest can perform their duties (as shown in Figure 13) in the shortest possible time and thus reduce losses to possible time and thus reduce losses to the greatest possible extent. Similarly, the shortest paths for the greatest possible extent. Similarly, the shortest paths for rapid evacuation from the dangerous gas rapid evacuation from the dangerous gas leakage area are also determined and provided to leakage area are also determined and provided to enterprises and citizens, thus ensuring the safety of enterprises and citizens, thus ensuring the safety of their lives and property. their lives and property.
ISPRS Int. J. Geo-Inf. 2017, 6, 251
16 of 22
ISPRS Int. J. Geo-Inf. 2017, 6, 251
16 of 22
ISPRS Int. J. Geo-Inf. 2017, 6, 251
Figure 11. A service chain instance for determining the shortest paths to the emergency site. Figure Figure11. 11.AAservice servicechain chaininstance instancefor fordetermining determiningthe theshortest shortestpaths pathstotothe theemergency emergencysite. site.
Figure 12. Gaea displaying the shortest rescue paths (red and blue solid lines) in a 3D scenario. Figure 12. Gaea displaying the shortest rescue paths (red and blue solid lines) in a 3D scenario. Figure 12. Gaea displaying the shortest rescue paths (red and blue solid lines) in a 3D scenario.
16 of 22
ISPRS Int. J. Geo-Inf. 2017, 6, 251
17 of 22
ISPRS Int. J. Geo-Inf. 2017, 6, 251
17 of 22
Figure 13. 13. Gaea the dynamic dynamic rescue rescue process process in in aa 3D 3D scenario. scenario. Figure Gaea displaying displaying the
Once a gas leakage emergency has been effectively controlled, the repair work is in order, and Once a gas leakage emergency has been effectively controlled, the repair work is in order, and any any secondary and derivative disasters have been eliminated, the response phase ends and evolves secondary and derivative disasters have been eliminated, the response phase ends and evolves into into the next phase, the recovery and evaluation phase. the next phase, the recovery and evaluation phase. 3.3.4. Recovery and Evaluation Evaluation Phase Phase 3.3.4. Recovery and In this this phase, phase, the the gas gas leakage leakage emergency emergency is is under under effective effective control, control, those those wounded wounded are are being being In treated, and any damaged facilities are under urgent repair. The main task to be executed in this treated, and any damaged facilities are under urgent repair. The main task to be executed in this phase phase is to recover from and evaluate the losses caused by the gas emergency. is to recover from and evaluate the losses caused by the gas emergency. This objective objectivecan canbebe achieved through the orchestration the Gaussian model and This achieved through the orchestration of theofGaussian plume plume model and overlay overlay analysis model. Although this combination of models is the same as that used in the analysis model. Although this combination of models is the same as that used in the warning phase, warning phase, a separate abstract focusing service chain containing these two models for gas a separate abstract focusing service chain containing these two models for gas leakage emergencies, leakage emergencies, butevaluation for the recovery evaluation phase One thereof, is registered. One but for the recovery and phase and thereof, is registered. difference between thedifference focusing between the focusing service process applied in this phase and that executed in the warning phase is service process applied in this phase and that executed in the warning phase is the geographical data the geographical data used. In the warning phase, base map data, road network data, building data used. In the warning phase, base map data, road network data, building data and population data are and population usedanalysis as inputsmodel to theto overlay modelextent to predict possible extent of used as inputs todata the are overlay predictanalysis the possible of thethe area affected by the the area affected by the gas leakage, based on which the warning information is determined. gas leakage, based on which the warning information is determined. However, in the recovery and However, in the recovery and evaluation phase, the primary task is to evaluate the losses that have already been incurred because of the gas emergency; therefore, economic data are used in addition to the data used in the warning phase.
ISPRS Int. J. Geo-Inf. 2017, 6, 251
18 of 22
evaluation phase, the primary task is to evaluate the losses that have already been incurred because of the gas emergency; phase. ISPRS Int. J. Geo-Inf.therefore, 2017, 6, 251 economic data are used in addition to the data used in the warning 18 of 22 The main results of the focusing service for this phase are loss reports, including casualties, facility resultslosses, of the as focusing for this loss reports, including damage, The and main economic shownservice in Figure 14. phase Theseare reports are output and casualties, distributed to facility damage, and economic losses, as shown in Figure 14. These reports are output and government departments in the form of documents (Evidence Placeholders in the proposed focusing distributed to government departments in the form of documents (Evidence Placeholders in the service model) or published to the public as news items. proposed focusing service model) or published to the public as news items.
Figure 14. Gaea displaying a loss report generated by the focusing service during the recovery and
Figure 14. Gaeaphase. displaying a loss report generated by the focusing service during the recovery and evaluation evaluation phase. 4. Discussion
4. Discussion The experiments carried out in four different phases of a real-world scenario—a gas leakage emergency that occurred in 2014 China—demonstrate that the proposed focusinggas service The experiments carried out in inTaiyuan, four different phases of a real-world scenario—a leakage method is feasible for application in assisting with emergency response in smart cities and also offers emergency that occurred in 2014 in Taiyuan, China—demonstrate that the proposed focusing service certain unique features and advantages over the existing methods, as is discussed below in detail. method is feasible for application in assisting with emergency response in smart cities and also offers certain features and advantages over the existing methods, as is discussed below in detail. 4.1.unique Feasibility of the Proposed Focusing Service Method Basedofon of theService overwhelming 4.1. Feasibility theconsiderations Proposed Focusing Method amount of available information resources and
the types of public emergencies that most frequently occur, the proposed method adopts an
Based on considerations the overwhelming amountprocess. of available information resources and the event-driven mechanism toofactuate the focusing service It prefabricates processing flows types(abstract of public emergencies most frequently theand proposed an event-driven focusing service that chains) related to bothoccur, the types phases method of public adopts emergencies, based on practical historical When process. a public It emergency occurs, suitable processing flows focusing can mechanism to actuate the experience. focusing service prefabricates processing flows (abstract thus be made available in a relatively short period of time, using the event type and event phase as service chains) related to both the types and phases of public emergencies, based on practical historical query filters. These processing flows can be instantiated to be executable by binding the appropriate experience. When a public emergency occurs, suitable processing flows can thus be made available in service instances and linking data with the assistance of the registration center (e.g., the CSW in the a relatively short period of time, using the event type and event phase as query filters. These processing experimental scenario) and can thus produce personalized outputs for various societal entities, e.g., flows can be instantiated to be executable by binding the appropriate service instances and linking data government users, enterprise users and citizens, in accordance with their knowledge requirements with in theresponse assistance ofemergency. the registration (e.g., the CSW in the scenario) and can to an Takingcenter the warning phase of the gasexperimental leakage emergency considered in thus produce personalized outputs for various societal entities, e.g., government users, enterprise users and
ISPRS Int. J. Geo-Inf. 2017, 6, 251
19 of 22
citizens, in accordance with their knowledge requirements in response to an emergency. Taking the warning phase of the gas leakage emergency considered in the experiment as an example, the process flow orchestrating the Gaussian plume model and overlay analysis model predicts the expansion area of the gas and provides this information to government departments to allow them to determine a suitable warning level. Further warning information is issued and pushed to enterprise and citizen users so that they can take necessary precautions in a timely manner. Therefore, the proposed focusing service method can feasibly provide personalized service support throughout the entire lifecycle of public emergencies to various users to facilitate their effective and efficient response to public emergencies. However, an important premise of the feasibility of the proposed method is that the communication infrastructure is not damaged in the emergency cases, namely the sensing devices can still function well and sensing data can be transmitted back normally. 4.2. Advantages of the Proposed Focusing Service Method 4.2.1. Efficient Urban Event-Driven Emergency Response in Smart Cities The event-driven mechanism is vitally important for efficient emergency response in smart cities. However, studies to date have focused primarily on micro events [31], such as sensor observation events, which are difficult to adapt to macro urban public emergency scenarios. By contrast, the method proposed in this paper is oriented toward macro urban public emergencies. IRFSMs specific to the various types and stages of public emergencies are registered in and managed by the registration center and are retrieved through interoperable web service interfaces by the focusing service software when an urban emergency event occurs or when such an event evolves to another phase. Thus, it can apply to the whole life-cycle of an event which, however, is not supported by some of the state-of-the-art methods [25,31]. This urban event-driven mechanism for focusing service implementation contributes to providing greater suitability and efficiency in response to macro urban emergencies. Table 1 details the comparison between the proposed method with some state-of-the-art methods. Table 1. Comparison of the proposed method with others. Method
Event Type
Suitable for the Life-Cycle of Events
Efficiency
Yes
Macro
Yes
High
High
High
Yes Yes Yes No No
Macro Micro Micro -1 -
No No No -
Medium Medium Medium Medium Not known
Medium High High Medium Medium
Medium Medium Medium Medium Medium
Event-Driven
The proposed method Zhu et al. [25] Yu et al. [30] Fan et al. [31] Yang et al. [23] Huang et al. [24] 1
Real-Time Dynamic
“-“ means that the comparison item does not apply to a method in that row.
4.2.2. Cyber-Physical Infrastructures for Near-Real-Time Location-Based Sensing and Handling of Emergencies In the proposed method, cyber-physical infrastructures (as shown in Figure 1) are utilized rather than cyber infrastructures alone, as in the traditional methods: (1) Sensing Infrastructures: various sensors (static in situ sensors and dynamic mobile sensors embedded in smart phones) to acquire comprehensive data regarding the emergency conditions, including geo-location information, which is particularly important for emergency response; (2) Communication Infrastructures: communication fabrics (e.g., wireless/wired communication; 3G/4G/Wi-Fi/WSN; email/SMS) to transmit emergency states (measurements of the surrounding context) and emergency response messages (e.g., issuance/cancellation of warnings and warning level adjustments); and (3) Cloud Computing Infrastructures: storage and computation facilities (e.g., the cloud platform deploying the MongoSOS, WPS, and GeoServer instances at the SCIDMC in the experimental scenario)
ISPRS Int. J. Geo-Inf. 2017, 6, 251
20 of 22
for the analysis of, decision-making in, and efficient handling of emergency scenarios utilizing service chains comprising analysis and decision-making models with near-real-time and archived data services as inputs. These cyber-physical infrastructures form extensive networks of sensingtransmission-computation links to realize the near-real-time location-based sensing of emergencies, thereby contributing to the efficient handling of emergencies and reducing losses to the greatest possible extent. 4.2.3. Mobile Crowd Sensing for Dynamic Comprehensive Monitoring of Emergencies in Smart Cities Traditional sensing techniques such as wireless sensor networks (WSNs), in which distributed sensors are leveraged to acquire real-time measures of emergency conditions, rely on static sensing, which suffers from several disadvantages, such as insufficient node coverage, high installation/maintenance costs, and lack of scalability. As a consequence, these traditional sensing techniques have been established only in specific areas and are generally not adopted on the large scale; the necessary support may be lacking throughout most of or even an entire city, thus reducing the utility and practicability in effective monitoring of emergencies, which occur randomly in time and space. To overcome these limitations, in addition to traditional sensing techniques (e.g., wind speed/direction sensors and atmospheric sensors), the proposed method leverages the increasingly popular mobile crowd sensing technique [11], which represents a new sensing paradigm based on the power of various mobile devices/objects, such as the smart phones considered in the experiment using the PMSW app (Figure 7) for the near-real-time publishing and sharing of measurements by a large pool of mobile sensors and sensor-equipped vehicles. The huge number of users with sensor-enhanced mobile devices and their inherent mobility and geographical distribution enables more comprehensive sensing of city dynamics, ensuring that occurrences of public emergencies are identified and reported in the shortest possible time and in reasonable detail (e.g., when and where it occurred and parameters of the surrounding context), thereby aiding in timely sensing, decision-making and handling of public emergencies and contributes to safer and smarter cities. 4.3. Limitations of the Proposed Focusing Service Method Despite the advantages of the proposed method discussed above, it still suffers certain drawbacks and limitations: (1) Static event-driven mechanism: In the proposed method, abstract focusing service chains for different types and phases of public emergencies must be established in advance. Thus, it is a static event-driven process that involves human labor. (2) Semi-automatic focusing service process: The proposed method is not a fully automatic but rather a semi-automatic focusing service process. The procedure for the retrieval and instantiation of abstract processing flows involves human interaction with the focusing service software, which requires that the users involved possess certain prior knowledge concerning public emergencies, the abstract processing flows, and manipulation of the software, thereby reducing the usability of the system for non-expert users. 5. Conclusions and Outlook This paper proposes an event-driven focusing service method to focus the overwhelming amounts of available distributed information resources to efficiently respond to the types of public emergencies that occur most frequently in smart cities. The method consists of a focusing service model, an informational representation of the model, and a focusing service process. Mobile crowd sensing and cyber-physical infrastructures are utilized to comprehensively monitor and sense emergencies, to perform near-real-time analysis of emergencies and to help respond to emergencies in the shortest possible time. The proposed method can focus a rich variety of information resources on public emergencies and provide personalized service to three different types of societal entities—government users, enterprise users, and citizen users—to assist them in their efficient
ISPRS Int. J. Geo-Inf. 2017, 6, 251
21 of 22
responses and decision-making with respect to public emergencies, ultimately contributing to the establishment of safer and smarter cities. However, the proposed focusing service method still needs human interaction. To further improve the efficiency and utility of the proposed method, the development of a dynamic event-driven fully automatic focusing service process will be addressed in our future work. Besides, how to assist decision-making and emergency response in extraordinary serious disasters during which communication infrastructures may be heavily damaged should be further investigated. Acknowledgments: This work was supported by grants from Project of Innovative Groups of the Hubei Provincial Natural Science Foundation of China (No. 2016CFA003), Joint Funds of the Ministry of Education of China (No. 6141A02022318), National Basic Research Program of China (973 Program) (No. 2011CB707101), the National High Technology Research and Development Program of China (863 Program) (No. 2013AA01A608). Author Contributions: Nengcheng Chen, Changjiang Xiao, Wei Wang and Jianya Gong conceived and designed the main idea and experiments; Changjiang Xiao, Chuanbo Hu and Zeqiang Chen performed the experiments; Changjiang Xiao wrote the paper. All authors read and approved the final manuscript. Conflicts of Interest: The authors declare no conflict of interest.
References 1. 2.
3. 4. 5. 6.
7. 8. 9. 10.
11.
12. 13. 14.
15.
Kramers, A.; Höjer, M.; Lövehagen, N.; Wangel, J. Smart sustainable cities—Exploring ICT solutions for reduced energy use in cities. Environ. Model. Softw. 2014, 56, 52–62. [CrossRef] Leccese, F.; Cagnetti, M.; Trinca, D. A smart city application: A fully controlled street lighting isle based on Raspberry-Pi card, a ZigBee sensor network and WiMAX. Sensors 2014, 14, 24408–24424. [CrossRef] [PubMed] Su, K.; Li, J.; Fu, H. Smart city and the applications. In Proceedings of the 2011 International Conference on Electronics, Communications and Control(ICECC), Ningbo, China, 9–11 September 2011; pp. 1028–1031. Bencardino, M.; Greco, I. Smart communities. Social innovation at the service of the smart cities. TeMA J. Land Use Mobil. Environ. 2014. [CrossRef] Breuer, J.; Walravens, N.; Ballon, P. Beyond defining the smart city. Meeting top-down and bottom-up approaches in the middle. TeMA J. Land Use Mobil. Environ. 2014. [CrossRef] Chourabi, H.; Nam, T.; Walker, S.; Gil-Garcia, J.R.; Mellouli, S.; Nahon, K.; Pardo, T.A.; Scholl, H.J. Understanding smart cities: An integrative framework. In Proceedings of the 2012 45th Hawaii International Conference on System Science (HICSS), Maui, HI, USA, 4–7 January 2012; pp. 2289–2297. Fistola, R.; La Rocca, R. Smart city planning: A systemic approach. In Proceedings of the 6th Knowledge Cities World Summit, Istanbul, Turkey, 9–13 September 2013; Lookus Scientific: Istanbul, Turkey, 2013; pp. 520–530. Chen, N.; Xiao, C.; Pu, F.; Wang, X.; Wang, C.; Wang, Z.; Gong, J. Cyber-physical geographical information service-enabled control of diverse in situ sensors. Sensors 2015, 15, 2565–2592. [CrossRef] [PubMed] Lin, T.; Wang, S.; Rodríguez, L.F.; Hu, H.; Liu, Y. CyberGIS-enabled decision support platform for biomass supply chain optimization. Environ. Model. Softw. 2015, 70, 138–148. [CrossRef] Rajkumar, R.; Lee, I.L.I.; Sha, L.S.L.; Stankovic, J. Cyber-physical systems: The next computing revolution. In Proceedings of the 47th ACM/IEEE Design Automation Conference (DAC), Anaheim, CA, USA, 13–18 June 2010; pp. 731–736. Wan, Z.; Hong, Y.; Khan, S.; Gourley, J.; Flamig, Z.; Kirschbaum, D.; Tang, G. A cloud-based global flood disaster community cyber-infrastructure: Development and demonstration. Environ. Model. Softw. 2014, 58, 86–94. [CrossRef] Shakshuki, E.M.; Malik, H.; Sheltami, T. WSN in cyber physical systems: Enhanced energy management routing approach using software agents. Future Gener. Comput. Syst. 2014, 31, 93–104. [CrossRef] Xiao, C.; Chen, N.; Li, D.; Lv, Y.; Gong, J. SCRMS: An RFID and sensor web-enabled smart cultural relics management system. Sensors 2017, 17, 60. [CrossRef] [PubMed] Xiao, C.; Chen, N.; Wang, X.; Chen, Z. A semantic registry method using sensor metadata ontology to manage heterogeneous sensor information in the geospatial sensor web. ISPRS Int. J. Geo-Inf. 2016, 5, 63. [CrossRef] Granell, C.; Fernández, Ó.B.; Díaz, L. Geospatial information infrastructures to address spatial needs in health: Collaboration, challenges and opportunities. Future Gener. Comput. Syst. 2014, 31, 213–222. [CrossRef]
ISPRS Int. J. Geo-Inf. 2017, 6, 251
16. 17. 18. 19. 20. 21. 22. 23. 24. 25. 26.
27. 28. 29. 30. 31. 32. 33.
34. 35. 36.
22 of 22
Chen, N.; He, J.; Wang, W.; Chen, Z. Extended frag-base schema-matching method for multi-version OpenGIS web services retrieval. Int. J. Geogr. Inf. Sci. 2011, 25, 1045–1068. [CrossRef] Li, W.; Yang, C.; Yang, C. An active crawler for discovering geospatial web services and their distribution pattern—A case study of OGC Web Map Service. J. Geogr. Inf. Sci. 2010, 24, 1127–1147. [CrossRef] Bröring, A.; Stasch, C.; Echterhoff, J. OGC® Sensor Observation Service Interface Standard. OGC 12-006; Open Geospatial Consortium, Inc.: Wayland, MA, USA, 2012. Dubois, G.; Schulz, M.; Skøien, J.; Bastin, L.; Peedell, S. eHabitat, a multi-purpose Web Processing Service for ecological modeling. Environ. Model. Softw. 2013, 41, 123–133. [CrossRef] Bröring, A.; Echterhoff, J.; Jirka, S.; Simonis, I.; Everding, T.; Stasch, C.; Liang, S.; Lemmens, R. New generation sensor web enablement. Sensors 2011, 11, 2652–2699. [CrossRef] [PubMed] Simonis, I.; Echterhoff, J. OGC best practices 06-095r1: OpenGIS Web Notification Service Implementation Specification. Open Geospatial Consortium, Inc.: Wayland, MA, USA, 2007. Xu, J.; Nyerges, T.L.; Nie, G.Z. Modeling and representation for earthquake emergency response knowledge: Perspective for working with geo-ontology. Int. J. Geogr. Inf. Sci. 2014, 28, 185–205. [CrossRef] Yang, Q.; Sui, F.; Deng, S.; Liu, Q.; Zhou, Y. A method of information resource focusing service based on subject analysis. Sci. Technol. Eng. 2010, 10, 4813–4822. Huang, H.; Xiong, F.; Deng, S.; Zhang, W. Semantic relatedness-based information focusing service model and approach. Comput. Sci. 2011, 38, 185–188. Zhu, Q.; Li, H.; Yang, X. Hierachical semantic constraint model for focused remote sensing information services. Geomat. Inf. Sci. Wuhan Univ. 2009, 34, 1454–1457. Yue, P.; Gong, J.; Di, L.; He, L.; Wei, Y. Integrating semantic web technologies and geospatial catalog services for geospatial information discovery and processing in cyberinfrastructure. Geoinformatica 2011, 15, 273–303. [CrossRef] Yang, C.; Chen, N.; Di, L. RESTful based heterogeneous geoprocessing workflow interoperation for sensor web service. Comput. Geosci. 2012, 47, 102–110. [CrossRef] Chen, N.; Hu, C.; Chen, Y.; Wang, C.; Gong, J. Using SensorML to construct a geoprocessing e-science workflow model under a sensor web environment. Comput. Geosci. 2012, 47, 119–129. [CrossRef] Gutierrez-Garcia, J.O.; Sim, K.M. Agent-based cloud workflow execution. Integr. Comput. Aided Eng. 2012, 19, 39–56. Yu, G.; Di, L.; Zhang, B.; Wang, H. Coordination through geospatial web service workflow in the sensor web environment. IEEE J. Sel. Top. Appl. Earth Obs. Remote Sens. 2010, 3, 433–441. Fan, M.; Fan, H.; Chen, N.; Chen, Z.; Du, W. Active on-demand service method based on event-driven architecture for geospatial data retrieval. Comput. Geosci. 2013, 56, 1–11. [CrossRef] Castronova, A.M.; Goodall, J.L.; Elag, M.M. Models as web services using the Open Geospatial Consortium (OGC) Web Processing Service (WPS) standard. Environ. Model. Softw. 2013, 41, 72–83. [CrossRef] Papathanasiou, M.K.; Loutas, N.; Peristeras, V.; Tarampanis, K. Combining service models, semantic and Web 2.0 technologies to create a rich citizen experience. In Lecture Notes in Computer Science; Lytras, M.D., Damiani, E., Carroll, J.M., Tennyson, R.D., Avison, D., Naeve, A., Dale, A., Lefrere, P., Tan, F., Sipior, J., Vossen, G., Eds.; Springer: Berlin/Heidelberg, Germany, 2009; Volume 5736, pp. 296–305. Peristeras, V.; Goudos, S.K.; Loutas, N.; Tarabanis, K. An ontological representation of public services: Models, technologies and use cases. J. Web Eng. 2009, 8, 245–267. Huang, B.; Yi, S.; Chan, W. Spatio-temporal information integration in XML. Future Gener. Comput. Syst. 2004, 20, 1157–1170. [CrossRef] Wigley, T.M. Coal to gas: The influence of methane leakage. Clim. Chang. 2011, 108, 601–608. [CrossRef] © 2017 by the authors. Licensee MDPI, Basel, Switzerland. This article is an open access article distributed under the terms and conditions of the Creative Commons Attribution (CC BY) license (http://creativecommons.org/licenses/by/4.0/).