Evolutionary Algorithms in Data Mining: Multi-Objective Performance Modeling for Direct Marketing Siddhartha Bhattacharyya Information and Decision Sciences, College of Business Administration, University of Illinois at Chicago 601 S. Morgan Street (MC 294) Chicago, IL 60607 (312) 996-8794
[email protected] to promotional solicitations or other intervention programs. Typically, individuals in a database are scored in accordance to a statistical model defined over various attributes characterizing the customers (predictor variables), with higher scores indicating greater targeting preference. Models are built using statistical techniques [10] like discriminant analysis, least-squares regression, logistic regression, or in recent years, neural networks. Based on given modeling objective, a variety of criteria may be used to identify targeted individuals, and define the dependent variables being modeled. Response models may be built from data identifying individuals as responders and non-responders -the widely studied two-group discrimination problem -- with model scores pertaining to individuals’ response likelihood. Alternate objectives may seek individuals with the highest response frequency in previous mailings, or those that have generated most revenue in earlier purchases. Here the dependent variable becomes continuous, and least-squares regression models are applicable. Model implementation decisions are then undertaken considering various performance and budgetary considerations. While standard modeling approaches embody single performance objectives, real-world decision problems often seek multiple performance measures [23]. Decision-makers here desire solutions that simultaneously optimize on multiple objectives. For example, marketers may look for individuals that are not only likely to respond to a mailing solicitation, but also generate high purchase revenues; or, a cellular carrier may seek to identify customers most likely to churn and who also have high usage of services, in order to minimize potential losses likely from these individuals. In such cases, separate models optimized on the different objectives can indicate the range of performance obtainable on the different criteria; separate model scores on the individuals are also often combined to obtain a joint measure of expected performance. Handling multiple objectives individually in this manner, however, seldom yields good solutions to the overall problem [7]. Further, different performance objectives sought can often run counter to each other. Given conflicting objectives, high performance from a model on one objective may correspond to poor performance on the others; a suitable solution here will involve obtaining an acceptable tradeoff amongst the multiple objectives. A common approach to multi-criteria optimization is to reformulate it as a single objective problem. Aggregation functions based on domain knowledge and decision-maker preference may be used, and linear weighted averages are often considered [23]; here the weights for the different objectives are specified according to desired tradeoffs. Where the nature of
ABSTRACT Predictive models in direct marketing seek to identify individuals most likely to respond to promotional solicitations or other intervention programs. While standard modeling approaches embody single objectives, real-world decision problems often seek multiple performance measures. Decision-makers here desire solutions that simultaneously optimize on multiple objectives, or obtain an acceptable tradeoff amongst objectives. Multi-criteria problems often characterize a range of solutions, none of which dominate the others with respect to the multiple objectives - these specify the Pareto-frontier of nondominated solutions, each offering a different level of tradeoff. This paper proposes the use of evolutionary computation based procedures for obtaining a set of nondominated models with respect to multiple stated objectives. The targeting depth-of-file presents a crucial real-world criterion in direct marketing, and models here are tailored for specified file-depths. Decision-makers are thus able to obtain a set of models along the Pareto-frontier, for a specific file-depth. The choice of a model to implement can be thus based on observed tradeoffs in the different objectives, based on possibly subjective and problem specific judgements. Given distinct models tailored for different file-depths, the implementation decision can also consider performance tradeoffs at the different depths-offile. Empirical results from a real-world problem illustrate the benefits of the proposed approach. Both linear and nonlinear models obtained by genetic search are examined.
Keywords Evolutionary Computation, Data Mining, Multiple Objectives, Pareto-Optimal Models, Database Marketing.
1. INTRODUCTION Predictive models in direct and target marketing (DM) seek to identify customers/prospects (individuals) most likely to respond
Permission to make digital or hard copies of part or all of this work or personal or classroom use is granted without fee provided that copies are not made or distributed for profit or commercial advantage and that copies bear this notice and the full citation on the first page. To copy otherwise, to republish, to post on servers, or to redistribute to lists, requires prior specific permission and/or a fee. KDD 2000, Boston, MA USA © ACM 2000 1-58113-233-6/00/08 ...$5.00
465
programming (GP) [15] are also presented. An experimental study further investigates two key algorithmic characteristics, namely the population size and elitist selection, in terms of obtained model performance. For the application example considered, the Pareto genetic search is found to yield significant performance improvements over standard industry approaches. Experiments also reveal the importance of the suggested elitist selection scheme, particularly so when using smaller population sizes. The next section briefly looks at performance analysis of direct-marketing models, and the generic approach for obtaining models optimized for different depths-of-file. Section 3 elaborates on the genetic algorithm based procedure for learning the Pareto-optimal set of models. Experimental results on are provided in Section 4, followed by a discussion of future research issues.
such tradeoffs is not well understood – as in the case of most complex data-mining scenarios- a precise articulation of preference becomes difficult. Usually, multiple solutions incorporating varying tradeoffs amongst the objectives need to be obtained, and the most satisfactory amongst these chosen. Note that multi-criteria problems, especially when considering conflicting objectives, do not carry a single best solution, but are instead, characterized by a range of solutions, none of which dominate the others with respect to the different objectives. These specify the Pareto-frontier of non-dominated solutions – each of the solutions offers a different level of tradeoff, and can be the decision model of choice. It is thus desirable that solutions along the Pareto-frontier be examined in determining the most effective model to implement. Ad-hoc manipulation of the weighted objective function to explore different models is inefficient and tiresome. A preferred approach is to obtain a set of Paretooptimal solutions in a single invocation of the model development procedure. An added consideration in DM models arises from budget constraints in implementation of models. Given resource limitations, models are typically used to target only a fraction of individuals in the customer database. For instance, out of a total customer file of a million individuals, resources might permit solicitations to, say, only 200,000 of them. Obviously, the most promising 20% of individuals, as indicated by the model, will be targeted. Since model performance assessment needs to consider how the model is used or implemented; performance of DM models is typically assessed at different mailing depths. This depth-of-file to which score-ranked individuals are targeted provides potentially useful information for model specification. Most conventional approaches, however, do not take this information into account during model development. Noting that traditional performance estimates based on accuracy or data-fit are inadequate for maximizing business payoffs, Massand and Piatetsky-Shapiro [19] propose the development of separate models using stratified samples from the customer file, and combining predictions from the different models. A genetic algorithm (GA) based approach for obtaining models tailored to specific targeting-depths is given in [2][3]. This paper proposes the use of evolutionary computation based procedures for obtaining a set of non-dominated models with respect to multiple stated objectives. In keeping with [2], models here are explicitly tailored to specified depths-of-file. Decision-makers are hereby able to obtain a set of models along the Pareto-frontier, for a specific depth-of-file. The final choice of model to implement can be thus based on observed tradeoffs and an acceptable compromise in the different objectives, based on possibly subjective and problem specific judgements. Note that distinct sets of models apply for different targeting-depths. The implementation decision can thus also consider performance tradeoffs at different depths-of-file. Experimental results using a real-world data set examine tradeoffs between two conflicting objectives and illustrate the potential benefits of proposed approach. Two evolutionary computation techniques are considered. A traditional GA is used to obtain models that are linear in the predictors [2][13]; such linear models facilitate a fair comparison with traditional approaches common in industry use. Relative advantages offered by the tree structured non-linear representation of genetic
2. DECILE ANALYSIS, THE DMAX APPROACH, AND NON-DOMINANCE As noted above, given that DM models are used to identify a subset of the total customers expected to maximize response to a solicitation or some other performance criterion, model performance is assessed at different targeting or mailing depths. Targeting decisions are then undertaken considering costs and expected returns at different depths-of-file. A decile analysis [4] is typically used to examine model performance. Here, individuals are ranked in descending order of their respective model scores – higher scores indicating better performance – and separated into 10 equal groups. Table 1 shows a typical decile analysis. The Cumulative Lifts at specific depths of file provide a measure of improvement over a random mailing, and are calculated as: cum. avg. performanc e decile Cumulative Lift decile = * 100. overall avg. performanc e The first row, or top decile, indicates performance for the best 10% of individuals as identified by the model. Thus, in Table 1, a cumulative lift of 447 in the top decile indicates that the model in question is expected to provide a mailing response that is 4.47 times the response expected from a random mailing to 10% of the file. Similarly, if 20% of the file is to be mailed, the model is expected to perform 4.03 times better than a random mailing (no model). The cumulative lift at the bottom decile is always 100 and corresponds to a targeting or mailing to the entire file. A GA based approach to determining models with explicit consideration of the mailing depth of interest is given in [2]. In this decile-maximizing (DMAX) approach, the depth-of -file is an input parameter to the model search process, and models obtained are tailored to the specific mailing depth of interest. Thus, if resource limitations allow mailing to, say, only 20% of the total customer file or database, a DMAX model can be obtained for the specified objectives and knowledge that only 20% of the database will be targeted, thus seeking to insure that the total expected performance, amongst the 20% of individuals identified by the model, is maximized. Models optimized for different depths-offile also provide decision-makers a useful view of expected performance at different deciles, thereby aiding in the selection of a mailing depth with desired tradeoffs.
466
Table 1: Sample Decile Analysis Number of Responses
Response Rate
Decile
Number of Customers
(%)
Cumulative Responses
Cumulative Response Rate (%)
Cumulative Response Lift
top
2500
2179
87.2
2179
87.2
447
2 3
2500
1753
70.1
3932
78.6
403
2500
396
15.8
4328
57.7
296
4
2500
111
4.4
4439
44.4
228
5
2500
110
4.4
4549
36.4
187
6
2500
85
3.4
4634
30.9
158
7
2500
67
2.7
4701
26.9
138
8
2500
69
2.8
4770
23.9
122
9
2500
49
2.0
4819
21.4
110
bottom
2500
55
2.2
4874
19.5
100
Total
25,000
4874
19.5
The multi-objective modeling approach taken in this paper seeks to obtain the set of non-dominated solutions with respect to defined objectives at specified depths-of-file d. We first formalize the notion of non-dominance: consider n objectives πdi(f(x)), i=1,..,n where x denotes the vector of predictors in a model f(x). Assuming, without loss of generality, the maximization of all objectives, a model f a(x) is said to dominate another model f b(x) iff
π
non-dominated dominated models
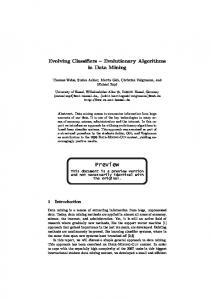
∀ i : πid ( f a (x )) ≥ π id ( f b ( x )) , and ∃j : π dj ( f a ( x )) > π dj ( f b (x )) . Otherwise the models f a(x)and f b(x) are non-dominated with respect to each other. The set of models that are non-dominated by other models in the problem forms the non-dominated or Pareto-optimal set of models. Several non-dominated models typically exist for multiobjective problems, especially when considering conflicting objectives. This is indicated in Figure 1, considering twoobjectives. The set of non-dominated models thus forms the Pareto-frontier, representing different degrees of tradeoffs amongst the objectives. Note that solutions that optimize single objectives will be towards the extremities of the frontier, and weighted combination of objectives into a single fitness function will foster search towards a specific part of the tradeoff frontier only. The evolutionary computation based approach taken in this paper seeks to obtain solutions along the entire Pareto frontier, thereby providing decision-makers with a range of models exhibiting varying levels of tradeoff.
π Figure 1: Multiple objectives and non-dominated solutions objectives is used to estimate the desirability of the population members, and its specification is a crucial issue in genetic search. A thorough account of the mechanics of genetic search can be found in [9][20][21]. Genetic programming (GP) [15] is a GA variant that uses tree structured representations, thereby allowing search over the space of non-linear models. GAs are noted to be useful for obtaining solutions for multiobjective problems [7]. While weighted combinations of multiple objectives into a single-valued fitness measure are readily usable, the population based search process also presents effective mechanisms for searching along multiple objectives in parallel. In the vector-evaluated GA of [24], sub-populations are selected separately based on fitness along each of the different objectives; reproduction operators are then applied after shuffling all these sub-populations. Such shuffling is, however, found to be equivalent to a linear weighted function of the objectives, with weights determined by the sub-population distributions in the different generations [22]. In considering multiple, conflicting objectives, it is noteworthy that no linear weighted combination yields solutions in a concave region of tradeoffs amongst
3. GENETIC SEARCH FOR MULTIOBJECTIVE MODELS Genetic algorithms provide a stochastic search procedure based on principles of natural genetics and survival of the fittest. They operate through a simulated evolution process on a population of string structures that represent candidate solutions in the search space. Evolution occurs through (1) a selection mechanism that implements a survival of the fittest strategy, and (2) genetic recombination of the selected strings to produce offspring for the next generation. A fitness function embodying the decision
467
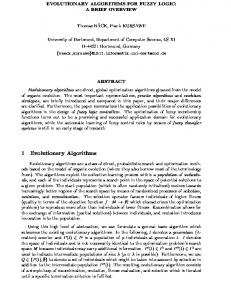
also allows a direct comparison with traditional statistical techniques common in use in DM. The linear models here specify a vector of weights w corresponding to the attributes, and each population member represents such a weight vector. We restrict each element of w ∈ [-1,1], since the weight vector w scores and ranks individuals similarly to λw for any λ ∈ ℜ , where ℜ denotes real numbers. Tree-structured representations in GP allow models that explore non-linear relationships in the predictors. Models here specify a function f (x) of the predictor variables that can be depicted as a parse tree, thus allowing arbitrarily complex functions based on a defined set of primitives [15]. Figure 2 gives an example of a tree-structured model. The internal nodes specify a functional primitive from a pre-defined function-set, and leaf nodes specify values from a terminal-set composed usually of problem variables and constants. For the models in this paper, the function-set F = {+, -, *, /, exp, log} is used, and the terminal-set is T = {ℜ , x1, x2, ..., xn}, where ℜ denotes the set of real numbers and xi the predictor variables.
objectives [7]. Other sub-population schemes are presented for example in [16]. Alternate GA approaches to multi-objective optimization use Pareto-based selection schemes – here, the selection of members for the new generation is based on some non-dominance criterion. Non-dominated solutions may be assigned equal selective pressure as in [9], or population members can be ranked by the number of solutions in the population that they are dominated by, as in [8]. Other related approaches are examined in [11][17]. While such Pareto-based approaches are immune to nonconvexities in the tradeoff surface, they may not ensure a full exploration along the entire Pareto-frontier. Various niching techniques [11][18] have been proposed to further enhance Pareto-GAs by fostering wider sampling along the non-dominated frontier (see [7] for an overview).
3.1 Pareto-Based Selection This study uses the simple and elegant Pareto-based scheme of [17] to obtain the set of non-dominated solutions. This is a variant of binary tournament selection [21] and operates as follows: a pair of solutions (parents) is randomly selected from the current population, and the recombination operators (crossover and mutation) applied in the usual manner to generate two new solutions (offspring). Then the Pareto-optimal set of parents and offspring is produced, and two solutions from this set are randomly selected for the new population. This procedure is repeated to fill the entire population for the next generation. The process in general can be applied with tournament sizes greater than two also. This manner of selection is noted to naturally foster the development of niches exploring different regions of fitness tradeoffs [17]. Elitism in selection, where the best solution is retained intact into the next generation, has been noted to be crucial for effective search [21]. In a Pareto-GA scheme, a population will usually contain several non-dominated solutions. Elitism here can be incorporated by retaining some portion of the current population's non-dominated solutions into the next generation. While elitism is often noted to improve results by fostering local search in the region of the best solution, excessive compromise on the global search perspective can lead to degraded performance. In the Pareto-selection scheme used here, this paper suggests an elitist selection mechanism that is effected by preserving the entire set of non-dominated solutions in the next generation. Given that the population contains multiple non-dominated solutions that show a range of performance on the objectives, this elitist mechanism will tend to promote local search around the various non-dominated solutions -- without focusing narrowly around a single highfitness solution. The genetic search will, of course, be less ineffective when non-dominated solutions constitute a large portion of the population.
3.3 Genetic search operators Crossover and mutation form the two basic recombination operators. Crossover implements a mating scheme between pairs of “parents” to produce “offspring” that carry characteristics of both parents. Mutation is a random operator applied to insure against premature convergence of the population; mutation also maintains the possibility that any population representative can be ultimately generated. Standard operators from the literature are used, and give space restrictions these are not elaborated here. In the GA used for the linear models, a real string representation and
+ *
*
+
exp *
X2 X1
*
X4
X1
X1
.7
2.1 (2.1x1 + x2) exp(x1) + 0.7x1x4
Figure 2: GP parse-tree model example standard search operators [20 ] are used -- arithmetic and exchange crossover, uniform mutation, and a non-uniform mutation operator that conducts focussed local search with increasing iterations. Standard crossover and mutation on subtrees [15 ] is also used for the GP - crossover exchanges randomly chosen sub-trees of two parents to create two new offspring, and mutation randomly changes a sub-tree. Given that regular GP operators are often found inadequate for learning numeric constants [6], the non-uniform mutation is used here too. The genetic search begins with a population of randomly
3.2 Model Representation In the context of the present problem, each population member can specify a model expressed in symbolic rule form [5], in a treestructured form as in genetic programming (GP) [15], or as a weight vector on the predictor variables [13]. This paper considers models that express a linear combination of predictors as in [13], and also models expressing non-linear relationships as in GP. Linear models are often preferred for decision-making [10], given the ease of interpretation of results and higher reliability in predicting unseen cases. The use of linear models
468
expected revenue that can be saved through identification of highvalue churners. This is estimated at a specific decile d as follows: Consider Rd and Cd the cumulative total revenue and cumulative total number of churners respectively at the decile d, R the total revenue for the entire data, and C the total churners in the entire data. Then, if N denotes the overall total customers and Nd is the total customers up to the decile level d, the cumulative churn and revenue lifts are: Churn-Lift= (Cd / N d ) /(C / N )) , and
generated models, and is terminated after a fixed number of iterations.
4. EXPERIMENTAL STUDY An experimental study using a real-world problem and data was conducted to determine the effectiveness of the Pareto-GA approach for handling multi-objective data-mining problems. Separate training and holdout (test) data sets were maintained for performance analyses. Since developed models have a predictive purpose in that they are used for selecting people for future solicitations or intervention programs, the cumulative lifts on the unseen test data provide the performance measures of interest; models that exhibit robust performance across the training and test data are sought. In keeping with the decile-performance objective, presented experiments analyze performance across different specified depths-of-file or decile-levels. Two sets of experiments are given: the first analyzes performance of models across different specified depths-of-file, considering both linear (GA) as well as non-linear (GP) models; the second set then examines the impact of elitist selection and population size on obtained model performance. The problem considered is that of a cellular-phone provider seeking to identify potential high-value churners so that they can be targeted with some appropriate intervention program. The specific objective is to identify high-value churners amongst new installs within the first year of service. Two dependent variables correspond to the two objectives: a binary Churn variable indicating a 1 for customers who churned within the first four months, and a continuous variable measuring revenue ($). The predictor variables considered pertain to standard measures used in the cellular industry like minutes-of-use (peak and off-peak), average charges, and payment information; these were obtained after the usual variable transformation and reduction. Predictor variables were normalized to zero mean and unit standard deviation prior to application of the GA procedures. A sample data set of 50,000 was provided for the modeling. This was separated into equal training and test sets of 25,00 observations each. A logistic regression model for Churn and an OLS regression model for Revenue show baseline performances for the two objectives. While these models are expected to perform well on their respective single objectives, they may not provide effective solutions for the overall problem. Performance is considered in terms of cumulative lifts at the specified depths-of-file. Performance of a model on the Churn objective is indicated by the Churn-Lift at the considered decile - a model that captures more churners at the top deciles thus shows superior performance in identifying churners. Similarly, the $-Lift at a specified decile level indicates performance on the revenue objective - note that this indicates high-value customers only, without regard for their churn likelihood. Where a high churn-lift does not correspond to high values of $-lift, different levels of tradeoff exist experiments here examine whether the GA-Pareto approach is able to find this tradeoff or Pareto-frontier. As indicated earlier, the final selection of model to implement can be based on various factors of concern to the decision-maker - for instance, it may be desirable that performance on both objectives be above some minimal threshold level, and judgments may consider individual, subjective factors too. Given the business problem considered here, the overall modeling objective is considered as the maximization of the
$-Lift = ( Rd / N d ) /( R / N )) . The expected revenue saved through identifying the churners up to the depth-of-file d is given by (Average-churn per customer)d*(Average revenue per customer)d = (Cd / N d )( Rd / N d ) =(Churn-Lift*$-Lift)( ( R / N )(C / N ) ). The product of Churn-Lift and $-Lift values directly gives the cumulative lift on the expected-revenue-saved as: ( (Cd / N d )( Rd / N d ) ) / ( ( R / N )(C / N ) ). The product of Churn and revenue lifts thus provides a measure for comparing the performance of models on expected-revenuesaved. The various parameters were set in accordance with values commonly in use [20], and based on initial trial runs of the GA/GP. For elitist selection, the entire set of non-dominated solutions was retained intact into the next generation. Learning was terminated after 100 generations.
4.1 Multi-Objective Models at Different Decile Levels Figures 3-7 plot the performance of models obtained by the Pareto-GA/GP on the two objectives. Each graph pertains to a different decile level. At each decile level, five independent runs of the GA and GP were conducted and the sets of non-dominated models obtained were aggregated to get the final set of Paretooptimal models - note that the entire collection of models obtained from across the five runs may not be non-dominated with respect to each other. Performance of the logistic and OLS regression models is also shown. Figure 3 shows the results on the training data for models tailored for the top decile; the performance of these models on the test data is given in Figure 4 - due to performance differences between the training and test data, not all the models may be non-dominating on the test data. Difference in performance between training and test data is, however, noticed to be small, and only performance on the test data is shown for the other file-depths. Performance reported in the tables below are also on the test data. Table 2 shows the total number of non-dominated models obtained by the GA for the different deciles, and the minimum and maximum performance of the models on the two objectives. The minimum and maximum performance values here are not for a single model, but are values across all non-dominated models for that decile. The performance of the best of the GA and GP obtained models (model giving maximum product of lifts on the training data), together with that of the logistic regression and OLS models, is shown in Table 3. A comparison of models on expected-savings-in-revenue, indicated by the product of the Churn-lift and $-lift, is also given in Table 3. The last two rows indicate the improvement in performance – product-of-lifts – of the best GA and GP obtained model over the logistic regression and OLS models.
469
Pareto-GA is seen to learn models that perform at least comparably on the single objectives. While OLS and logistic regression models - popular in industry use - perform well on the single criteria that they model, they do not provide a decisionmaker with the different tradeoffs that the data may admit. With the proposed evolutionary computation based approaches, the selection of a model to implement, from amongst the nondominated set, can now be made in consideration of a variety of factors of possible concern to a decision-maker. For the problem in the experimental study, considering expected-revenues-saved through an intervention program for potential churners as a criterion for judging overall model performance, the best of the GA and GP obtained models are noticed to yield significantly superior performance over the logistic regression and OLS models at the different depths-of-file (Table3). It is noteworthy that large improvements are observed even at the 70% depth-of-file. The proposed elitist selection mechanism with the multiobjective genetic search procedure preserves the entire set of nondominated solutions into the next generation. Experimental results highlight the importance of elitism in the selection operation, and show that it is helpful in obtaining better performance models. Elitism is observed to be particularly useful when using smaller population sizes. Smaller populations may be desired in data mining contexts due to reduced running times, especially with large data sets. While the results presented here demonstrate the utility of the Pareto-GA approach for learning models for multi-objective data mining problems, various issues remain for further investigation. Genetic search was considered here using a model representation that is linear in the predictors, and a non-linear tree based representation; the genetic search approach, however, is equally amenable for learning rule-based representations as in [5]. Genetic learning of neural networks has been examined in the literature [14][26], and provides another avenue for obtaining models that capture non-linear patterns in the data. The efficacy of the Pareto-GA approach in the presence of a larger number of objectives needs examination. With increasing number of objectives, larger populations may be required for adequate search, and the nature of the relation between number of objectives and population size needs investigation. In agreement with [17], the Pareto-GA scheme used has been found effective in exploring solutions across the tradeoff frontier. Further investigation with other data sets is, however, required to examine whether additional niching mechanisms [18] prove useful. With the experimental data considered in this paper, only minor differences were noticed between performances on the training and test data for both the GA obtained models and the OLS and logistic regression models. Overfitting to the training data, and consequent shrinkage in performance from the training to the test data can, in general, present problems. Further research should examine how multi-objective genetic search can influence overfit. Resampling techniques, found useful for the genetic learning of DMAX models [3], are applicable here also. A further avenue for work lies in providing tools for visualization of models yielding various tradeoffs amongst multiple objectives. Such a facility can provide a useful aid for decision-makers in selecting from amongst multiple models, especially in situations where a large number of objectives and factors come into play. Identifying churners presents in itself an important problem in data mining. In this paper, it has only been taken as an
4.2 Elitism and Population Size A series of GA runs were conducted to examine the impact of elitism, and its relation to population size, in the multi-objective genetic search scheme. For the non-linear GP, results were found to be similar to those observed for the linear GA. The experimental setup considered 3 population sizes of 50, 100 and 200 solutions, both with and without elitism; with 10 independent runs using different random number seeds, a total of 60 runs were conducted. For these experiments examining elitism, performance was considered at the first decile level only. Performance is evaluated in terms of the cumulative response-lift, $-lift and product-of lifts (indicating expected revenue saved), and the number of non-dominated solutions in the final population. For each GA-run, the maximal value on the lifts from amongst the non-dominated solutions was taken. The various GA parameters were set in accordance with values commonly used, and based on initial trial runs of the GA. The following parameter values were used: the overall crossover rate is set at 0.7; uniform mutation rate at 0.2, non-uniform mutation rate at 0.3, and the exchange crossover and arithmetic crossover probabilities set at 0.4 and 0.6 respectively. The search was terminated after 100 generations in all cases. In an analysis of variance (details omitted for space restrictions) of the maximal cumulative-lifts for the test data, both elitism and population-size are found significant in explaining the variance in results, with elitism explaining a larger portion of the variance for all the lift measures; as expected, population size was seen to play a major role with respect to number of nondominated solutions. T-tests on performance differences with and without elitism at the different population sizes provide insights into observed performance (Table 4). Given space restrictions, only the mean values of the product-of-lifts and number-of-non-dominatedsolutions is shown, and numbers in brackets represent the standard deviation. The last row in Table 5 gives the p-values for the difference in means of the corresponding measures with and without elitism. Significant differences are observed between the with-elitism and without-elitism results for both the product-oflifts and the number of non-dominated solutions; at all the three population levels, elitism always provides improved performance. Note also that the differences in performance with and without elitism decreases with increasing population size - elitism is particularly helpful when considering smaller populations.
5. DISCUSSION AND FUTURE RESEARCH The Pareto-genetic algorithm used is seen to be effective at obtaining solutions with varying levels of tradeoff. The learning of linear as well as non-linear models was explored, and the desired tradeoff frontier observed in both cases. Non-linear models, as expected, were found to mostly dominate the performance of their linear counterparts. The DMAX approach [2] utilizes genetic search in obtaining predictive data-mining models in explicit consideration of a key business objective -- the different targeting depths-of-file. In this paper, multi-objective genetic search, in combination with the DMAX approach, was used to learn a range of models spanning the Pareto-frontier at all the decile levels considered. The OLS and logistic regression models, as expected, exhibit performance located towards the extremes of the tradeoff frontier, and the
470
example real-world problem illustrating the application of the Pareto genetic search approach. Various data mining techniques may be applicable for modeling churn, and this paper has only considered the statistical approaches common in industry use. An in-depth examination of different methods for modeling churn will be useful. Finally, we note that many real-world problems in data mining can profitably utilize the multi-objective GA approach presented in this paper. Along the lines of the example used here, problems in the telecommunications industry often seek to model customers' tenure in combination with usage - identifying people who have long tenure and high usage of services. In catalogue and retail sales, models identifying potential buyers who will not return purchased goods are useful; similarly, models that identify potential responders to mailings who are also likely to buy some specific product are often sought. Multiple and often conflicting objectives are also seen in the context of many cross-selling marketing campaigns. Further application examples occur in the financial services industry, where models, for example, can seek customers who are likely to be approved for credit and who can also be expected not to make late payments or default on loans.
[9] D.E. Goldberg, Genetic Algotrithms in Search, Optimization and Machine Learning, Addison-Wesley, Reading, MA, 1989.
[10] Hand, D.J., Discrimination and Classification, 1981, John Wiley and Sons, New York, NY.
[11] Horn, J., N. Nafpliotis and D.E. Goldberg, "A Niched-Pareto Genetic Algorithm for Multi-Objective Optimization", in Proceedings of the First IEEE Conference on Evolutionary Computation (ICEC-94), 1994. Volume 1, p. 82-87.
[12] Hosmer, D.W. and S. Lemeshow, Applied Logistic Regression, John Wiley and Sons, 1989.
[13] Koehler, G.J., “Linear Discriminant Functions Determined through Genetic Search”, ORSA Journal on Computing, 3(4): 345-357, Fall, 1991.
[14] Kitano, H., "Neurogenetic Learning: An Integrated Method of Designing and Training Neural Networks using genetic Algorithms", Physica D, vol. 75, 1994, p.25-238.
[15] Koza, J.R., Genetic Programming: On the Programming of Computers by Means of Natural Selection, MIT Press, 1993.
6. ACKNOWLEDGMENTS
[16] Kursawe, F., "A Variant of Evolutionary Strategies for
The author thanks Dr. Bruce Ratner for numerous discussions on the subject matter presented here, and for providing the data used for the experiments.
Vector Optimization", in Proceedings of the First Workshop, Parallel Problem Solving from Nature, Lecture Notes in Computer Science, vol. 496, 1991, Springer-Verlag, p. 193197.
7. REFERENCES
[17] Louis, S.J. and G.J.E. Rawlins, "Pareto-Optimality, GA-
Classification Techniques in Business, Banking and Finance, JAI Press, Greenwich, CT, 1981.
Easiness and Deception", In Proceedings of the Fifth International Conference on Genetic Algorithms, S. Forrest (Ed.), 1993, p. 118-123.
[2] Bhattacharyya, S., "Direct Marketing Response Models using
[18] Mahfoud, S., "Niching Methods for Genetic Algorithms", Ph
Genetic Search", in Proceedings of the Fourth International Conference on Knowledge Discovery and Data Mining (KDD-98), New York, AAAI Press, 1998.
D. dissertation, University of Illinois at Urbana Champaign, 1995.
[1] Altman, E.L., R.A. Eisenbeis and J. Sinkey, Application of
[19] Massand, B. and G. Piatetsky-Shapiro, "A Comparison of Different Approaches for Maximizing the Business Payoffs of Prediction Models", Proceedings of the Second International Conference on Knowledge Discovery and Data Mining, E. Simoudis, J. W. Han, and U. Fayyad (Eds.), 1996, p.195-201.
[3] Bhattachryya, S. (1999), "Direct Marketing Performance Modeling using Genetic Algorithms", INFORMS Journal of Computing, vol. 11, no. 2, Summer 1999.
[4] David Shepard Associates, The New Direct Marketing: How to Implement a Profit-Driven Database Marketing Strategy, 2nd Edition, 1995, Irwin Pub
[20] Michalewicz, Z., Genetic Algorithms + Data Structures = Evolution Programs, 2nd Edition, 1994, Springer-Verlag.
[5] DeJong, K., W.M. Spears, and D.F. Gordon, “Using Genetic Algorithms for Concept Learning”, Machine Learning, 13, 1993, p. 161-188.
[21] Mitchell, M., An Introduction to Genetic Algorithms, MIT
[6] Evett, M. and T. Fernandez (1998), "Numeric Mutation
[22] Richardson, J.T., M.R. Palmer, G. Liepins and M. Hilliard,
Improves the Discovery of Numreic Constants in Genetic Programming", in Proceedings of the Third Annual Genetic Programming Conference, J.R. Koza, et al., (Eds), Wisconsin, Madison, Morgan Kaufmann.
"Some Guidelines for Genetic Algorithms with Penalty Functions", in Proceedings of the Third International Conference on genetic Algorithms, J.D. Schaffer (Ed.), 1989, p. 191-197.
[7] Fonseca, C.M. and P.J. Fleming, "An Overview of
[23] Rivett, P., The Craft of Decision Modeling, Wiley:London,
Press, 1996.
1984.
Evolutionary Algorithms in Multi-Objective Optimization", Evolutionary Computation, 3 (1), 1995, p. 1-16.
[24] Schaffer, J.D., "Multiple Objective Optimization with Vector Evaluated Genetic Algorithms", in Genetic Algorithms and their Applications: Proceedings of the First International Conference in Genetic Algorithms, J.J. Grefenstette (Ed.), 1985, p. 93-100.
[8] Fonseca, C.M. and P.J. Fleming, " Genetic Algorithms for Multi-Objective Optimization: Formulation, Discussion and Generalization", in Proceedings of the Fifth International Conference on Genetic Algorithms, S. Forrest (Ed.), 1993, p. 416-423.
471
of the Third International Conference on Algorithms, J.D. Schaffer (ed.), 1989, p. 391-396.
[25] Tukey, J.W., Exploratory Data Analysis, 1977, Reading, Mass.: Addison Wesley.
[26] Whitley, D. and T. Hanson, "Optimizing Neural Networks using Faster, More Accurate Genetic Search", in Proceedings Table 2: GA an GP Pareto solutions Non-dominated models Number of GA models GP Churn-Lift GA:Min, Max GP:Min, Max GA:Min, Max $-Lift GP:Min, Max
Decile 1 98 95 132.1, 464.7 94.8, 475.2 46.0, 361.5 61.8, 372.3
Decile 2 112 99 136.0, 401.3 107.8, 417.9 86.8, 271.6 84.7, 276.5
Decile 3 106 78 119.96, 309.8 106.2, 310.3 97.4, 223.9 98.3, 226.1
Decile 7 45 45 106.2, 139.6 95.9, 139.8 114.2, 136.6 107.7, 137.2
Table 3: Comparing performance – best GA and GP models based on Product-of-Lifts Performance Churn-Lift, $-Lift GA-best Product of Lifts Churn-Lift, $-Lift GP-best Product of Lifts Logistic Churn-Lift, $-Lift Regression Product of Lifts OLS Churn-Lift, $-Lift Regression Product of Lifts GAImprovement over Logistic GA:Improvement over OLS GPImprovement over Logistic GP:Improvement over OLS
Decile 1 304.9, 261.7 797.8 343.7, 256.5 881.5 447.1,111.8 499.8 116.2, 360.5 418.8 59.6% 90.5% 76.4% 110.5%
Decile 2 265.4, 207.4 550.4 343.5, 182.1 625.5 403.4, 72.6 292.7 108.1, 271.7 293.71 88% 87.4% 113.7% 112.9%
Decile 3 272.3. 155.0 422.2 275.1, 178.3 490.4 295.9, 57.4 169.96 99.7, 223.2 222.5 148.4% 89.3% 188.5% 120.4%
Decile 7 138.8, 126.9 176.1 139.4, 131.2 182.9 137.8, 66.7 91.9 91.8, 136.2 125.1 91.6% 40.8% 98.9% 46.2%
Table 4: Comparing the effect of Elitism at different population sizes PopSize=50
PopSize=100
PopSize=200
ProdLifts
NumSolns
ProdLifts
NumSolns
ProdLifts
NumSolns
Elitism
794.21
31.7
794.89
48.5
794.57
68.6
(2.59)
(2.83)
(1.7)
(7.03)
(1.59)
(7.89)
No Elitism
735.29 (51.86)
23.7
781.83
36.6
779.36
54.7
(4.0)
(13.44)
(2.8)
(15.2)
(5.48)
0.0008
0.0002
0.011
0.0007
0.009
0.001
*
p-value
*: p-values on differences in means with and without Elitism
472
Genetic
Decile 1 (trg) 400 350
GP GA Logistic OLS
400 350
300
300
250
250 $-Lift
$-Lift
Decile 1 (Test)
GP GA Logistic OLS
200 150
200 150
100
100
50
50
0 0
100
200
300
400
500
0
600
0
50
100
150
200
250
Churn-Lift
300
350
400
450
500
Churn-Lift
Figure 3: 10% depth-of-file (training data)
Figure 4: 10% depth-of-file (test data)
Decile 2 (Test)
Decile 3 (Test)
GP GA Logistic OLS
300 250
GP GA Logistic OLS
250
200
$-Lift
150 150
100 100
50
50
0
0 0
50
100
150
200
250
300
350
400
0
450
50
100
150
200
250
Churn-Lift
Churn-Lift
Figure 5: 20% depth-of-file (test data)
Figure 6: 30% depth-of-file (test data)
Decile 7 (Test) 150 140 130 120
$-Lift
$-Lift
200
110
GP GA Logistic OLS
100 90 80 70 60 80
90
100
110
120
130
Churn-Lift
Figure 7: 70% depth-of-file (test data)
473
140
150
300
350