Journal of Education and Human Development March 2015, Vol. 4, No. 1, pp. 133-146 ISSN: 2334-296X (Print), 2334-2978 (Online) Copyright © The Author(s). All Rights Reserved. Published by American Research Institute for Policy Development DOI: 10.15640/jehd.v4n1a13 URL: http://dx.doi.org/10.15640/jehd.v4n1a13
Examining the Language Factor in Mathematics Assessments Adnan Kan1 & Okan Bulut2 Abstract In educational testing, assessment specialists typically create multiple forms of a test for different purposes, such as increasing test security or developing an item bank. Using different types of items across test forms is also a common practice to create alternative test forms.This study investigates whether word problems and mathematically expresseditems can be used interchangeably regardless of their linguistic complexities. A sample of sixth grade students was given two forms of a mathematics assessment. The first form included mathematicsitems based onmathematical terms, expressions, and equations. The second form included the same items as word problems. The underlying tasks and solutions of the items in the first test form were the same as the corresponding items in the second form. Explanatory item response modeling was used for examining the impact of item type and genderon difficulty levels of items and students’ test scores. The results showed that word problems were easier than mathematically expressed items. Gender and its interaction with the linguistic complexity of mathematics items did not seem to have any impact on student performance on the test. Keywords: Language, mathematics, explanatory item response theory, gender, bias
1. Introduction The effect of language on test performance has received great attention in educational research (Abedi & Lord, 2001; Huynh, Meyer, & Gallant, 2004; Ryan & Chiu, 2001; Spanos, Rhodes, Dale, & Crandall, 1988). Previous studiesabout the effect of language and linguistic complexity have suggested that changes in item type based on linguistic complexity may result inan unintended impact on students’ test performance; and further some groups of examinees may get differentially affected by those changes. The findings of these studies also demonstrate the significant connection between different subject areas (e.g., reading, mathematics, and science) and the language. Mathematics is a unique example of the connection between numbers and words. Aiken (1972) and Wakefield (2000) described mathematics as a specialized language with its own concepts and symbols that must be learned.Schleppegrell (2007) describes mathematics as a language-dependent subject, and points out that language is implicated in the learning of mathematics. Although mathematics concerns topics that are beyond the capabilities of native languages, it still requires reading comprehension skills to understand the content. In addition to symbols, operations, equations and so forth, one should know how to read and write in a language in which the symbolic language of mathematics is embedded. 1
Department of Education Sciences, Gazi University, Faculty of Education , Psychological Counseling and Guidance, Teknikokullar, Ankara, TURKEY 06500. Email:
[email protected], Phone: +90-312-202-8168 2 Department of Educational Psychology, University of Alberta, 6-110 Education Centre North, 11210 87 Ave NW, Edmonton, Alberta, CANADA T6G 2G5 . Email:
[email protected], Phone: +1-780-492-3668, Fax: +1-780-492-1318
134
Journal of Education and Human Development, Vol. 4(1), March 2015
In most cases, a certain level of reading abilitymay be required to understand andsolve a mathematicsproblem. Complex mathematical vocabulary can interfere with solving a mathematics item correctly. For instance, students who take mathematics items with easy syntax and easy vocabulary can obtain better scores than students who take mathematics items with more complex syntax and difficult vocabulary (Linville, 1970). Abedi and Lord (2001) foundthat English language learners (ELLs) tend to obtain lower scores on standardized mathematicstests than students who are fluent in English, which clearly indicatesthe language dependency of mathematics. In education, test developers use different item typesfor different purposes such as increasing test security ordeveloping an item bank. Different types of items can also beusedto create an alternative test form. In a mathematics test, an item can be presented by using graphics, numbers, symbols, or equations. As an accommodation or for the purpose of creating a simplified version of a mathematicsitem for students who struggle with the mathematical language or terms, more verbal and visual components can be included in the item. For instance, a mathematicsitem with a complex language and notationscan be revised by removing difficult symbols, notations, etc. and adding more verbal components. In this way, the problem can be explained in a context of a word problem.Munro (1979) uses the following example to explain how a mathematics item can be simplified in terms of its language: Item with mathematical expressions: Item with verbal expressions: A quarter of a certain number is 3. What is that If , what is x? number? According to Munro (1979), in solving the problem of x/4=3, a common error that students tend to make is to infer that x is 3/4. However, when the same item is asked using a simpler language, the studentcan code this mathematical statement logically and thus the student is likely to conclude that x is 3/4. Despite the advantages of word problems, it is not easy to determine whether this type of itemsona mathematics test can serve their expected functions.When a word problem is used on the test, examineesneed to use both mathematics and reading skills to solve the problem. Changing a simply written mathematics item into a verbose mathematics item may lead to unintended consequences because a word problemmight be easier for students with strong reading skills than those who do not have adequate reading skills. Therefore, this item would function differently from an item with the same content but less verbal components. Such an item may cause item bias or differential item functioning (DIF) in a mathematics assessment. Bias is a crucial issue not only because of fairness but also because it threatens the comparability of test scores (Pomplun & Omar, 2001). Theproblemsdescribed above bring us to the question of whether two forms of a mathematics item (e.g., a word problem and a computational item) that measure the same skill emerging from the same goal can be used interchangeably. To date, approaches to testing changes in item type or language in mathematics tests have been limited to procedures like DIF, test reliability, and factor analysis. For example, Doolittle and Cleary (1987) conducted a DIF analysis on the items of the American College Testing Assessment Mathematics Usage Test and found that female students performed better on algebra items and poorer on word problems. In a similar study, O’Neill and McPeek (1993) found that females were better on algebra items than males while males performed better on mathematics problem solving and word problem items than females. Scheuneman and Grima (1997) also suggested that the linguistic properties of test items may influence how the items function for male and female examinees. This study aims to address thequestion of whether word problems and mathematics items with mathematical notationscan be used interchangeably in a mathematics assessment. Also, the interaction between item type and gender was examined to identify if test bias occurs due to linguistic characteristics of mathematics items.
Kan & Bulut
135
As Li, Cohen and Ibarra (2004) suggested, structural characteristics of mathematics items may have some utility in predicting gender bias in mathematics assessments. A recently developed approach, explanatory item response modeling,was used for examining the effect of item typeon difficulty levels of items and students’ test performance. The explanatory item response modeling framework was explained in more detail in the following section.
0.6 0.4 0.0
0.2
Probability of a correct response
0.8
1.0
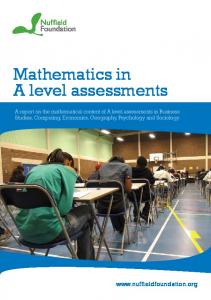
2. Theoretical Framework Item response theory (IRT) is a modern test theory based on the probabilistic distribution of examinees’ underlying latent trait (θ) at the item level. In IRT, the relationship between an examinee’s item performance and ability underlying item performance can be described by an item characteristic curve. An example of an item characteristic curve is presented in Figure1.
-4
-2
0
2
4
Ability
Figure 1: Item Characteristic Curve of a Dichotomously Scored Item According to Figure 1, as the level of an examinee’s ability increases, the probability of responding the item correctly increases as well.The point on the ability scale where the probability reaches 0.5 indicates the average difficulty level of the item. Because the item characteristic curve places item difficulty and person ability on the same scale, which usually ranges from -5 to +5, it is possible to see the interaction between the difficulty level of an item and the probability to respond to the item correctly depending on examinees’ ability levels. There is a variety of IRT models depending on the number of item parameters (e.g., Rasch model, two-parameter logistic model, and three-parameter logistic model), item type (e.g., dichotomous vs. polytomous), number of latent traits to be estimated (e.g., unidimensional vs. multidimensional IRT models), and data structure (e.g., multilevel IRT models). In addition, there is another family of IRT models that are used to solve practical and challenging educational problems by generalizing the traditional IRT models (Fox, 2004). De Boeck and Wilson (2004)introduced an IRT framework based on generalized linear modeling and named it as explanatory item response modeling (EIRM). Within the EIRM framework, dichotomous and polytomous IRT models can be extended by adding predictors at different levels (e.g., item, person, and person-by-item) to examine the effects of various covariates on item difficulties and latent traits. 2.1 Explanatory Item Response Modeling As explained earlier, EIRM can be defined as a special case of generalized linear modeling (Rijmen, Tuerlinckx, De Boeck, & Kuppens, 2003; De Boeck & Wilson, 2004; Kamata, 2001).
136
Journal of Education and Human Development, Vol. 4(1), March 2015
When IRT models are cast within the framework of generalized linear mixed-effect modeling (GLMM), it becomes possible to examine both within-person differences in item response probabilities, and between-person differences in the latent constructs being measured. The advantage of the EIRM approach over the traditional IRT models is that it provides a framework for both the psychometric and statistical analyses of items, persons, and related covariates (Briggs, 2008). To explain explanatory IRT modeling in more detail, this study follows the same notation used inDe Boeck and Wilson (2004). In explanatory IRT models, persons are clusters, items are the repeated observations nested within persons, and dichotomous responses are the dependent variable in a multilevel data structure. Responses are denoted as Ypi = 0 or 1, with p = 1,….,P as an index for persons, and i = 1, ……, I as an index for items. Ypi has a Bernoulli distribution with πpi,which is the expected value of Ypi based on the probability. A link function is used to place πpi into a continuous scale between -∞ and +∞. Equation 1 shows the formulation of the logit link function. (1) Since generalized linear models are not capable of estimating item discrimination and guessing parameters, only the Rasch model (Rasch, 1960) and its variants can be estimated. Using the logit link function in Equation 1, the Rasch model can be written in a GLMMform as follows: (2) where for all items, trait for person p as
is a diagonal matrix where if i=k and 0 otherwise, is the latent , refers todifficultylevel of item i, and is the error term for each item as
Whenthere is at least one item-relatedcovariate, person-related covariate, orperson-by-item covariateadded to Equation 2, the new model becomes an explanatory IRT model. The equation for the explanatory model with these covariates can be written as: (3) where
is a person covariate (e.g., and 0 otherwise), is an item covariate (e.g. , and 0 otherwise), and is an interaction term between an item covariate and a person covariate. Theeffects of these covariates canbe estimated as either fixed or random effects in thegeneralized linear model in Equation 3. Figure 2 demonstrates the relationship between the components of an explanatory item response model.
Kan & Bulut
137
Figure 2.A visual illustration of an explanatory item response model.Reprinted from “Explanatory item response models: A generalized linear and nonlinear approach” by P. De Boeck and M. Wilson (Eds.), 2004, New York: Springer. Reprinted with permission. Explanatory IRT models with item, person, and person-by-item covariates can be estimatedusingthe lme4 package (Bates, Maechler & Bolker, 2014) in R (R Development Core Team, 2014). Although the lme4 package is primarily used for estimating linear mixed-effects models, Rasch and explanatory IRT models can also be estimated using the nested structure of item responses. The lmer function in the lme4package estimates item and person parameters by defining a binomial distribution and a logit link function for the dependent variable, which is dichotomous item responses. The lmer function allows estimatingitem difficulties of explanatory IRT models either with an error term (i.e.,homoscedasticity of the error variance) or without an error term (i.e., no homoscedasticity assumed), which means that item difficulties can be either fixed or random effects as specified in Equation 3. It should be also noted that item difficulty in the GLMM framework becomes an indicator of item easiness as opposed to item difficulty parameter in traditional IRT models. 3. Methods 3.1 Sample and Data Collection The sample of this study consisted of sixth-grade students enrolled for the mathematics course in middle schools in Turkey. A total of 671 students (344 male, 327 female) were randomly selected from ten middle schools. Data collection was completed in two test administrations. A counterbalanced design was used by assigning the students randomly into two groups. In the first administration, group 1 (N=335) received the test with only mathematically-expressed items, and group 2 (N=336) received the test that included only word problems. In the second administration, group 1 was given the word problems, and group 2 was given the mathematically expressed items. There was a four-week interval between the first and second test administrations to reduce the carryover and practice effects. 3.2 Instrument Two forms of a mathematics test were developed by the researchers in cooperation with the mathematics teachers. Each test consisted of twenty five multiple-choice items with five response options. The content of the tests was pre-algebra and algebra topics. The first form consisted of items that were based on mathematical terms, formulas, and mathematical expressions.
138
Journal of Education and Human Development, Vol. 4(1), March 2015
The items were complex in terms of the mathematical language and vocabulary. The second form of the test included the same items, but this time the items were written as word problems. The items were simplified in terms of mathematical language while the mathematical operations needed to respond to the items remained the same. The underlying task and solution of an item in the first test form were the same as the corresponding item in the other form, which allowed for examining the effect of language complexity in the items by controlling for any task difference across two forms. Figure 3 shows anexample item from the two forms of the test. Mathematically-expressed item What is the least common multiple of 12 and 18? Word problem A patient takes his first and second medicines every 12 and 18 hours, respectively. After he takes both medicines at the same time, how many hours lateris he going to take two medicines together again?
Figure 3. An Example item Written as word Problem and a Mathematically-Expressed İtem Both forms of the item emphasize the same underlying task but in different ways. The mathematically expressed form of the item uses the mathematical term of “least common multiple” while the word problem form of the same item explains the task within a story but still requires the same mathematical operation. Thus, the two forms of the item seem different in terms of linguistic complexity but they still require similar mathematical operations and lead to the same solution. 3.3 Data Analysis Data analysis for this study consisted of three steps. In the first step, descriptive item and test statistics were calculated to examine if there was any problematic item in the test. Test reliability, mean and standard deviation of summed correct responses, and point biserial correlations of items were obtained. In the second step, item fit for the Rasch model was examined because in order to run explanatory IRT models, Rasch model should fit to the data first. Item fit is an indication of how well items perform according to the underlying IRT model being tested. Responses to the two test forms (i.e., mathematicallyexpressed items and word problems) were analyzed separately using the Rasch model in Winsteps (Linacre, 2006). The INFIT and OUTFIT fit indices provided by Winsteps, were used to determine the appropriateness of the Rasch model for the items. INFIT and OUTFITindicate the extent which the data match with the prescriptions of the IRT model (Bond & Fox, 2001).Mean squares (MNSQ) of INFIT and OUTFIT are expected to be 1.00. Values greater or less than 1 indicate the degree of variation from the expected score (Osteen, 2010). MNSQs for adequate item fit should be between .75 and 1.3 (Adams & Khoo, 1996; Smith, Schumacker, & Bush, 1998). In addition to checking item fit, item difficulties and person abilities from the two test forms were compared descriptively. In the last step of data analysis, three explanatory IRT models with an item covariate (item type), a person covariate (gender), and a person-by-item covariate (item type-gender interaction) were estimated using the lme4 package (Bates, Maechler,& Bolker, 2014) in R (R Development Core Team, 2014). In all explanatory models, person abilities and item difficulties were estimated as random effects with a mean of zero and other covariates were estimated as fixed effects.The two forms (i.e., word problems and mathematically expressed items) were used together to examine the effect of item type on item difficulties in the same model. To compare the three explanatory IRT models, Akaike's information criterion (AIC), Schwartz’s information criterion (BIC), and deviance statisticswere used. AIC and BIC provide a means for model selection by measuring of the relative quality of a statistical modelfor a given set of data. The model with smaller AIC and BIC values indicates a better model fit compared to the other models.
Kan & Bulut
139
Deviance statistics also can be used for comparing nested models with a chi-square test. For two nested models, the difference between the deviances has a large-sample chi-square distribution with degrees of freedom equal to the difference in the number of parameters estimated in the two models.The null hypothesis of whether the model with fewer estimated parameters fits the data equally well as the model with more parameters is tested in the chi-square test. 4. Results Descriptive statistics for mathematically-expressed items and word problems are presented in Table 1 and Table 2, respectively. According to Table 1, it seems that the test form with mathematically expressed items were slightly more difficult than the test form with word problems although the average number of correct responses were very similar across the forms. Both test forms indicated high internal consistency based on the coefficient alpha values. Table 1: Descriptive Statistics for Mathematically Expressed Items and Word Problems Items
Alpha Average Skewness Kurtosis S X Difficulty ME 25 671 14.15 6.65 .90 .566 .34 -1.284 WP 25 671 14.75 6.74 .91 .590 -.001 -1.318 ALL 50 671 28.90 12.81 .95 .578 .065 -1.317 Note: ME: Mathematically expressed items, WP: Word problems, ALL: All items; K: Number of items, N: Number of students, = Mean raw score, S: Standard deviation of raw scores, Alpha: Coefficient alpha; M.D: Mean Difficulty
K
N
Table 2 presents item difficulty (i.e., proportion correct),item discrimination, and point-biserial correlation for the two forms. Results indicated that item statistics obtained from the mathematically expressed items and word problems were mostly similar. The difference between item difficulties from the two forms ranged from 0 to .18. Fairly large differences across the two forms were found in item 7 (.11), item 9 (.13) and item 23 (.18). For these items, word problemswere more difficult than mathematically expressed items. All of the items had fairly high item-total correlations. Word problems seemed to have slightly higher item-total correlation than mathematically expressed items. None of the items were found problematic based upon the initial item analysis.
140
Journal of Education and Human Development, Vol. 4(1), March 2015
Table 2: Item Statistics for Mathematically Expressed Items and Word Problems Item
Word Problems Mathematically Expressed Items p rpb D p rpb D 1 0.51 0.66 0.78 0.54 0.63 0.74 2 0.43 0.59 0.69 0.43 0.58 0.67 3 0.41 0.55 0.64 0.36 0.48 0.52 4 0.66 0.44 0.48 0.69 0.42 0.46 5 0.35 0.60 0.65 0.33 0.56 0.60 6 0.53 0.49 0.57 0.54 0.40 0.43 7 0.82 0.47 0.43 0.71 0.53 0.57 8 0.74 0.52 0.51 0.72 0.50 0.53 9 0.51 0.54 0.59 0.38 0.50 0.55 10 0.43 0.56 0.63 0.48 0.65 0.76 11 0.45 0.53 0.63 0.43 0.54 0.63 12 0.72 0.56 0.60 0.69 0.57 0.62 13 0.69 0.63 0.67 0.63 0.48 0.54 14 0.48 0.61 0.71 0.49 0.51 0.58 15 0.72 0.61 0.65 0.65 0.68 0.78 16 0.57 0.59 0.66 0.60 0.60 0.71 17 0.61 0.61 0.70 0.63 0.62 0.70 18 0.73 0.39 0.41 0.72 0.35 0.35 19 0.43 0.52 0.59 0.42 0.50 0.56 20 0.81 0.42 0.36 0.75 0.50 0.52 21 0.72 0.59 0.65 0.65 0.62 0.71 22 0.61 0.52 0.59 0.56 0.54 0.64 23 0.66 0.56 0.61 0.48 0.48 0.57 24 0.56 0.43 0.46 0.64 0.36 0.38 25 0.61 0.59 0.66 0.64 0.64 0.71 p: Item difficulty, rpb: Point biserial correlation, D: Item discrimination In the second step of data analysis, item fit for the Rasch model was investigated. Item difficulties and item-fit statistics for the Rasch model were obtained through the Rasch model analysis in Winsteps. The results are presented in Table 4. Item difficulty indicates the level of the latent trait at which the probability of a given response to the item was .50. In the Rasch model, the latent trait, which is shown as theta (θ), is measured and scaled with a mean of zero and a standard deviation of one. As item difficulties increase, items become more difficult to endorse. Item difficulties in the test form with word problems ranged from 1.978 to 0.93, and item difficulties in the other form with mathematically expressed items ranged from 1.483 to 1.083. The mean difficulty of word problems and mathematically expressed items were -0.541 and 0.387, respectively. Table 3 also shows item fit statistics for the items. Item fit is evaluated based on the comparison of observed responses to expected responses for each item (Osteen, 2010). In this study, INFIT and OUTFIT values were used to check item fit. Based on the item fit criteria explained earlier, two items (item 13 from word problems and item 24 from mathematically expressed items) did not seem to have adequate fit. However, INFIT and OUTFIT values for these items were not largely deviated from the range of acceptable fit values. Therefore, these items were kept in the data analysis.
Kan & Bulut
141
Fifteen of the mathematically expressed items had higher item difficulties than the corresponding word problems (difference ranging from 0.095 to 1.034). Items 32, 34 and 48 showed especially large differences. For the rest of the items, word problems had either very similar difficulty with mathematically expressed items or slightly higher difficulties. In addition to the difference in item difficulties, the difference in person abilities between the two test forms was examined. Person abilities were estimated for each form separately. Figure 4 shows the density plot of person abilities from the two test forms. The density plot shows that there is more variation in the distribution of person abilities obtained from the test form consisting of word problems. When the students responded word problems, the number of students with very high or very low abilities was higher. When the students responded mathematically expressed items, most of the abilities were congregated around the mean. The variation of the abilities was not as high as the variation of the abilities obtained from the word problems. Table 3: Item Parameters and Fit Statistics for the Rasch Model Item
1 2 3 4 5 6 7 8 9 10 11 12 13 14 15 16 17 18 19 20 21 22 23 24 25
Word Problems Difficulty -0.0461 0.4162 0.5452 -0.9232 0.9309 -0.1590 -1.9785 -1.4145 -0.0635 0.3979 0.2625 -1.3180 -1.1494 0.1203 -1.3180 -0.4091 -0.6511 -1.3756 0.4253 -1.9317 -1.2895 -0.6597 -0.9410 -0.3833 -0.6164
Outfit MNSQ 0.78 0.95 1.14 1.23 0.95 1.22 0.70 0.77 1.01 1.04 1.12 0.82 0.63 0.92 0.74 0.91 0.80 1.22 1.18 0.88 0.70 1.08 0.83 1.42 0.81
Infit MNSQ
Mathematically Expressed Items Difficulty Outfit MNSQ
Infit MNSQ
0.86 0.97 1.03 1.12 0.93 1.13 0.91 0.92 1.06 1.04 1.07 0.87 0.80 0.93 0.80 0.95 0.89 1.11 1.09 0.99 0.84 1.03 0.94 1.20 0.93
-0.2108 0.3979 0.8415 -1.0944 1.0838 -0.2367 -1.2423 -1.2895 0.6961 0.1203 0.4253 -1.1035 -0.7907 0.0325 -0.8788 -0.5990 -0.7556 -1.2800 0.4528 -1.4835 -0.8611 -0.3747 0.0939 -0.8170 -0.7995
0.89 1.00 1.14 1.12 1.00 1.29 0.94 0.96 1.12 0.88 1.05 0.89 1.08 1.10 0.74 0.92 0.86 1.18 1.12 0.95 0.84 1.03 1.16 1.25 0.82
0.88 1.03 1.31 1.16 1.06 1.46 0.87 1.00 1.21 0.84 1.12 0.85 1.27 1.17 0.62 0.82 0.73 1.35 1.23 0.81 0.99 1.21 1.17 1.47 0.71
142
Journal of Education and Human Development, Vol. 4(1), March 2015
Figure 4: Distribution of the Students’ Ability Estimates from Two Test Forms In the finalstep of data analysis, three explanatory IRT models with item, person, and person-byitem covariates were estimated. The results from the explanatoryIRT models were presented in Table 4. In Model 1, item difficulties and person abilities were estimated as random effects and item type(i.e., word problem vs. mathematically expressed item) was estimated as a fixed effect toexplain the variation in item difficulties. Figure 5shows item difficulties for word problems and mathematically expressed items that were estimated as random effects in the same model. As explained earlier, item difficulty is an indicator of item easiness in the explanatory IRT models. Figure 5 shows that most word problems were easier than their corresponding items written as mathematically expressed items in the other form.
Figure 5: Item Difficulties of Word Problems (Left) and Mathematically Expressed Items (Right) from Model 1 In Model 1, the main effect of item type was statistically significant (β = 0.569, S.E.= 0.172, p < .001), indicating that word problems (reference group) are 1.77 times (i.e., e0.569) are easier than mathematically expressed items on average. This finding shows that the linguistic structure of a mathematics item may reduce or increase the difficulty level of the item regardless of its content and solution.
Kan & Bulut
143
Table 4: Summary of Estimates and Model Statistics of the Three Explanatory IRT Models Variables Item Type Gender Item Type * Gender
Model 1 β 0.569* -
SE 0.172 -
Model 2 β 0.648* -0.168 -
SE 0.184 0.114 -
Model 3 β 0.649* -0.167 -0.002
SE 0.185 0.116 0.053
* Significant at α=.001 In Model 2, gender was included as a person covariate. Gender was a dichotomous variable where male students were coded as 1 and female students were coded as 0. The results from Model 2showed that gender was not a significant predictor of the variation among the students (β = -0.168, S.E.= 0.114, p > .05), while item type still remained as a significant predictor of the variation in item difficulties. This finding shows that there was no significant difference between male and female students’ average performances on the test. Model 3 included the interaction of gender and item type as a person-by-item covariatein addition to item type and gender. The results indicated that the interaction between gender and item type was not a significant predictor in Model 3 (β = -0.002, S.E.= 0.053, p > .05).The estimated effect for this interaction was very small. This finding implies thatthe effect of item type did not differ between male and female students. As in Model 2, gender was not statistically significant and item typewas a statistically significant predictor in Model 3.From these findings, it was concluded that item typewas a significant predictor of the variation in item difficulties but gender and its interaction with item type did not have any impact on person abilities and item difficulties. To compare the three explanatory IRT models, AIC and BIC model fit indices were used (see Table 5). Across the three modelsused in this study, AIC and BIC fit indices provided consistent results. Based on the AIC and BICfit statistics, Model 1 showed the best fit because it has the smallest AIC and BIC values among the three models. It should be noted that although AIC did not change between Model 1 and Model 2, BIC was smaller for Model 1. Deviance statistics also support these findings. Although Model 2 and Model 3 included more predictors than Model 1, there was not a big change in deviance across the three models. With only item type as a predictor, Model 1 seems to fit the data equally well as the other two models. Table 5: Summary of Model-Fit Indices and Variances from the Three Explanatory IRT Models Variance Components Model Fit Statistics
Person Level Variance Item Level Variance AIC BIC Deviance df
Model 1 2.3413 0.6585 35193 35219 35187 3
Model 2 2.3228 0.6946 35193 35227 35185 4
Model 3 2.3229 0.6943 35195 35237 35185 5
5. Discussion and Conclusion The wording of mathematics problems may have a major influence on comprehension and students’ ability to solve the mathematics problems (Staub&Reusser, 1995). Previous research studieshave manifested the discrepancy between students’ performance on word problems, and suggested that factors other than mathematical skills contribute to success in solving word problems (Schleppegrel, 2007; Adams, 2003; Lemke, 2003).
144
Journal of Education and Human Development, Vol. 4(1), March 2015
Use of word problems or a simplified language in mathematics items as an accommodation can provide benefits to students with low language skills such as ELLs or students with certain types of learning or physical disabilities (see Abedi & Lord, 2001; Johnson & Monroe, 2004). Also, within test development process, these kinds of items are commonly used interchangeablyin mathematics assessments. However, linguistic structure of the items is usually ignored in test development although using it may favour or negatively influence some examinees. This study investigated the impact of linguistic complexity on students’ performance in a mathematics assessment. Word problems and mathematically expressed items were compared to examine whether these items can be used interchangeably in mathematics assessments. Explanatory item response modeling was used to estimate item difficulties, person abilities, and the effects of item type and gender. The results of this study indicated that word problemsseem easier than items written with mathematical expressions. Therefore, the probability of answering a mathematics item correctly seems higher if the mathematical language used in the item isnot very complex. This finding implies that mathematics items that measure the same content may function differently because of theirlinguistic complexity levels. Also, it should be noted that word problems can use relatively simple or more complex forms and the actual language used is therefore an important factor. This study focused on the use of Turkish in word problems and mathematically expressed items. Further studies could also shed more light on the use of different languages for developing word problems. A clear understanding of the impact of the linguistics factors in mathematical items can facilitate making the appropriate and adequate inferences of scores from mathematics assessments (Messick, 1995). When creating new mathematics items, it is important to check whetherthe content and difficulty levels of the itemschange depending on the linguistic complexity of the items. Adding or removing words from an item may change the way that examinees understand and interpret the item. Also, including additional verbal expressions may change the nature of the item in terms of its relationship with the underlying ability intended to be measured. Students might have difficulty in word problems even when the computation required is below the grade level (Larsen, Parker, &Trenholme, 1978; Wheeler & McNutt,1983). Some of the reasoning partially required to set up the calculation of the problem might have already been accomplished. When the magnitude of difficulty of the word problem is compared to the computational item for different student groups, this would provide insight into the relative effects of language on mathematics item comprehension for each group. Construct-irrelevant difficulty or easiness occurs when aspects of the task that are extraneous to the focal construct make the test irrelevantly more difficult or easier for some individuals or groups (Messick, 1989, p. 34). When administering a mathematics assessment to students with highly different levels of reading and mathematical abilities, using word problems may not be a good practice. Because of the compensatory nature of reading and mathematics abilities, a student can answer a word problem easily because of the student’s strong skills in reading. This situation may cause item bias or DIF against students who do not have strong reading skills. In this study, gender was not a significant predictor of the variation between item difficulties. However, further analysis (e.g., DIF) should be conducted to examine the interaction between each item and gender. The EIRM framework can be used again for DIF analysis (see De Boeck & Wilson, 2004). Learning mathematics and the language of mathematics is a challenge for all students. It is important to recognize that students need to learn to deal with the dense and technical language of mathematics (Schleppegrell, 2007). Lemke (2003) suggests that teachers should translate back and forth between the ordinary and technical language, embed the uses of mathematics in application contexts, and expose students to real out-of-school settings for use of mathematics.
Kan & Bulut
145
Instead of using word problems or mathematics items with a simplified language all the time, teacher should look for instructional ways to teach mathematical terms and concepts more effectively. Teachers should attempt to provide learning experiences to lead to acquisition of intended meaning of a mathematical term (Munro, 1979). A suggestion for teaching mathematical terms could be building pairs of items (e.g.,a word problem and a computation item) with identical computational demands. References Abedi, J.,& Lord, C. (2001).The language factor in mathematics tests.Applied Measurement in Education, 14(3), 219– 234. Adams, T. L. (2003). Reading mathematics: More than words can say. The Reading Teacher, 56(8), 786–795. Adams, R. J., & Khoo, S. T. (1996). ACER Quest [Computer software]. Melbourne, Australia: ACER. Aiken, L. R. (1972). Language factors in learning mathematics. Review of Education Research, 42, 359–385. Bates, D.,& Maechler, M. (2014).lme4: Linear mixed-effects models using S4 classes. R package.Available from http://CRAN.R-project.org/package=lme4. Briggs, D. C. (2008). Using explanatory item response models to analyze group differences in science achievement. Applied Measurement in Education, 21(2), 89-118. Bond, T. G., & Fox, C. M. (2001). Applying the Rasch model (2nd ed.). Mahwah, NJ: Lawrence Erlbaum. De Boeck, P. & Wilson, M. (2004).Explanatory item response models: A generalized linear and nonlinear approach. New York: Springer. Huynh, H., Meyer, J. P., & Gallant, D. J. (2004).Comparability of student performance between regular and oral administrations for a high-stakes mathematics test.Applied Measurement in Education,17(1), 39–57. Johnson, E., & Monroe, B. (2004). Simplified language as an accommodation onmathematics tests.Assessment for Effective Intervention, 29, 35–45. Kamata, A. (2001).Item analysis by the hierarchical generalized linear model.Journal of Educational Measurement, 38(1), 79–93. Larsen, S. C., Parker, R. M., &Trenholme, B. (1978). The effects of syntactic complexity upon arithmetic performance.Educational Studies in Mathematics, 21, 83–90. Lemke, J. L. (2003). Mathematics in the middle: Measure, picture, gesture, sign, and word. In M. Anderson, A. SaenzLudlow, S. Zellweger, & V. V. Cifarelli (Eds.), Linguistic Challenges of Mathematics 157 Educational perspectives on mathematics as semiosis: From thinking to interpreting to knowing (pp. 215–234). Brooklyn, NY, and Ottawa, Ontario: Legas. Li, Y., Cohen, A.S., & Ibarra, R.A. (2004). Characteristics of mathematics items associated with gender DIF. International Journal of Testing, 4(2), 115–136. Linacre, J. M. (2006). A User’s Guide to WINSTEPS and MINISTEP -Rasch-Model ComputerPrograms. Chicago, IL. ISBN 0-941938-03-4 (www.winsteps.com) Linville, W. J. (1970). The effects of syntax and vocabulary upon the difficulty of verbal arithmetic problems with fourth grade students. (Doctoral dissertation, Indiana University) Ann Arbor, Mich.: University Microfilms, 1970. No. 70-7957. (DA 30A: 4310) Messick, S. (1989). Validity. In R. Linn (Ed.), Educational Measurement. Washington, D.C.: American Council on Education. Messick, S. (1995).Validity of psychological assessment.American Psychologist, 50(9), 741–749. Munro, J. (1979). Language abilities and mathematics performance.Reading Teacher, 32(8), 900–915. O’Neill, K. A., & McPeek, W. M. (1993). Item and test characteristics that are associated with differential item functioning. In P. W. Holland & H. Wainer (Eds.), Differential item functioning (pp. 255–276). Hillsdale, NJ: Lawrence Erlbaum Associates. Osteen, P. (2010). An introduction to using multidimensional item response theory to assess latent factor structures.Journal of the Society for Social Work and Research, 1(2), 66–82. Pomplun, M., & Omar, H., M. (2001).Do reading passages about war provide factorially invariant scores for men and women?Applied Measurement in Education, 14(2), 171–188.
146
Journal of Education and Human Development, Vol. 4(1), March 2015
Rasch, G. (1960). Probabilistic models for some intelligence and attainment tests. Copenhagen, Denmark: Danish Institute for Educational Research. R Development Core Team (2014). R: A language and environment for statistical computing. R Foundation for Statistical Computing, Vienna, Austria. ISBN 3-900051-07-0, URL http://www.R-project.org. Rijmen, F., Tuerlinckx, F., De Boeck, P., & Kuppens, P. (2003). A nonlinear mixed model framework for item response theory. Psychological Methods, 8, 185-205. Ryan, E. K., & Chiu, S. (2001). An examination of item context effects, DIF, and gender DIF.Applied Measurement in Education, 14(1), 73–90. Schleppegrel, J. M. (2007). The Linguistic challenges of mathematics teaching and learning: A research review. Reading and Writing Quarterly, 23, 139–159. Scheuneman, J. A., &Grima, A. (1997). Characteristics of quantitative word items associated with differential performance for female and Black examinees. Applied Measurement in Education, 10, 299–320. Smith, R. M., Schumaker, R. E., & Bush, M. J. (1998). Using item mean squares to evaluate fit to the Rasch model. Journal of Outcome Measurement, 2(1), 66–78. Spanos, G., Rhodes, N. C., Dales, T. C., & Crandall, J. (1988). Linguistic features of mathematical problem solving. In R. R. Cocking & J. P. Mestre (Eds.), Linguistic and cultural influences on learning mathematics.Hillsdale, NJ: Lawrence Erlbaum Associates, Inc. Staub, F. C. &Reusser, K. (1995). The role of presentational structures in understanding and solving mathematical word problems. In C. A. Weaver, S. Mannes, & C. R. Fletcher (Eds.), Discourse comprehension (pp. 285– 305). Hillsdale, NJ: Lawrence Erlbaum Associates. Wakefield, D.V. (2000). Mathematics as a second language.The Educational Forum, 64, 272–279. Wheeler, L. J., & McNutt, G. (1983). The effects of syntax on low-achieving students’ abilities to solve mathematics word problems. Journal of Special Education, 17, 309–315.