Executing Incoherency Bounded Continuous Queries at Web Data Aggregators Rajeev Gupta1
Ashish Puri, Krithi Ramamritham
[email protected]
{ashpuri,krithi}@cse.iitb.ac.in
IBM India Research Laboratory IIT Delhi, New Delhi, India
ABSTRACT Continuous queries are used to monitor changes to time varying data and to provide results useful for online decision making. Typically a user desires to obtain the value of some function over distributed data items, for example, to determine when and whether (a) the traffic entering a highway from multiple feed roads will result in congestion in a thoroughfare or (b) the value of a stock portfolio exceeds a threshold. Using the standard Web infrastructure for these applications will increase the reach of the underlying information. But, since these queries involve data from multiple sources, with sources supporting standard HTTP (pullbased) interfaces, special query processing techniques are needed. Also, these applications often have the flexibility to tolerate some incoherency, i.e., some differences between the results reported to the user and that produced from the virtual database made up of the distributed data sources. In this paper, we develop and evaluate client-pull-based techniques for refreshing data so that the results of the queries over distributed data can be correctly reported, conforming to the limited incoherency acceptable to the users. We model as well as estimate the dynamics of the data items using a probabilistic approach based on Markov Chains. Depending on the dynamics of data we adapt the data refresh times to deliver query results with the desired coherency. The commonality of data needs of multiple queries is exploited to further reduce refresh overheads. Effectiveness of our approach is demonstrated using live sources of dynamic data: the number of refreshes it requires is (a) an order of magnitude less than what we would need if every potential update is pulled from the sources, and (b) comparable to the number of messages needed by an ideal algorithm, one that knows how to optimally refresh the data from distributed data sources. Our evaluations also bring out a very practical and attractive tradeoff property of pull based approaches, e.g., a small increase in tolerable incoherency leads to a large decrease in message overheads.
Categories and Subject Descriptors
H.3.5 [Online Information Services]: Web Based Services
1
Work was done when author was at IIT Bombay.
Copyright is held by the International World Wide Web Conference Committee (IW3C2). Distribution of these papers is limited to classroom use, and personal use by others. WWW 2005, May 10-14, 2005, Chiba, Japan. ACM 1-59593-046-9/05/0005.
Indian Institute of Technology, Bombay Mumbai, India
General Terms
Algorithms, Management, Measurement, Performance
Keywords
Online decision making, continuous queries, coherency, fidelity, Markov model.
1. INTRODUCTION
The web is becoming a universal medium for information publication and usage. Such information is becoming more and more dynamic and usage is varying from simple tracking to on line decision making in real time. Applications include auctions, personal portfolio valuations for financial decisions, route planning based on traffic information, etc. For such applications, data from one or more independent web sources may be aggregated to trigger some action. Given the increasing number of such applications of highly dynamic data, there is significant interest in systems that can efficiently monitor the required data to get the relevant updates automatically. For example, the following network monitoring query: SELECT source-department, num_packets_in_preceding_hour FROM campus_network_traffic_info
can be used to collect statistics relating to bandwidth usage by various departments in a campus. It requires continuous collection of information about data packets and their IP addresses from various routers in the campus network. A traffic policing server aggregates such information to continuously track bandwidth usage per department which can be used to generate a trigger whenever a department crosses its allocated bandwidth. Such a data aggregating server can be seen as executing a continuous query over the aggregate of data items by refreshing data from specific sources. As another example, consider a user who wants to track a portfolio of stocks, in different (brokerage) accounts. He or she might be using a third party data aggregator, such as [1], which provides a unified view of financial information of interest by periodically polling information from multiple independent sources. These queries are exemplars of a class of queries having some common characteristics: - all these queries are long running queries as data is continuously changing and user is interested in notifications when certain conditions hold. Thus, responses to these queries are refreshed continuously.
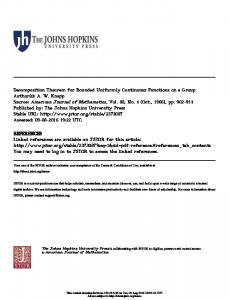
- to generate the response, aggregation of data from multiple sources is required. As a result, executing such queries at data sources may not be feasible. - users are likely to tolerate some incoherency in the results. That is, the exact data values at the corresponding data sources need not be reported as long as the query results satisfy user specified coherency requirements. For instance, for the network monitoring query, users may be satisfied with an accuracy of 100 for the num_packets_in_preceding_hour. Portfolio trackers may be happy with an accuracy of $10. Henceforth we refer to such queries as Continuous Multi-data Incoherency bounded Queries (COMIQs). Specifically, we consider queries which correspond to weighted aggregation of a number of data items, e.g., in the case of portfolio queries, the number of shares held in each stock forms the weights of the corresponding stock values. In this paper we consider the efficient execution of COMIQs at data aggregators that are positioned within the Web infrastructure. Our aim is to execute such queries using the existing web infrastructure, achieving client specified requirements and minimizing load on the network and the data sources. Figure 1 shows the typical scenario where clients want to execute continuous queries at web data aggregators. Since there queries need data from multiple sources, clients pose these queries to data aggregators (DAs) who get the desired data items from data sources and execute the queries.
1.1 Executing COMIQs at Data Aggregators
Users can specify the acceptable incoherency as one or more of temporal, value based or updates based incoherency [16]. In this paper we consider value based incoherency, that is incoherency in the value or results of a query, as we feel that the user’s requirement is more likely to be specified in value form, and further, other forms of incoherencies can be handled through much simpler approaches [25]. In such cases, a DA needs to ensure that the incoherency in the query results -- when compared to the result obtained using the precise data item values -- is maintained at or below the level desired by the client. Besides the bounded incoherency, another parameter of importance for the client is the fidelity delivered. 100% fidelity implies that client’s incoherency bound is never violated. Thus, with every aggregation query the client also specifies its corresponding incoherency bound and fidelity desired. Section 1.2 makes these notions more precise. The required data updates for query evaluation at a DA can be obtained either by sources pushing them continuously or the DA pulling them whenever required. In both these cases, it is desired that client’s coherency and fidelity requirements are met with the minimum number of data value refresh messages. Thus efficiency of query evaluation at the DA is quantified in terms of the number of refreshes done for various data items involved in the queries executing at the DA. Reducing the number of refreshes reduces computational overheads at the DA, load on the data servers and network bandwidth. Since data sources have exact data values, we can expect that a push based approach can deliver the required bounded incoherency with the given fidelity using a smaller number of refresh messages. Push capable sources can efficiently filter data based on client requirements. But push based
approaches have a few disadvantages: (1) every update to data values needs to be checked for push by the data sources, (2) any push based scheme requires continuously open network connection to clients, thereby affecting the scalability of a push based solution, (3) they need sophisticated handling when multiple sources are involved [6], and finally, (4) recent practical attempts at adding push capabilities into the web infrastructure have not been very successful for a variety of reasons [2]. For web based data sources, the pull based approach is very attractive since it does not require any modification to existing web servers and the standard HTTP protocol can be used by DAs to pull data from the data sources. However, a key challenge in any pull based scheme is to ensure that the data items are refreshed carefully by the DA so that user requirements are satisfied with minimum number of data refreshes. This paper addresses this challenge by developing and evaluating mechanisms through which continuous queries can be answered efficiently using pull based approaches. In the rest of this section we give a mathematical formation for the problem and then provide an overview of the solution.
Source 1
Source n
Source 2
Data refresh Data Aggregator
Aggregation Queries Clients
Figure 1: Query execution at data aggregators
1.2 Mathematical Formulation
A COMIQ q is a function of a set of data items Dq , their associated weights Wq , tolerable incoherency Bq and fidelity desired f q for the query results. Every data item i ∈ Dq may have its value (di) at a DA, different from its value (si) at its source. Let
wiq be the weight associated with the data item. Formally, value of a COMIQ is a function of Dq and Wq where the function could be SUM, MIN, MAX, AVG, etc. In this paper, we focus on SUM queries as these are likely to be more common in practice, as exemplified by portfolio and traffic aggregation queries. In a SUM query, value of COMIQ q involving nq data items, at time t, is given by Vs q (t ) =
i = nq i =1
si (t ) × wiq
(1)
This is the value of COMIQ in the idealized case if all the data values can be made available immediately at the DA. In practice, the value of data item known at a DA may be different from that at the source. The last known value of the ith data item at a DA, is di. Thus the value of COMIQ q at the DA is
Vd q (t ) =
i = nq i =1
d i (t ) × wiq
(2)
The key problem is to make the di’s track the si’s close enough at time t so that COMIQ’s incoherency is within the user specified incoherency bound:
E q(t) = | Vs q(t) − Vd q(t)| ≤ B q
(3)
i.e., the value of the COMIQ at a DA (Equation (2)) should not diverge from that at data sources (Equation (1)) by more than the client specified incoherency bound Bq. To this end, DA must pull data items intelligently from data sources. Upon receiving a data request for ith data from DA, the data source responds with the latest value si of the data. With the latest data value (di = si), DA re-computes the query and sends the query result to the client if warranted, i.e., if the difference between the query result last reported to the client and the latest result exceeds Bq. Fidelity fq is the measure indicating the degree to which the DA should satisfy Equation (3). We can define fidelity as follows. At be 1 if the coherency requirement is met time t, let I q E (t ) ≤ B q for a query q having incoherency bound Bq, that is, E q (t ) ≤ B q , and 0 otherwise. Then t
f B q (t ) =
1 I q ( y ) dy t {E ( y ) ≤ B }
(4)
0
gives the fraction of time when the query coherency requirement is met by a DA. We define fidelity achieved f = lim t → ∞ f B q (t ) to be the limiting average. In practice, fidelity is averaged over a long time window of several hours. Thus the problem is to deliver the query results with bounded incoherency and user specified fidelity requirements, i.e., f ≥ fq.
1.3 Summary of Contributions
In practice, for keeping track of dynamic data, web based applications pull the data periodically. For example, various sports sites use applets to refresh scores periodically [3]. This approach does not take into account the specific needs of clients or the dynamics of data, leading to (a) high communication overheads and large load on servers in case the period is small or (b) low fidelity in case the period is large. A better approach will not only take the relative importance of the data into account but also adapt itself to the data dynamics. We now state three key observations and show how they lead to such an approach.
item is changing rapidly, there may be no need to follow that change. In other words, DA needs to be aware of only those updates to the data items which may lead to COMIQ’s incoherency crossing the user specified bound. Observation 3: Data refreshes can be optimized across multiple COMIQs. Among various queries executing at a DA, a data item may be involved in more than one COMIQ. Thus when a data item is refreshed for one COMIQ, it can be used for other queries that involve the refreshed data item. This can be used to postpone the pulls of other data needed by these queries. Intuitively, if a data item affects more COMIQs, it should be given priority when decisions are made as to which data items to pull.
1.3.2 Overview of Solution
First we list the sub-problems that need to be solved. (a) For answering COMIQs at a DA, data items involved in queries are required to be pulled. When should we pull a data item so that user specified coherency and fidelity requirements are satisfied with minimum number of pulls? Data items are pulled when it is estimated that one or more queries have violated their incoherency bounds. To estimate the results of a query, we need to estimate the current values for the data items involved in the query. We give a procedure to track the dynamics of data so that we can predict the data values. (b) User requirements are query specific so we need not pull all the data items involved in a query. How can we identify the subset of data items to be pulled? In our scheme only those data items are pulled whose up-to-date values are deemed to be needed to handle the incoherency bound violation of the queries. (c) Since the previous two decisions are based on estimates, how can a user specified fidelity be delivered? Given the dynamic nature of data, and the fact that we are using a pull based mechanism based on data prediction, it is necessary to be adaptive in the decision making. We use a feedback based mechanism for achieving client specified fidelity. Based on the observations and issues outlined above, we solve the problem of answering COMIQs efficiently at a DA using an approach whose ingredients are: •
1.3.1 Key Observations
Observation 1: Typical dynamic data display trends in quantum, speed and direction of change; which can be learned and used for adaptive decision making. By refreshing fast changing data at higher rates and slow changing data at lower rates, we can maintain coherency of the query results while reducing server and network overheads. Observation 2: User needs are query specific, not data specific. A user is interested in a COMIQ’s results being within bounded incoherency and not in the exact values of data items. Hence, as long as the DA satisfies coherency requirements, even if a data
The dynamics of the data is modeled using a Markov chain based method. As per observation 1, data values display trends which can be used to estimate changes in the data item values in a given time interval. We predict drift in data values using Markov chains. For estimating the effects of external factors, which are not captured by the Markov chain, we add a diffusion component to the drift component. These estimated data values are used for estimating the query results. The query result estimates are used for deciding when to pull specific data items so that user specified incoherency and fidelity requirements are met. Details are provided in Section 2.
•
Decision about which data items to refresh are taken after considering the impact of estimated data values on query coherency. We selectively refresh data items so that the number of refreshes can be minimized. We show that an optimal selection of data items to refresh is
NP-hard and hence develop heuristics which are shown through experiments to be very effective. We compare the performance of our heuristics among themselves and with a baseline. Details are in Section 3. •
•
Given the user specified incoherency bound and fidelity requirements, we propose a feedback based mechanism to adaptively set the actual incoherency bound to be used in Equation (3). We set the incoherency bound based on the fidelity desired by the client and the fidelity delivered so far by the DA. Details are discussed in Section 4. For the Markov model and the feedback based mechanism we use the refreshed data values to estimate the missing updates (i.e., updates that occur between two pull instances). So, we compare the performance with the case where the data source sends all the missed updates of the data items whenever DA pulls a data item from the source. Our performance evaluation indicates a surprising result: there is very little to be gained by using (exact) missed values. Details follow in Section 5.
Thus, this paper addresses an important issue in executing aggregate queries over multiple web based data items without a need for any additional infrastructure beyond the standard pull based client infrastructure. The performance of our solution is shown by using real world dynamic data traces to be very effective in handling COMIQs. Related work is discussed in Section 6. The paper concludes in Section 7.
2. MODELING THE DYNAMICS OF DATA
Probabilistic models are used for modeling random stochastic processes. A Markov chain models a random process in which a certain future state is dependent only on the current state or the last few states immediately preceding the current state. We can model dynamic data using a Markov model by learning its generating process. This is devised in Section 2.1. As dynamic data show trends, we can follow these trends to predict future values; e.g., if there is upward trend in temperature values then the probability of going further up is higher than that of going down. This feature can be captured by modeling data as if they are being generated using Markov chains. We use Discrete Time Markov Chains (DTMC) to model the data dynamics and use the modeled dynamics as shown in Section 2.2 to predict the most probable value of data after a given time interval. To take into account external factors which are not captured by the Markov chain we add a diffusion term, explained in Section 2.3, to the prediction made by the DTMC to get the predicted data value.
2.1 Modeling Data Dynamics Using Markov Model
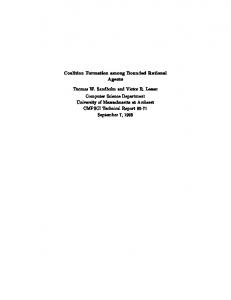
A Markov model is characterized by a set of states and their transition probabilities. We associate change in data value between consecutive ticks as the distinguishing factor for the Markov states. For a Markov chain with a certain number of states, the data change associated with a state is uniformly chosen to predict changes of different magnitudes and direction (positive or negative). The number of Markov states for a data item depends on how closely the DA needs to monitor a data item. Figure 2 shows a typical Markov model used for modeling data
change behavior with five states corresponding to five different data value changes per tick (to avoid clutter we have not shown self transitions). Formally, let t1, t2, t3… denote consecutive periodic ticks. If the predicted value of data item at t1 is d and the Markov model is in a state corresponding to nδ, then predicted value at t2 will be d + nδ and subsequently if the chain transits to state corresponding to − δ, then predicted value at t3 will be d+ nδ− δ. p42 p21
p10
0
-δ
-2δ
p43
p32
p12 p01
+2δ
+δ
p23
p34
p02
Figure 2: A typical Markov model We create a DTMC for each of the data items involved in the continuous queries at a DA. Transition probabilities between various states of the model are determined using past observations of changes to data values. As more and more data is pulled, these transition probabilities are readjusted based on previous transition probabilities and current observations. We keep transition counters C(i,j) from each state i to every other state j in the DTMC. After each pull we add transition counts for two entries. If a data item is pulled after m time ticks, we assume that the data value has changed uniformly between the last pulled value and the current value. We calculate change per unit time and transition counters are updated assuming that there was one transition from the previous state to new state and (m-1) self transitions for the new state. Thus, if the previous state was x and state corresponding to average data change per interval since last pull is y, we increase the count C(x,y) by 1 and C(y,y) by (m-1). Since we are not pulling after every possible update at the data source, does the missing information have a negative impact on the effectiveness of the algorithm? Our performance results in Section 5 indicate that this is not the case. The transition probabilities are calculated from transition-counters using,
p ( x, y ) =
C ( x, y ) C ( x, y )
(5)
∀y
We use these transition probabilities when we need to predict the data value at future time instances.
2.2 Estimating Future Changes in Data Values and Query Results
We need to refresh data items involved in a query whenever the condition specified by Equation (3) is violated. But, for checking that condition we need the values of data items at the source, which we have only when we pull from the sources. Thus, instead of value of the data items at the source we use the predicated
values of the data items. For the sack of simplicity, we assume that values of two different data items are not correlated. We need to predict data values at the sources between consecutive pulls to make the pulling decision. To predict the quantum of change in a data item value, at every tick, the DTMC for that item is “executed”, i.e., a state transition is taken based on probabilities given by Equation (5). Suppose we last pulled the data at time ti and value of data at that time was s(ti). We set d(ti) as the pulled value s(ti). Now if any time tk the model reaches the state z via states x, y…z, at times ti, ti+1, ti+2…tk respectively. Then the estimated value of the data item at tk ,is d(ti)+v(x)+v(y)+….+v(z), where function v maps a state to the corresponding change in the data values (in Figure 2, v(0)= −2δ, v(1)= − δ,v(2)=0, etc.). We denote the data incoherency predicted for ith data item at time tk by PCik. Thus PCik = v(x)+ v(y)+….+v(z). At each time unit, incoherency in the data items is predicted and successive changes since the last pull of a data item are accumulated to estimate the change from the last pulled value. Incoherency of a COMIQ is the weighted sum of incoherency of the data items involved in that COMIQ. Thus, at each time tick tk for every query q, the incoherency predicted by the model can be calculated using: Incoherency q (k ) =
nq i =1
( PCik × wiq )
(6)
Here PCik is the change predicted by the data model for the ith data item at the kth time instance and wiq is the weight of ith data item for the query q, which refers to nq data items. Thus query incoherency can be written as the weighted sum of data incoherencies. At any time tk if the query incoherency for a query exceeds the user incoherency bound B q , the constituent data items are candidates for pulling. In Section 3, we explain how we can reduce the system overhead by judiciously pulling only a subset of the candidate data items. However, in order to limit the staleness of data items at DA, each data item is pulled at least once every TTRMAX (maximum time to refresh).
2.3 Accounting for the Effects of External Factors
We employ a technique called self correction to learn from the effect of past estimations. In the last section we showed how to predict data item values using Markov chain transitions. To take into account external factors which are not captured by the Markov chain we calculate a diffusion component of the data value change [4]. A diffusion component dXij is added to the drift component estimated using Markov model to get the estimated data value for the ith data item between jth and (j+1)th pull. In general, diffusion component is modeled as a running average of data change due to external factors. Assuming jth pull of ith data item occurred at time tk and (j+1)th pull at time tl. Suppose at tl , predicted change was PCil, and the actual change was ACil (based on the current and last pulled values). We calculate the self correction term as, dX i , j +1
L × ( ACil − PCil ) = + (1 − L) × dX ij tl − t k
(7)
In this equation, the first term is the contribution of the average unexpected change over the last pull interval. The second term is to take an exponentially smoothed value of data change due to
external factors, using smoothing constant L(0 ≤ L ≤ 1) . This diffusion component is added to the drift component estimated using the Markov model till the next pull instance, i.e., for each tick h between jth and (j+1)th pull, PCih = PCih + dX ij
(8)
This modified value of PCih is used for predicting query incoherency (Equation (6)) and refresh times as explained in the previous section. As we shall show, the Markov model along with self correction serves as a good starting point to model dynamics of data and is able to deliver at least 90% fidelity. The additional algorithm components, discussed in subsequent sections help deliver user specified fidelity at reduced refresh costs.
3. CHOOSING DATA ITEMS TO BE REFRESHED
As discussed so far, individual data items are modeled using a probabilistic model with self correction and the data items are pulled whenever the estimated query incoherency given by Equation (6) exceeds the query incoherency bound Bq. When a query incoherency crosses its bound, a simple approach could be to pull all the data items needed to compute a COMIQ’s result. But as noted in Observation 2 (Section 1.3), users are not interested in coherent data values rather they are concerned with coherent query results. Pulling all the data items can lead to wastage of network and server resources. There might be some data items which are changing very fast or have more weight (thus have a large contribution to query’s incoherency) compared to other data items which are changing slowly or have very low weight (thus have insignificant impact on the overall query results). Obviously, fast changing data items and ones having large weight should be pulled more often to keep the query result within the user specified incoherency bound. We can formulate the problem, of selecting data items for refreshing, as an optimization problem. In this paper we assume that all data items incur the same network and server overheads for refresh. Thus, we need to minimize the number of data items to pull for minimizing the network overheads. Extending the problem for varying overheads is the subject of our future research.
3.1 Optimizing Pulls is NP-hard
The problem of selecting data items to pull can be explained using Equation (6): if a query has incoherency which is more than the user specified bound, we need to pull enough data items so that query incoherency is below the user specified bound. Thus, we need to satisfy a set of equations of the form nq i =1
PCik × wiq ≤ B q , ∀q ∈ Q
(9)
for all queries being executed at a DA. Here nq is the number of data items appearing in a query q ∈ Q being executed at the DA. Such a set of equations is there for each time tick tk. Of the queries in the set Q, for selective refresh, we need to consider only those queries whose incoherency bounds are violated i.e, for these queries Equation (9) does not hold. Let such set be Q '⊆ Q . All data items involved in these queries are candidates for pulling. Let
the queries in set Q ' have in total m data items. We need to pull some of these m data items. We represent the decision to pull the ith data item by xi such that xi is 0 if the data item needs to be pulled and 1 otherwise. The problem of deciding which data items to be pulled can be represented as finding values of xi ∈ {0,1},1 ≤ i ≤ m ,
max nq i =1
xi
s.t.
1≤i ≤ m
PCik × wiq × xi ≤ B q , ∀q ∈ Q ',1 ≤ i ≤ m
(10)
The optimizing condition represents the fact that we want to pull as few data items as possible and the constraints that the query incoherency should be less than the user specified incoherency bound. Thus, we need to satisfy a set of equations given by Equation (9) while making as few xi as 0 as possible. If a data item does not appear in a query we set that weight as 0. It should be noted that if all xi’s are 1, then Equation (9) is violated for all q
∈ Q '. We pull the data items whose xi is 0, and, by pulling we remove their contribution to the query incoherency. Any {0,1} integer programming problem can be mapped to the problem depicted by Equation (10), where minimizing number of pulls leads to optimization in the integer programming problem. Thus, the problem depicted by Equation (10) is NP-hard [25]. In general, there is no known approximate algorithm for such a problem. Using an algorithm like branch and bound is too inefficient for these real time decisions. Thus we have devised heuristic algorithms to solve the problem. In the rest of this section, we examine the algorithms for selecting data items to refresh. We first consider the case of a single query, being executed independently at a DA. Next we consider multiCOMIQ case in which a DA needs to execute COMIQs with overlapping data items.
3.2 Base Case: Single COMIQ
For optimizing the number of pulls, we need to pull data items such that query incoherency is within the user specified bound. From Equation (10), it is clear that for reducing the number of pulls, we should be pulling data items having higher weight ( wiq ) or higher predicted incoherency (PCik) or both. We examine several approaches to solve the problem of selective refresh. First we treat each data item separately by dividing query incoherency bound (Bq) among data items involved in that query. If we divide the query incoherency bound such that any violation of individual data incoherency bounds may lead to violation of the query incoherency bound, we need to pull data items whenever their estimated data incoherency crosses their individual incoherency bounds. Such approaches have been used in literature [6]. We devise one such approach, called data incoherency algorithm, to compare with our query incoherency algorithms. In this algorithm query incoherency bound is mapped to data incoherency bounds based on the weights of various data items. For the query given by Equation (2), incoherency bound of ith data item is calculated as follows:
n
Biq
=
wqj − wiq
j =1
n
wqj j =1
×
Bq wiq
× (nq − 1)
(11)
where nq is the number of data items in the query and Biq is the incoherency bound of the ith data item involved in query q. In this approach a data item having more weight is assigned low incoherency bound, thus, the data item is likely to be pulled more often. In the rest of this section, we use the query incoherency bound directly to find data refresh intervals (without mapping query incoherency bound to data incoherency bounds). We devise two heuristic algorithms to solve the problem: positive-negative algorithm and max algorithm, which we describe in following subsections. Through performance results we show that this approach, of not dividing query incoherency among individual data item incoherencies, is more efficient compared to data incoherency based approaches. Although in this subsection we focus on a single COMIQ case, our approach also applies to the multiple COMIQ cases where the sets of data items involved in various queries are disjoint. Thus, in such cases, we can treat each query independent of the others. The case where data items of multiple queries intersect is discussed in Section 3.3.
3.2.1 Positive−Negative Algorithm
The query incoherency, given by Equation (6), can be represented as the absolute difference between weighted incoherency of the data items having positive incoherency (PCik > 0) and that having negative incoherency (PCik < 0). Intuitively, it appears that if we pull data items from both sets they may nullify the effects of each other with no improvement in coherency. This observation underlies the design of the positivenegative algorithm: To reduce query incoherency, it just pulls either data items with positive incoherency or data items with negative incoherency, the former in case the query incoherency is positive, the latter otherwise. Figure 3 gives the pseudo code for the algorithm. In this figure, “incoherency” refers to query incoherency while PCik refers to the predicted incoherency of the individual data items. In this algorithm, we segregate the data items among ones estimated to have a positive incoherency (PCik > 0) and another having negative incoherency (PCik < 0). We pull a data item from the set having higher total weighed incoherency. Further, from the selected set we pull a data item having maximum absolute weighted incoherency which is less than the estimated incoherency of the query. If there is no such data item, we pull all the data items of that set. For example, consider a query with four data items (Di, i=1,2,3,4) with an incoherency bound of 200. Let the estimated weighted coherencies wiq × PCik of data items at some time tk be 500, 75, −200, and −150, respectively. The query incoherency is 225 which is greater than the incoherency bound, thus we need to pull one or more data items. Since query incoherency is positive, we should be pulling data items having positive weighted incoherency. Thus, we need to pull data item D1 or D2 or both. As
per the algorithm, we will pull the data item D2. It can be seen that if we pull D1, query incoherency will be minus 275, whose absolute value is more that the incoherency bound and hence will not help in handling the violation of the bound. So, we should pull the data item whose incoherency is less than the query incoherency. pset = set of positive PCik for certain tk nset = set of negative PCik for certain tk psum = sum of all wi*PCik in pset nsum = sum of all wi*|PCik| in nset while(incoherency > Bq) if( psum > nsum) if((p∈ pset)&( wp*PCpk < incoherency) & (p: wp*PCpk = max(wi*PCik , ∀i )) pull data item p; incoherency −= wp*PCpk if there is no such data item, pull all data items from pset else if((n∈nset)&(wn*PCnk< incoherency) & (n: wn*PCnk = min(wi*PCik , ∀i )) pull data item n; incoherency += wn*PCnk if there is no such data item, pull all data items from nset
Figure 3: Positive-negative algorithm for single COMIQ case
We constructed COMIQs with each query having between 2 to 8 stocks uniformly distributed. Weights, representing the number of stocks held in a particular portfolio query, were assigned to stocks uniformly distributing them between 4000 and 5000. As weights of various data items in a query are not very dissimilar so deciding on which data item to pull is non-trivial. Stocks involved in a portfolio query were selected using Zipf distribution. We rank the data items with index i=1,2,3,…,N. Number of queries in which ith 1 data item appears is made proportional to α . We choose i number of data items N as 20 and α as 0.9. For example, a portfolio query with four stocks can be written as: 4234S IBM + 4780S MSFT + 4004SOracle + 4500SCBUK Experiments were performed with various values of incoherency bounds ranging from $1800 to $5400; for incoherency bound $2400, the portfolio query was evaluated at DA such that the difference between value of the query at DA and the actual value of the query (assuming all the data items are available without any delay) was atmost, $2400. These values of incoherency bounds correspond to 0.1% to 0.3% of the average portfolio values. In all these runs required fidelity was 98%. As mentioned in Section 1.3, we are using a feedback based mechanism to ensure that delivered fidelity is more than the required fidelity. In Section 4, we describe the mechanism in detail. We use number of pulls to meet coherency and fidelity requirements as the cost criterion.
Table 1. Some of the stock traces used for experiments
3.2.2 Max Algorithm
In the max-algorithm we use a greedy approach of pulling the data items which have the high absolute weighted incoherency. Specifically, we calculate
http://finance.yahoo.com. Trace for each stock consisted of 3000 values, so if a DA desired to track changes on each tick it has to perform 3000 refreshes per data item. Table 1 shows the stocks used and their typical values in USD.
wiq × PCik
for all the data items
involved in the query. We get the data item with the maximum absolute weighted incoherency. Then we pull all the data items whose pulling will reduce incoherency by PULLRATIO multiplied by max weighted incoherency, i.e., all the data items with absolute weighted incoherency > |PULLRATIO × max weighted incoherency| are pulled. This ensures that data items which are changing the query result in a significant way are pulled. In the example enumerated in Section 3.2.1, D1 has the maximum absolute value of weighted incoherency of 500. For PULLRATIO=0.8, we will be all the data items having absolute weighted incoherency of 400 or more. Thus, we will be pulling only D1. It should be noted that while in positive-negative algorithm we pull enough data items at each tick to maintain query incoherency within the user specified incoherency bound; in max-algorithm we just pull the data items with high incoherencies. We now compare the performance of these approaches before moving to the multiCOMIQ case.
3.2.3 Performance Comparison of Algorithms
For performance measurements, we use portfolio queries using 20 different stock items. A sequence of data values, corresponding to each stock price was constructed through repeated polling of
Stock ABC Cisco CBUK Dell Intel Microsoft Oracle UTSI Veritas
Date Jun 2 Jun 6 Jun 2 Jun 1 Jun 2 Jun 8 Jun 7 Jun 1 Jun 8
Max Value 135.75 65.00 8.625 43.75 134.50 69.62 79.37 22.25 137.0
Min Value 134.5 63.06 8.25 42.87 132.50 68.07 76.62 21.00 133.50
Avg Value 135.14 63.97 8.50 43.43 133.46 69.04 78.57 21.73 134.85
Figure 4 shows the number of refresh messages for three algorithms described in this section with query incoherency bounds varying between $2400 and $5400. For the max-algorithm we set the PULLRATIO to 0.8. Max-algorithm works best among these three algorithms from network and server overhead point of view. In general, the case where query incoherency is divided among data inconsistencies, we require more number of refreshes. This can be explained by the observation that by treating various data items separately we are ignoring interplay to data item values in maintaining query coherency. Specifically, in the data incoherency algorithm a data item is pulled assuming that all other data items have also violated their incoherency bounds. These lead to more than the required number of pulls. The max algorithm performs better than positive-negative algorithm as it
does not try to maintain query coherency at every time instance. Although the positive-negative algorithm tries to maintain query incoherency within bounds, it also tries to keep query incoherency in the same direction, i.e., if query incoherency is positive then the algorithm tries to keep it positive. Thus if query value is following some trend (due to trend in data values), it is again likely to cross the incoherency bound soon leading to further pulls. Given the superior performance of the max algorithm we show how to extend it to the multiple COMIQ case in the next section.
and 98%. The query incoherency bound is varied between $1800 and $5400. It shows that one has to pay more than proportional cost for tighter incoherency bound and fidelity requirements. Achieving higher fidelity, with the tighter coherency, results in exponential increase in network overhead. For higher value of incoherency bound number of pulls increase very slowly with the fidelity desired, but for tighter incoherency bound number of pulls is a strong function of the fidelity desired.
Figure 5: Tradeoff of incoherency bound, fidelity and number of pulls Figure 4: Comparison of algorithms for single COMIQ case
3.3 General Case: Multiple COMIQs
In the multiple COMIQs case we are considering the situation where a data item is involved in multiple queries. We need to make pulling decision considering all the data items involved in all the queries being executed at a DA. We pull a data item more often if it affects the coherency of a large number of queries: its weight in various queries is high or its estimated incoherency is high. We extended the heuristic of max-algorithm for this case by aggregating the contribution of a data item to all the queries in which that data item appears. Formally, overall weighted incoherency of a data item di, across all queries, can be estimated by the quantity (
wiq ) × PCik , where queries in Qi refer to the
q∈Qi
data item di. We find the data item having maximum of aggregated absolute weighted incoherency. At every time tick, if there is any inconsistent query, we pull the data items whose weighted incoherency is greater than the PULLRATIO multiplied by the maximum aggregated weighted incoherency, i.e.,
|(
wiq ) × PCik | > PULLRATIO × max ( | (
q∈Qi
i
wiq ) × PCik | )
q∈Qi
(12)
3.3.1 Performance of Multi-COMIQ Algorithm
We use 500 portfolio queries for measuring the performance of the max-algorithm in the multi-COMIQ case. The queries were generated as described in the Section 3.2.3. Figure 5 shows the number of refresh messages required by the max-algorithm in the multi-COMIQ case for varying client coherency and fidelity requirements. The total number of pulls for all the data items is shown in the figure. The required fidelity is varied between 90%
3.3.2 Comparison with an Ideal Push Algorithm
We compare our algorithm for multi-COMIQ case with an ideal push case. In the ideal (hypothetical) push algorithm, a single source is assumed to have all the data item values without any extra cost. The source having all the data items checks whether all the queries satisfy user coherency requirements. For any query q, if incoherency bound is violated, the source pushes data items referred to by the query in question, any changed data pushed for one query is used for the other queries at a DA. This gives the minimum number of messages required to maintain all the query results within the user specified incoherency bounds. Figure 6 plots the ratio of the number of messages needed by our algorithm and that by the push algorithm. We consider various incoherency bounds between $1800 and $5400. Desired fidelity of 99% is considered for our pull based algorithm as it is almost same as 100% fidelity ensured by the push based algorithm. The figure shows that for very stringent incoherency requirement of $1800, which is less than 0.1% of the average total query result, the number of pulls required by our algorithm is around five times the minimum number of messages required by the idealized push algorithm. As incoherency bound increases to $5400, the ratio drops to 2.5. Another point to note by comparing Figures 5 and 6 is that while the number of pull messages increases fast with tighter coherency bounds, ratio of pull messages to push messages increases more gradually: As we decrease the incoherency bound from $5400 to $2400, the number of pull messages increases by a factor of 5.3 but ratio of pull messages to push messages increases by only 1.88. It happens because tighter incoherency bound leads to more than proportional increase not only in the pull based algorithm but also in the idealized push algorithm.
the fidelity achieved as a function of sf for different incoherency bounds. Low values of sf give high fidelity. For example, at sf=1.25, for incoherency bound of 3000, we achieve 93% fidelity but for sf=1 fidelity increases to 96%. Fidelity decreases slowly with safety factor for large incoherency bounds as sf × B q gets rarely violated and time to pull is largely governed by TTRMAX. As we pull at least once every TTRMAX, the fidelity will not decrease after a certain value. But in Figure 7, we are more interested in the top-left part of curve as client’s desired fidelity is more likely to be above 95%. We will use that part of the curve to adjust sf based on client’s desired fidelity. Note that sf = 1 corresponds to the case of not employing any safety factor, that is, just using the Markovian Data model based tracking. Figure 7 shows that although we can achieve a fidelity more than 92% just by the data model, for achieving the client specified fidelity we need to adapt sf, that is, adjust the incoherency bound that the system should attempt to maintain.
Figure 6: Comparison of multi-COMIQ pull algorithm with idealized push algorithm All these performance results showed various features of our algorithm. It showed that even if the desired fidelity is close to 100%, DA need not pull all the data values. For 98% fidelity and reasonably stringent coherency requirement (0.13% of average query value corresponding to incoherency bound of $3000 in Figure 5), DA pulled around 400 values per data item which is an order of magnitude smaller than 3000 potential update instances. Another important feature is that there is an exponential drop in the number of refreshes with decrease in either fidelity desired or the incoherency bound.
4. ACHIEVING FIDELITY THROUGH FEEDBACK
Now we present our feedback mechanism to ensure that client is delivered a particular fidelity. We monitor the fidelity delivered thus far and adjust the model to deliver the desired fidelity. If the user specified incoherency bound is B q , then the algorithms described in the previous sections are fed with the incoherency bound of B q × sf , where sf (safety factor) is the parameter to control the delivered fidelity. During the query execution, value of sf is a function of fidelity required to be delivered to the client and fidelity delivered thus far. A value of sf less than 1 indicates that the incoherency bound that the pull algorithm should ensure is smaller than that specified by the user. The idea is that even if some of the future predictions lead to larger incoherency (due to the probabilistic nature of model or external factors), because a tighter incoherency bound is demanded, the system is more likely to deliver B q with the required fidelity. Clearly, different sf values will result in different fidelity values for a client query. In Section 4.1 we consider the effects of a particular value of sf on the delivered fidelity whereas in Section 4.2 we present an adaptive approach which continuously adapts sf to deliver the required fidelity fq.
4.1 Effects of Fixed Safety Factor Values
We measure the effect of the safety factor on delivered fidelity using simulation experiments. For these experiments, we use the portfolio queries as described in Section 3.2.3. Figure 7 shows
Figure 7: Fidelity with different safety factors
4.2 Adaptive Safety Factor
From the previous section it is clear that relationship between the safety factor and the delivered fidelity depends on various other factors like incoherency bound and data dynamics. Thus it is very difficult to predict a fixed sf value to deliver a given fidelity. In practical settings, in order to deliver a particular fidelity, sf needs to be dynamically modified depending on the fidelity delivered thus far and the dynamics of the data. We increase sf when the delivered fidelity is greater than the desired fidelity and decrease it when the reverse is the case. Let us denote the difference between actual delivered fidelity and desired fidelity by FD (fidelity difference). From Figure 7, it can be seen that in the areas of interest (high fidelity regions on the top left), to attain a given fidelity, the safety factor needs to be an exponential function of FD. Thus:
FD = Delivered fidelity - Desired fidelity sf = sf × eγ × FD
(13)
Thus we decrease sf if FD is negative (i.e., fidelity delivered so far is less than the desired fidelity), which leads to the tighter incoherency bound which, in turn, brings delivered fidelity closer
to the desired fidelity. The sf adjustment is done at regular intervals of 200 ticks. For fidelity calculation (Equations (3) and (4)) we need the actual values of data items at all the ticks. Since we have the actual data values only at the data pull instances, we do linear interpolation of data values for fidelity calculations. In particular, after every pull we assume the intermediate data values as linear interpolation of two values. We use those values along with the known value of data items (last pulled value) at DA to calculate fidelity using Equations (3) and (4). In Section 5, we show that estimated fidelity, and sf, is almost the same as what it would have been if we had taken the updates that occur at the source between two pulls for its calculation. Gamma (γ) is the adjustment factor which decides the effectiveness of the sf adjustments in delivering the desired fidelity. After initialization of γ (