EXECUTION-DRIVEN SIMULATION OF NON-FUNCTIONAL PROPERTIES OF SOFTWARE Antti P. Miettinen Nokia Research Center email:
[email protected]
Vesa Hirvisalo Aalto University email:
[email protected]
Jussi Knuuttila Aalto University email:
[email protected]
KEYWORDS Simulation, Software Development, Performance Engineering ABSTRACT We present our evaluation of a simulation mechanism for understanding non-functional properties of computer software. Considering the prevalence of computer-based appliances, such as mobile hand-held devices, it is important for software to have high performance and energy-efficiency. Understanding the timing of software execution is essential for estimating such non-functional properties of software. The traditional way of simulating the timing behavior is based on cycle-accurate computer hardware simulators. Such simulators are orders of magnitude slower than real hardware, and thus unsuitable for software developers. Our simulation methodology is based on executiondriven simulation. We use a novel approach to bind simulation models together with dynamic binary translation of target software. Our experimentation with a production-quality simulator, QEMU, shows that reasonable simulation times and accuracy can be achieved by using this method. INTRODUCTION The non-functional properties of software are usually addressed relatively late in the product development cycle. The focus of the conventional edit-compile-debug cycle of software development is the functionality of the software. Addressing performance and power consumption is especially challenging in cross-development setups typical for software targeting mobile hand-held devices and embedded systems. Cross-development environments often employ functional simulators for interactive development and debugging of software. High simulation speed is essential in these setups as rapid feedback is critical for the productivity of the software development. However, the use of functional simulators makes it very challenging to optimize the non-functional properties of software. In fact,
relying on simulation time on the development host as an indication of performance of the software on a real target device can be severely misleading. In order to effectively provide feedback about the nonfunctional properties of software during the natural development cycle, the simulators used for software development should be able to estimate the timing of software execution. However, traditional timed simulation techniques are unsuitable for interactive software development and debugging because of the high overhead of such simulation. In our approach, we have enhanced a fast functional simulator with parametrized models that enable estimating the timing of software execution with varying degrees of accuracy. The parametrized models operate at a sufficiently high level of abstraction to allow maintaining high simulation speed. Parametrization allows calibrating the models with measurements from real hardware platforms or cycle accurate simulators to provide timing estimates sufficiently accurate to guide developer design decisions during early phases of software development. The approach is flexible as it allows a trade off between accuracy and simulation speed and thus enables the developer to switch between faster less accurate simulation and slower more accurate simulation as required. The rest of the paper is organized as follows. In the following section we review the state of the art of the related research. We then describe our simulation methodology followed by a section providing details of our experimental setting and a section summarizing our results. We then discuss the results and finally end our paper with our conclusions. STATE OF THE ART Understanding the timing of the execution of software is important, even for non-real-time applications. Many other non-functional properties can be estimated if the timing of the execution is known (Miettinen and Hirvisalo 2009). Importantly for many modern appliances, such as cell phones, laptops, etc., such derived properties include power and energy consumed. The traditional way of simulating the timing behavior is
based on instruction set simulators (Burger and Austin 1997). They are used by computer hardware developers to understand the design space, act as reference models, aids to verification, etc. Computer software developers also use instruction set simulators, but much faster ones with very limited simulation capabilities. Such simulators are called functional simulators or emulators. Given these widely different applications, instruction set simulators have a wide spectrum of capabilities and underlying implementation techniques. Accuracy of simulation models range from very accurate gate-level simulators (with accurate timing information) to functional simulators without any model of the computer hardware micro-architecture (with no timing information). Similarly, the speed of simulation has a wide range. Proper cycle accurate simulators are typically at least 4 orders of magnitude slower than the actual hardware, whereas purely functional simulators can almost reach the speed of the actual hardware (Topham and Jones 2007, Weber et al. 2004). The slowness of cycle-accurate simulators makes them unsuitable for software development, because reasonably sized programs cannot be run on them using the edit-compile-debug cycles typical for software development. Purely functional simulators are fast enough for software development, but provide no information on non-functional properties of software. Recently, this has led to the development of cycleapproximate instruction set simulators (Franke 2008). Cycle-approximate simulators use approximate timing models that can provide the software developer with accurate-enough information on the timing properties of the software under development. Fast functional simulators are typically based on JITcompilation techniques (Aycock 2003). JIT compilers are dynamic, i.e., software is translated from the source language to the target language along with the execution of the target language code. Functional instruction set simulators typically apply a specific form of JIT, binary translation (Sites et al. 1993), where the the binary code of the simulation target is translated into the binary code of the simulation host. Considering the development of software for mobile hand-held devices, using functional simulation is the state-of-the-art practice. Using the devices themselves as development hosts is not practical because of the small size and limited resources of the devices. Instead, software developers use cross-development environments on separate development hosts. A functional simulator is an essential component of any such environment to allow the software to be tested. Typical development hosts are based on the Intel x86 family of processors and typical mobile hand-held devices are based on the ARM family of processors (ARM 2010). As the processor families differ significantly, fast functional simulation is nontrivial. Memory access related behavior is often critical for the
guest code
translation cache TCG
generated code
Pre-generated Emulator control
prologue epilogue
Figure 1: QEMU binary translation.
performance of software. Simulation of the memory hierarchy even without detailed CPU core modelling can yield surprisingly good timing estimates (Weaver and McKee 2008). Traditional cache simulation (Edler and Hill 1998) is based on explicit simulation of the memory traffic and maintaining accurate information about the state of the memory system. The overhead of such simulation can be significant. Analytical cache models (Gecsei et al. 1970) require knowledge of the memory access distribution and are therefore even more costly to evaluate during execution driven simulation. EXECUTION-DRIVEN SIMULATION For functional simulation, we use QEMU (QEMU 2010), an open source machine emulator that uses dynamic binary translation. QEMU is able to simulate both single guest applications and entire guest operating systems while itself running on a different computer architecture. The operation of QEMU is based on dynamic binary translation, in which the machine code of the guest program is translated into functionally equivalent machine code for the host computer at run time. Compared to interpretation, this translation is likely to be slower. However, programs typically spend most of their execution time executing loops. By caching and chaining translated code (Bellard 2005), QEMU seeks to take advantage of this characteristic and achieve execution times comparable to actual hardware. The translation process is done in two phases (see Figure 1). In the first phase, a guest architecture specific front-end decodes the guest instructions and translates them into Tiny-Code-Generator operations (TCG ops), an intermediate representation. The TCG ops are then translated into native host instructions using a host architecture specific back-end. We have modified QEMU to make it suitable for timing measurements (Hirvisalo et al. 2010). Our modified ver-
sion, called pQEMU, is currently based on two separate instrumentations: • An instrumentation to classify and count executed guest instructions. These counts can then be used to estimate execution times. • An instrumentation of guest memory accesses to count the amounts of memory accesses and cache/TLB misses using run-time cache and TLB simulations. pQEMU is currently under development at Aalto University. Counting each instruction type individually would be problematic because of the large amount of different instructions. To avoid doing so, we exploit the fact that similar instructions are likely to have similar execution times. The instructions are classified based on their memory and branching characteristics and the data they operate upon. Instructions belonging to the same class are counted together. To implement instruction counting, we have modified the front end of the binary translator. Each instruction is classified during its translation and an additional counter incrementing function call is emitted as part of its translation. Since the translations of the performance-critical parts of the guest code are typically executed many times, the cost of this classification is amortized over the execution of the guest program. As instruction classification is highly processor-specific, we have currently only implemented it for the ARM instruction set architecture. For memory accessing instructions, this approach alone is not enough to obtain reasonably accurate results because the execution times of those instructions depend heavily on whether the accessed locations can be found from the cache and the TLB. We have therefore also implemented a separate instrumentation of memory accesses. During translation, for each explicit or implicit (i.e. instruction fetch) memory access in the guest program, an extra function call is emitted. The called function uses simple cache and TLB simulators to determine if the memory access causes a cache or TLB miss and then increments the corresponding counters. All this instrumentation comes with a cost. When all instrumentations are enabled, each executed instruction has to increment counters and simulate cache and TLB behavior for the instruction fetch. If the instruction itself accesses memory, cache and TLB behavior must be simulated for the accessed location as well. The extra processing and particularly any host CPU cache misses caused by the instrumentation significantly slow down the simulation compared to unmodified QEMU. Regardless, the performance benefit of using dynamic translation is so large that this slowdown is still small compared to using cycle-accurate simulation. Additionally, we anticipate that in the future, the instrumentations can be
optimized to significantly recover performance. EXPERIMENTAL SETTING Our timing estimation is based on statistics extracted from the simulation and calibration of the statistics against measurements from the following hardware platforms: PB11MPCore The Platform Baseboard for ARM11MPCore is an evaluation platform from ARM Ltd. employing a four core ARM11MPCore processor. NaviEngine NE1 NEC NaviEngine NE1 test board from NEC Electronics uses a four core ARM11MPCore System-onChip targeted for automotive applications. Beagleboard C3 The Beagleboard revision C3 is a single board computer based on OMAP3530 processor employing an ARM Cortex-A8 core running at 500MHz. Beagleboard C4 The Beagleboard C4 is a newer revision of the board running at 720MHz. KZM CA9 KZM-CA9-01 is an ARM Cortex-A9 test chip board from Kyoto Microcomputer Co., Ltd. employing a four core ARM Cortex-A9 processor. Tegra The NVIDIA Tegra 250 Harmony development kit is an evaluation board employing a dual core ARM Cortex-A9 processor. Central characteristics of the platforms are listed in Table 1. As workloads we have used the following set of applications from Ubuntu Linux 9.10 distribution: faac Freeware Advanced Audio Coder (AAC encoder) flac Free Lossless Audio Codec (audio encoder) twolame MPEG Audio Layer 2 (MP2) encoder toast/untoast GSM speech compressor/decompressor mcrypt Encryption tool with multiple algorithms ccrypt AES encryption tool lzma Lempel-Ziv/Markov-chain compressor gzip/minigzip Deflate compression tools bzip2 Burrows-Wheeler block-sorting compression tool cjpeg/djpeg JPEG encoder/decoder x264 H.264 video encoder
CPU ARM11 ARM11 Cortex-A8 Cortex-A8 Cortex-A9 Cortex-A9
Speed 210MHz 400MHz 500MHz 720MHz 500MHz 1GHz
Cache (L1, L2) 32k+32k, 1M 32k+32k, none 16k+16k, 256k 16k+16k, 256k 32k+32k, 512k 32k+32k, 1M
Table 1: Test platforms. ffmpeg Video converter mencoder Video encoder html2text HTML to text converter pdftotext PDF to text converter For exercising specific features of the memory hierarchy we have also constructed some micro-benchmarks: ictrasher Pseudo random branching test intended to cause instruction cache misses according to given parameters. propread Memory read test performing local and non-local memory reads with given proportions. propwrite Memory write test performing local and non-local memory writes with given proportions. randread Memory read test accessing memory in pseudo random order.
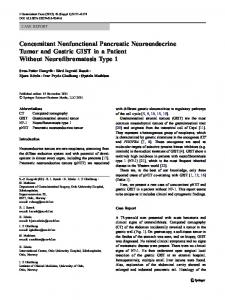
0.45 0.4 Average relative error
Platform PB11MPCore NaviEngine NE1 Beagleboard C3 Beagleboard C4 KZM CA9 Tegra
0.35
all no class no TLB no L2
0.3 0.25 0.2 0.15 0.1 0.05 0 PB11MPC NE1
C3
C4
KZM
Tegra
Figure 2: Estimation error with varying simulation detail.
tj =
X
βi xi,j
(1)
i
where tj is the run-time of workload j, βi is the linear coefficient of event i and xi,j is the event count of event i for workload j. The coefficients were calculated with the linear least squares method and the accuracy of the estimation was evaluated with leave-out-one cross-validation. Simulation overhead was measured on a desktop PC with an AMD Phenom processor running at 2.2GHz. The micro-benchmarks were used for calibrating our model parameters but for validating the accuracy and overhead of our method only the application set was used. RESULTS
randwrite Memory write test accessing memory in pseudo random order. Our instrumentations gather the following statistics: class Instruction class, one of: data processing, load, store, branch, media processing or coprocessor access. L1 cache Instruction cache misses and data cache misses. L2 cache Misses in a unified level two cache. TLB Instruction TLB, data TLB and main TLB misses. The event counts extracted from simulation runs were fitted to a simple linear model, i.e., run-time is assumed to depend linearly on event counts:
Figure 2 shows the average estimation error for the application workloads for different hardware platforms when the simulation detail is varied. The first bars (all) show the estimation error with full instrumentation. The second bars (no class) show the estimation error when the instructions are not classified based on their type. The third bars (no TLB) show the estimation error when TLB statistics are discarded in addition to the instruction classification and the fourth bars (no L2) when also L2 cache statistics are discarded. As shown in Figure 2, the effects of different statistics on the accuracy of estimation vary on different target platforms. For example instruction classification and L2 cache simulation seem quite important for the Cortex-A8 based platforms. The last two bars for the NaviEngine NE1 have the same height because there is no L2 cache in the hardware. Table 2 shows the average relative simulation time of the application workloads on our simulation host compared to native execution on real hardware. The first
Platform PB11MPCore Naviengine NE1 Beagleboard C3 Beagleboard C4 KZM Tegra
none 0.3 0.5 1.0 1.4 0.9 2.4
Instrumentation classify L1 L2 1.3 2.1 2.1 2.1 3.4 3.4 4.3 6.9 7.0 5.8 9.4 9.5 3.8 6.1 6.1 9.7 15 16
TLB 8.5 14 28 39 25 63
Table 2: Simulation overhead compared to native execution. instrumentation column (none) shows the relative runtime with none of the instrumentations enabled. The second column (classify) shows the overhead of instruction counting and classification. The following columns (L1, L2, TLB) show the overhead when in addition L1 cache, L2 cache and TLB simulations are enabled. Several observations can be made from Table 2. First of all, the difference between no instrumentation and even the simplest statistics collection is significant. This is largely due to the unoptimized implementation of our instrumentation. Even with empty instrumentation, the cost of calling a function for each translated instruction is quite high. The overhead could be reduced significantly by modifying the instrumentation to operate at the translation block level or by emitting TCG code directly instead of using function calls. Another observation is that the cost of adding L2 simulation is almost immeasurable. This illustrates the fact that estimation accuracy can sometimes be improved dramatically with virtually no overhead. The last column of the table illustrates the fact that high simulation detail can cause prohibitive overhead. The TLB simulation tries to model the hardware accurately by using fully associative micro-TLB models separately for the instruction and data sides and a two way set associative main TLB. Especially, simulating high associativity structures is very costly. DISCUSSION Figure 2 and Table 2 illustrate the flexibility of our approach. When high execution speed is important, simulation detail can be reduced by trading off estimation accuracy. When better accuracy is required, simulation details can be gradually increased by trading off execution speed. In our current modelling we have tried to follow the hardware details with reasonably high accuracy. Our L1 cache models are four way set associative and L2 cache is simulated with eight way set associativity and cache sizes are set according to hardware documentation. The TLB is modelled according to the available documentation as well. However, using parametrized models enables abstracting the architectural details. Instead of
relying on the level of detail of the hardware models, we can use calibration to get the timing estimates to acceptable levels of accuracy. As an experiment we modelled the Tegra platform with direct mapped L1 and L2 caches and one level unified TLB. To compensate for the anticipated increase in miss rates we doubled the sizes of the caches and TLB compared to hardware documentation. With this model the average estimation error for the application workloads was 10%, very close to the average 9.9% error with the more detailed modelling. However, the effect on simulation overhead was quite dramatic. Compared to using no instrumentations, using the detailed model resulted in a slowdown factor of thirty, whereas using the abstracted model reduced the slowdown factor to seven. Our model calibration is based on linear least squares estimation which assumes that the observed variables are independent. However, there can be strong correlations between the events collected with our instrumentation. This can result in unrealistic values for some of the model parameters. Even though the average estimation error can remain reasonable even with unrealistic parameter values, such parameters can cause large estimation errors for atypical workloads. This problem is of particular concern if the test set used for calibration is not sufficiently extensive compared to the number of model parameters. Therefore, relying on just the average estimation error can be misleading, which is why the model parameter values and the maximum estimation error should also be examined. In our current experiments the maximum estimation error varied between 16% and 34% depending on the hardware platform. Model parameters were mostly surprisingly realistic with memory write related parameters being a notable exception. This is most probably due to our current simulation models being unable to capture the temporal locality related behavior of software execution. Modelling spatial locality with parametrized models seems quite feasible whereas modelling the hardware structures related to temporal locality, like write buffers, interconnects and memory controllers is not as straight forward. CONCLUSION In this paper, we presented an evaluation of a simulation mechanism for understanding non-functional properties of computer software. In our experimentation, we concentrated on simulating the timing of the execution of software as many other non-functional properties can be estimated if we know the timing. The traditional way of simulating the timing behavior is based on accurate instruction set simulators. Such simulators are orders of magnitude slower than real hardware, and thus, unsuitable for software developers. Our methodology is based on modern binary translation schemes that enable attaching simulation models to
the functional simulators used in software development work. Our experimentation is based on a production quality development tool, QEMU. For a software developer, approximate information of non-functional properties is enough to make a correct design decision. Our experiments show that reasonable accuracy can be achieved using abstract machine models in simulations that have feasible simulation speed. Further, we show that there is a clear trade-off between simulation accuracy and simulation speed. Thus, such simulations are not fixed to any specific level. Rather, we can gain more accuracy by using more simulation time and vice versa. Our current methodology supports simulation of multicore processors, but does not support the simulations themselves to be run on multiple processors or cores. As the number of processor cores is rising in cell phones, laptops, etc., we see this direction of research as the most important one for the future. REFERENCES ARM, 2010. ARM Processors. http://www.arm.com/ products/processors/index.php. Aycock J., 2003. A brief history of just-in-time. ACM Computing Surveys (CSUR), 35, no. 2, 97–113. ISSN 0360-0300. doi:http://doi.acm.org/10.1145/857076. 857077. Bellard F., 2005. QEMU, a fast and portable dynamic translator. In ATEC ’05: Proceedings of the annual conference on USENIX Annual Technical Conference. USENIX Association, Berkeley, CA, USA, 41–41. Burger D. and Austin T.M., 1997. The SimpleScalar tool set, version 2.0. ACM SIGARCH Computer Architecture News, 25, no. 3, 13–25. ISSN 0163-5964. doi:http://doi.acm.org/10.1145/268806.268810. Edler J. and Hill M., 1998. Dinero IV Trace-Driven Uniprocessor Cache Simulator. http://pages.cs. wisc.edu/~markhill/DineroIV/. Franke B., 2008. Fast cycle-approximate instruction set simulation. In Proceedings of the International Workshop on Software & Compilers for Embedded Systems (SCOPES). 69–78. Gecsei J.; Slutz D.R.; and Traiger I.L., 1970. Evaluation techniques for storage hierarchies. IBM Systems Journal, 9, no. 2, 78–117. ISSN 0018-8670. doi: http://dx.doi.org/10.1147/sj.92.0078. Hirvisalo V.; Kiminki S.; Knuuttila J.; and T¨oyry T., 2010. Technical Report ESG-pQEMU-1. ESG/CSE Aalto University, to appear 2010. Miettinen A. and Hirvisalo V., 2009. Energy-efficient parallel software for mobile hand-held devices. In
First USENIX Workshop on Hot Topics in Parallelism (HotPar’09). QEMU, 2010. QEMU – open source processor emulator. http://wiki.qemu.org/. Sites R.L.; Chernoff A.; Kirk M.B.; Marks M.P.; and Robinson S.G., 1993. Binary translation. Communications of the ACM, 36, no. 2, 69–81. ISSN 0001-0782. doi:http://doi.acm.org/10.1145/151220.151227. Topham N. and Jones D., 2007. High speed CPU simulation using JIT binary translation. In Proceedings of the 3rd Annual Workshop on Modeling, Benchmarking and Simulation (MoBS). Weaver V. and McKee S., 2008. Are cycle accurate simulations a waste of time? In 7th Workshop on Duplicating, Deconstructing, and Debunking. Weber S.J.; Moskewicz M.W.; Gries M.; Sauer C.; and Keutzer K., 2004. Fast cycle-accurate simulation and instruction set generation for constraintbased descriptions of programmable architectures. In CODES+ISSS ’04: Proceedings of the 2nd IEEE/ACM/IFIP international conference on Hardware/software codesign and system synthesis. ACM, New York, NY, USA. ISBN 1-58113- 937-3, 18–23. doi:http://doi.acm.org/10.1145/1016720.1016728.