Jul 27, 2006 - Spanish and Pakistani Industry: A Comparative Analysis. Shahab Alam Malik and Tian YeZhuang. School of Management, Harbin Institute of ...
July 27, 2006
16:49
ICMIT 2006
Trim Size: 8.5in x 11in
main88
Execution of Continuous Improvement Practices in Spanish and Pakistani Industry: A Comparative Analysis Shahab Alam Malik and Tian YeZhuang School of Management, Harbin Institute of Technology, P.R. China, 150001 Abstract-The consistent rise in fame of TQM since last two decades has established a profound impact on business strategies today. Businesses are depending on continuous improvement (CI) and total quality management (TQM) as a means by which they can maintain a competitive edge. Spanish and Pakistani industries both have been engaged in continuous improvement practices with different implementation strategies and outcomes. In experience and deployment of CI practices, Spanish industry has surely outclassed Pakistani industry. This paper analyzes the outcomes and comparisons of continuous improvement practices carried out in Spanish and Pakistani manufacturing firms. The results come from an empirical study carried out on a sample size of 105 Spanish and 50 Pakistani ISO 9000:2000 certified companies. Same results of questionnaires being part of a Global study used in Spain and Pakistan industry (survey 2004, 2005 respectively) have been followed. Aspects studied here include difference of degree of execution of continuous improvement practices, motivational factors, internal and external barriers towards successful implementation and usage of problem finding and solving TQM tools between these two industries. Finally some conclusions and recommendations about continuous improvement practices, especially oriented to Pakistani SME’s are presented. Keywords: Continuous Improvement, ISO 9000, Pakistan, Spain
I.
INTRODUCTION
Background Intense global competition and diminishing trade barriers have made companies opting towards maximizing total value to be delivered to their customers. Companies are therefore applying TQM practices and acquiring quality certifications to enhance their systems and operations. Most business organizations, seeking to successfully implement TQM experience initial difficulties and few are outright failures. Disappointing results are often traceable to misapplication, lack of knowledge, unrealistic expectations, an attempt to accomplish too many goals or a combination of these. Lack of management commitment or support is also commonly blamed [1]. The continuous improvement concept The continuous improvement concept is driven by Kaizen concept [2] and Deming Cycle [3]. Kaizen: Continuous improvement (CI) is a business philosophy. The concept was popularized in Japan where it
is known as kaizen. Kaizen means "improvement". Kaizen strategy calls for never-ending efforts for improvement involving everyone in the organization. Kaizen is often translated in the west as ongoing, continuous improvement. In contrast to the usual emphasis on revolutionary, innovative change on an occasional basis, Kaizen looks for uninterrupted, ongoing incremental change. In other words, there is always room for improvement and continuously trying to become better. Originally a Buddhist term, Kaizen comes from the words, "Renew the heart and make it good." Therefore, adaptation of the Kaizen concept also requires changes in "the heart of the business", corporate culture and structure, since Kaizen enables companies to translate the corporate vision in every aspect of a company's operational practice. According to Imai [2], an important advocate of Kaizen, "Kaizen means improvement. Moreover it means continuing improvement in personal life, home life, social life, and working life. When applied to the workplace Kaizen means continuing improvement involving everyone managers and workers alike." Believers of this theory maintain that managers of production operations cannot stand still; continuous development and improvement is critical to long-term success. Continuous improvement creates steady growth and improvement. It does this by keeping a business focused on its goals and priorities. Although continuous improvement is steady, it can produce ‘quantum leaps’ when cumulative improvements ‘synergize’. This simply means that the sum of all the small improvements can cause a profound net effect greater than the sum of all the small improvements. The main idea behind continuous improvement is constant focus through which you can detect and solve problems. Deming Cycle: The Deming cycle, or PDSA cycle is a continuous quality improvement model consisting out of a logical sequence of four repetitive steps for continuous improvement and learning: Plan, Do, Study (Check) and Act. The PDCA cycle is also known as the Deming Cycle, the Deming wheel of continuous improvement spiral. Its origin can be traced back to the eminent statistics expert Mr. Walter A. Shewart, in the 1920’s. He introduced the concept of plan, do and see. The late Total Quality Management (TQM) guru and renowned statistician Edward W. Deming modified the SHEWART cycle as: Plan, Do, Study, and Act. In Plan
761
c 1-4244-0148-8/06/$20.00 �2006 IEEE
July 27, 2006
16:49
ICMIT 2006
Trim Size: 8.5in x 11in
phase objective is to plan ahead for change and to analyze and predict the results. In Do phase, the plan is executed by taking small steps in controlled circumstances. In Study/ Check phase the results are studied. Finally in Act phase organization take action to standardize or improve the process. [3]
II.
QUALITY PRACTICES IN SPANISH & PAKISTANI INDUSTRY
Industrial Historical Background of both Industries: From the Industrial Historical perspective, both countries have similar industrial booms and gluts. Both Spanish and Pakistani industries have enjoyed their prime industrial revolutions during 1960s and then have suffered gluts during 1970s. In Pakistan first industrial revolution occurred in 1959 due to governmental policies regarding encouraging and supporting exporters by introducing schemes like Export Voucher scheme and tax incentives for small industries [4]. Whereas in Spain, year 1959 was a turning point for industrial sector when a stabilization program went into effect, import duties and quotas were progressively lowered or removed, and exports were encouraged by subsidies, export credits and, and other promotional efforts [5]. In early 1970s both countries suffered industrial setbacks as in Pakistan in 1972 the government was changed and banking and insurance institutions were nationalized and 70 major industrial enterprises were taken over by the government which resulted in migration of some major investors in foreign lands. Though after 1985 most of these organizations were again privatized but after that the industry was unable to get back to previous progress track. In Spain, on the other hand, in 1974 due to oil crises, in manufacturing sector, textiles were hard hit and the automobile and the shipbuilding industries faced reduced sales and cancellations. In 1981 government introduced laws for industrial restructuring which resulted fruitfully in mid 1980s, and 1987 was the peak of economic boom for Spain industry and since then they have been continuously enjoying success. Quality Practices in Both Industries: Spanish industry is an old client of ISO Certification and has achieved number of milestones successfully in quality management practices. They are enjoying fruitful results after years of successful implementation of CI practices. Pakistan on the other hand is a novice in this field and yet has to be patient for successful outcomes. In this research paper number of factors have been brought into consideration for a comparative analysis between Spanish and Pakistani manufacturing firms. According to ISO survey of ISO 9000:2000 & ISO 14001 [6], Spain stood 5th among top ten countries for ISO 9000:2000 certification in the world with 31,836 companies certified and 4,860 companies certified with ISO 4001. In Pakistan industry on the other hand, the certification trend was too slow and by the end of December 2004, only 2,293
762
main88
companies were registered for ISO 9000:2000 as per data collected from the 4 major ISO certification bodies working in Pakistan, overall in Pakistan the total number of ISO Certified companies are around 3,000. This shows a huge difference of trend towards acquiring quality certification between two countries. III.
THE ANALYSIS METHODOLOGY
In this analysis the information is gathered from the database of CINet (Continuous Innovation Network)[7]. CINet has 23 members worldwide and are involved in research towards continuous innovation. The data is collected from the surveys conducted in these countries with the same agreed questionnaire. For statistical analysis the Statistical Package for Social Sciences (SPSS 10.0) software has been used and for graphs help of Microsoft Excel has been sought. The questionnaire consist of 18 selected blocks of questions related to organization and its operation of CI, supporting tools used in improvement activities, effects of improvement activities, and company background and its characteristics. The Spanish survey was conducted in 2004 [8] studying 105 ISO certified companies. Where as Pakistani survey was conducted in early 2005 with a sample size of 50 ISO certified companies [9]. Firms Size Range Small Medium Large Total
Spanish Industry No. of % of firms firms 28 27% 35 33% 42 40% 105 100%
Pakistani Industry No. of % of firms firms 8 16% 30 60% 12 24% 50 100%
Table 1. Firms Sample size
A.
Analysis Process and Results: From the available data only those questions having significant worth regarding implementation of CI practices in both countries industries have been analyzed and have been explained with the help of graphs and tables. Though the comparison was almost one sided, as Spanish industry is much ahead from Pakistani Industry due to its commitment and absolute execution of quality practices throughout their organizations. Their approach towards CI also shows their maturity as compared to Pakistani novice industry, by making CI practices in their maximum departments, using maximum CI tools, and most important keeping their employees motivated and satisfied by awarding them maximum incentives. In Pakistani industry, on the contrary, the current prospects are not much satisfactory, only large companies are following CI practices seriously, remaining are making partial use of it. B.
Improvement Activities(IA) Practices: Table 2 shows the cross tabulation results of improvement activities (IA) practices in Spanish and Pakistani industry. Two questions regarding ‘How and
2006 IEEE International Conference on Management of Innovation and Technology
July 27, 2006
16:49
ICMIT 2006
Trim Size: 8.5in x 11in
main88
When Improvement Activities are carried out? Spanish Industry
How Improvement Activities are carried out?
In Special Meetings In Ordinary Meetings In Regular work teams meetings In Spontaneous meetings By Individuals
Total
How Improvement Activities are carried out?
In Special Meetings In Ordinary Meetings In Regular work teams meetings In Spontaneous meetings By Individuals
90
Working Hours
Paid overtime
Unpaid over Time
Total
17%
0
0
17%
20%
1%
1%
22%
27%
1%
1%
29%
19%
0
0
19%
13% 96%
80 70 60 %
Unpaid over Time
Working Hours
Paid overtime
56%
2%
-
58%
16%
-
-
16%
14%
6%
-
20%
0%
0%
-
0%
30 20 10
Total
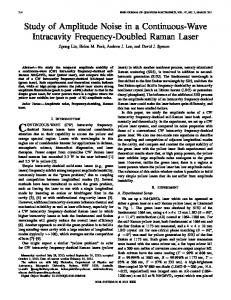
when improvement activities are performed in their organizations have been answered. In Pakistani industry, majority of the organizations (90%) perform these IA in working hours and only 10% in paid overtime, no IA are performed in unpaid overtime. Whereas in Spanish industry, 96% IA are performed in working hours, and remaining 4% are performed paid and unpaid overtime equally. In the same manner, from importance perspective, majority of companies in Pakistani industry do these IA in Special meetings (56%), second preference is given to ordinary meetings (16%) and then Regular work team meetings (14%) and by individuals (4%). No IA are carried out in spontaneous meetings. Whereas in Spanish firms, maximum IA are carried out in regular work team meetings (27%), second preference is given to ordinary meetings (20%), then remaining options including spontaneous meetings (19%), special meetings (17%) and by individuals 13%. Though as per results both industries follow the same strategy of implementing these IA in working hours but their approach towards ‘How’ these IA implemented is different. Results indicate that in Pakistani firms special meetings are called for these IA, it shows that IA are not considered and treated as a normal routine work, whereas in Spanish industry, majority of these IA are carried out in regular work teams meetings which indicates their collectivistic culture, the most suited culture considered for TQM deployment. CI Implementation Department wise Fig 1 illustrates how widely spread the CI practices are within organizations. In Pakistan industry, the whole emphasis is given to Production department (100%) only,
50 40
0 0 13% 2% 2% 100% Pakistan Industry
4% 2% 6% Total 90% 10% 100% Table 2: How improvement activities (IA) are carried out & When IA are carried out? Cross Tabulation
C.
100
40 36 44 100 44 40 32 40 40 38 42
76 62 67 78 59 58 90 69 43 39 57
0
Pakistan
Spain
Management
NPD
Engineering
Production
Marketing & Sales
Logistics
Quality
Maintenance
Aftersales Service
Financial
HRM
Fig 1: Comparison of CI Practices Department Wise
where maximum IA are carried out. Remaining 30%-45% importance is given to rest of the departments. Surprisingly minimum implementation is made in Quality department (32%). Whereas in Spanish industry the maximum implementation of CI practices is in Quality department (90%), production department and management teams come second with 78% and 76% respectively. Remaining departments come with implementation percentage of 39%65%. Minimum implementation is in financial department (39%). So in Spanish industry the average percentage of implementation of CI practices department wise is 63% as compared to 45% of Pakistani industry. D.
Importance of Motives: Fig 2 explores the motives underlying the adoption of CI practices. Respondents were presented total 5 motives to choose from. Among them the most pervasive motivations are related to customer satisfaction, quality conformance, increase in productivity, on-time delivery and competition. Results show that in Pakistani Industry the biggest motive encouraging towards CI is quality improvement (82%), second motive is customer satisfaction (58%), increase in productivity (50%), and remaining two on-time delivery and competition 26% and 14% respectively. On the contrary, in Spanish industry, customer satisfaction stands as the biggest motive towards CI practices (94%), quality conformance comes next with (89%) weight age. In the same manner productivity stands third (79%), on-time delivery fourth (69%) and competition (11%). E.
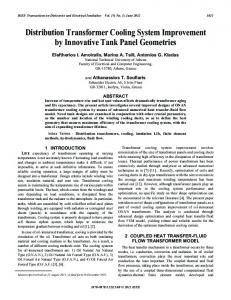
Barriers to CI Implementation In Fig 3, those barriers, which organizations normally confront in deployment of CI, are here by discussed. These barriers include time, budget, knowledge, training facilities, support from management, worker commitment and performance measures. Every organization when intends to
2006 IEEE International Conference on Management of Innovation and Technology
763
July 27, 2006
16:49
ICMIT 2006
Trim Size: 8.5in x 11in
main88
Time 80 11
Competition
Bud g et
70
14
60
Kno wled g e
69
Ontime Delivery
26
50
%
79
Productivity
50
Training Facilities
40 Sup p o rt
30 89
Quality Improvement
20
Wo rker Co mmit ment
82
10
Pakistan
Perfo rmance M eas ure
94
Customer Satisfaction
0
58
P a k is t a n 0
Spain
20
40
60
80
S pa in
100
Fig. 3. Comparison of Problems faced in CI Implementation
Fig. 2. Comparison of Importance of Motives
bring some change, always have to encounter some resistance from the system, mostly from employees end whose interests are disturbed from it. In Pakistani industry, the most devastating problem, which they normally face, is from employees/workers end (31%) who in their view intentionally resist in greeting this more organized culture due to fears of losing their jobs and finding their authorities endangered. Other significant barriers, which they normally face, include time shortage (22%) and unavailable training facilities (21%). Remaining barriers range from 4%-10% only. Spanish industry on the other hand is encountering Lack of Time/ time management as the major barrier in deployment of CI (70%). Other significant barrier is separate budget (46%) for these practices, which normally is difficult to get approved from upper management. Other barriers range from 26%-30% including worker commitment (30%), support from management (29%), training facilities and performance measures (28%), and knowledge (26%). Utilization of CI Tools Kaoru Ishikawa [10] stated “Unless one can obtain facts and accurate data about the work place, there can be no control of improvement” The use of tools and techniques for quality improvement is necessary for quality improvement and although not included in ISO 9000 and frequently disregarded, it is an important sign of TQM maturity, which managers must implement in their firms in order to improve their TQM level and results. [11]. In fact, techniques and tools are vital to support and develop the quality improvement process. [12] [13]. Table 3 shows some important results regarding usage of TQM tools in improvement activities. 12 TQM tools were given to respondents to choose from. These tools included Problem identification tools, 7 Basic quality tools, process mapping tools, FMEA, QFD, creativity tools, visualization tools, 5S, simulation, six sigma and SPC.
These tools include old and latest all types of tools, which can be utilized in an organization according to requirement. According to results, in Pakistani firms, primary emphasis is on using problem identification tools (86%), secondary emphasis is on usage of 7 basic quality tools and 5s (48% and 46% respectively). No considerable importance has been given to rest of the tools who range in 4%-12% only. Whereas in Spanish industry, problem identification tools, 5S and SPC are mostly used with a close percentage (69% 68%, and 66% respectively). 7 basic quality tools, process-mapping tools, creativity tools and standardization tools come in range of 50%-60%. Visualization tools, simulation, QFD and FMEA are used in range of 30%-40%. Only six-sigma is used minimum among other tools (22%). The average percentage of usage of these tools in Spanish industry becomes 50% as compared to 22% usage in Pakistani industry. This shows the difference of literacy and quality level of personnel, degree of pursuit of CI practices in both industries.
F.
764
Pakistan
Spain
- Problem Identification Tools
% 86%
% 69%
- 7 Basic quality Tools
48%
52%
- Process Mapping Tools
10%
56%
- FMEA (Failure mode & Effect Analysis)
10%
36%
- Quality Function deployment
6%
37%
- Creativity tools
6%
59%
- Visualization tools
12%
49%
- Standardization tools
8%
51%
- 5S (cleaning, sorting, systematizing)
46%
68%
- Simulation
4%
40%
- Six Sigma
4%
22%
- SPC - Statistical Process Control
20%
66%
Table 3: Problem Finding and Solving Tools, Usage. Higher response means frequent Usage.
2006 IEEE International Conference on Management of Innovation and Technology
July 27, 2006
16:49
ICMIT 2006
Trim Size: 8.5in x 11in
main88
100 80 60 40 Spain
20
Pakistan
0
Slogans
Training
Support from Management
Incentives
Team works
Suggestion Scheme
ISO Standards
Fig. 4. Comparison of Important Means for establishing Incremental Improvements
G.
Comparison of Incentives Approach
Majority of the Pakistani companies here believe in rewarding their employees for outstanding performance through bonus system only (36%). Less emphasis is made on remaining incentives including individual salaries reward and personal development (18%) and suggestions system (14%). Merely 10% distribute rewards to whole teams. In Spanish firms all incentives are treated with almost close proportionate, personal development through training 50%, suggestions award system 43%, Individual salaries rewards and rewards for whole teams 38% and 32% respectively. And minimum weight age is given to bonus system 29%. This difference incentive approach shows level of employer’s qualification & his approach towards employees. In Pakistan the majority of workers in SME’s are less qualified and their efforts can be justified through these bonuses easily. Whereas in Spanish industry literacy rate of both administration and workers is high, so appreciation strategy is different and is in form of promotion and training. H.
Importance of Important Means: Fig. 4 illustrates the important means for establishing improvement activities in organizations. Importance of these selected means has been compared between two industries here. Spanish industry is making comparatively higher use of these means. Major concentration is on following ISO standards (92%), the secondary mean from importance view is getting support from managerial staff and training of personnel 84% and 75% respectively. Other means fall under range of 40%-70%. On the contrary Pakistan industry’s whole concentration is limited to training (70%) and recommended ISO standards (60%) only, remaining means range between 10%-28%.
From research analysis we can conclude that both industries are employing continuous improvement methodologies and philosophy but with a different proportion and approach. Spanish industry is comparatively more experienced and advanced from Pakistani industry, their collectivistic culture is also playing a major role in successful implementation of TQM practices. In Pakistani industry though at current stage the deployment of TQM practices is comparatively slow and low especially in SME’s, but not discouraging as large companies are enjoying fruitful results through successful implementation of these practices. Pakistani industry needs to change its approach and needs to adopt TQM practices as a whole instead partially. They need to realize that acquisition of ISO or any other quality assurance certification cannot guarantee any improvement or long term survival unless some true sincere measures are taken to bring change in organization in an organized manner with equal and agreed involvement of all staff and this policy should be carried on in future too. They also need to change their policies towards their employees by making them motivated and skilled with more monetary incentives and through effective training. Finally those organizations especially SME’s who are currently suffering discouraging outcomes from these practices should try to hire services of external consultants for identification of weaknesses in their processes. REFERENCES [1] [2] [3] [4] [5] [6] [7] [8] [9]
[10] [11]
CONCLUSION AND RECOMMENDATIONS The aim of this research was to make comparative analysis between Spanish and Pakistani Industry. Though samples being taken here for study cannot be treated as true representative of whole industry, but can surely help in knowing the nature and level of deployment of continuous improvement practices carried out at current stage.
[12] [13]
Martin L. Adams, Quality First, A Model for TQM Implementation & Planning, IEEE AES Systems Magazine, February 1994 Imai, M., 1986. Kaizen, “The Key to Japan’s Competitive Success,” McGraw-Hill, New York. Mary Watson, 1986, “The Deming Management Method”, Perigee Books Shahab Alam Malik, Tian YeZhuang, “ISO Certification: The Trend and Scope from Pakistani Industry’s Perspective”, unpublished. Spain Industrial Development, The Library of Congress Country Studies; CIA World Fact book The ISO survey of ISO 9000:2000 and ISO 14001 Certifications (December 2003) Continuous Innovation Network (CINet) Jose Albors G. “CI Practices in Spain. It’s role as a strategic tool for the firm. Empirical evidence from the CINet Analysis”. 5th CINet Conference, Sydney, Australia, 2004 Shahab Alam Malik, Tian YeZhuang, “Continuous Improvement Practices in Pakistan Manufacturing Firms, Empirical Evidence from the survey analysis”, International Convention on Quality Improvement, Karachi, Pakistan, 2005 Kaoru Ishikawa, What is Total Control? The Japanese way. Parentice-Hall, Inc. N.J. Juan Jose Tari, Vicente Sabater, “Quality tools and techniques: Are they necessary for quality management?”, International journal of Production Economics, 92 (2004) 267-280 Bunney, H.S., Dale, B.G.,. The Implementation of quality management tools and techniques: A Study. The TQM Magazine 9 (3), 183-104, 1997 Stephens, B., Implementation of ISO 9000 or Ford’s Q1 award: Effects on organizational knowledge and application of TQM principles and quality tools. The TQM Magazine 9 (3), 190-200, 1997
2006 IEEE International Conference on Management of Innovation and Technology
765