brain sciences Article
Exercise Strengthens Central Nervous System Modulation of Pain in Fibromyalgia Laura D. Ellingson 1, *, Aaron J. Stegner 2,3,† , Isaac J. Schwabacher 2,3,† , Kelli F. Koltyn 3,† and Dane B. Cook 2,3,† 1 2 3
* †
Department of Kinesiology, Iowa State University, Ames, IA 50011, USA William S. Middleton Memorial Veterans Hospital, Madison, WI 53706, USA;
[email protected] (A.J.S.);
[email protected] (I.J.S.);
[email protected] (D.B.C.) Department of Kinesiology, University of Wisconsin-Madison, Madison, WI 53706, USA;
[email protected] Correspondence:
[email protected]; Tel.: +1-515-294-2552; Fax: +1-515-294-8740 These authors contributed equally to this work.
Academic Editor: Patrick W. Stroman Received: 18 December 2015; Accepted: 17 February 2016; Published: 26 February 2016
Abstract: To begin to elucidate the mechanisms underlying the benefits of exercise for chronic pain, we assessed the influence of exercise on brain responses to pain in fibromyalgia (FM). Complete data were collected for nine female FM patients and nine pain-free controls (CO) who underwent two functional neuroimaging scans, following exercise (EX) and following quiet rest (QR). Brain responses and pain ratings to noxious heat stimuli were compared within and between groups. For pain ratings, there was a significant (p < 0.05) Condition by Run interaction characterized by moderately lower pain ratings post EX compared to QR (d = 0.39–0.41) for FM but similar to ratings in CO (d = 0.10–0.26), thereby demonstrating that exercise decreased pain sensitivity in FM patients to a level that was analogous to pain-free controls. Brain responses demonstrated a significant within-group difference in FM patients, characterized by less brain activity bilaterally in the anterior insula following QR as compared to EX. There was also a significant Group by Condition interaction with FM patients showing less activity in the left dorsolateral prefrontal cortex following QR as compared to post-EX and CO following both conditions. These results suggest that exercise appeared to stimulate brain regions involved in descending pain inhibition in FM patients, decreasing their sensitivity to pain. Thus, exercise may benefit patients with FM via improving the functional capacity of the pain modulatory system. Keywords: modulation; exercise; chronic pain; imaging; fibromyalgia
1. Introduction Fibromyalgia (FM) is a complex condition, characterized by chronic musculoskeletal pain along with a host of other interrelated symptoms. Although the mechanisms that maintain pain in FM are unknown, evidence points to a central nervous system dysregulation of pain processing. Specifically, research demonstrates heightened sensitivity to sensory stimuli, exaggerated brain responses to both painful and non-painful stimuli, and impairments in pain modulation [1]. The ability to modulate pain is critical for maintaining a functional balance between facilitation and inhibition of sensory stimuli and dysregulations in pain modulation can influence quality of life, disability and the development of chronic pain [2]. Exercise stimulates the pain modulatory system [3] and chronic aerobic exercise training is a consistently efficacious treatment for FM [4]. It is plausible then that exercise functions as a treatment by improving pain modulation. Previous
Brain Sci. 2016, 6, 8; doi:10.3390/brainsci6010008
www.mdpi.com/journal/brainsci
Brain Sci. 2016, 6, 8
2 of 13
research has examined the relationship between exercise and pain modulation in FM. However, current evidence is equivocal with some studies showing a decrease in pain sensitivity with exercise and others showing either no change or an increase [5,6]. Brain responses to pain following exercise remain largely unexplored in FM. A better understanding of these responses could help to explain the consequences of acute and chronic exercise for FM patients. The purpose of the present study was to assess the influence of exercise on brain responses to pain in patients with FM and pain-free controls. Exercise was used as a method of stimulating pain modulatory (i.e., central nervous) systems in FM and functional neuroimaging was employed to explore the neural responses underlying these processes. 2. Experimental Section 2.1. Participants Female patients with a physician-confirmed diagnosis of FM who were between the ages of 18 and 60 years old, and age- and sex-matched pain-free controls (CO) were recruited from the community via advertisements. Exclusion criteria included: pregnancy, presence of ferrous metal in the body, left handedness, claustrophobia, medical conditions that would interfere with the ability to perform cycling exercise, diagnosis of major depressive disorder, and use of medications that would affect pain perception or the interpretation of brain data, including opioids, high-dose antidepressants and cardiovascular medications. Medication information and dosage were supplied by the patient and their physician and dosage levels (low, moderate, high) were determined through both physician consultation and use of the Physician’s Desk Reference [7]. A total of 12 female FM patients and 12 pain-free controls were enrolled in the study. Prior to testing, participants abstained from caffeine for 4 h, cigarettes for 2 h, alcohol for 24 h, structured exercise for 24 h and any pain medications for 24 h. Participants were compensated $100 for their time. 2.2. Procedures The institutional review board at the University of Wisconsin-Madison approved the procedures of this study and informed consent was obtained from all participants. To characterize the sample, patients completed the Fibromyalgia Impact Questionnaire (FIQ) [8]. Participants underwent two fMRI scanning conditions, one following exercise (EX) and the other following quiet rest (QR). Order of conditions was randomized and counterbalanced. Perceptual and brain responses to a series of painful stimuli were collected during each scan. Self-reported pain symptoms were monitored pre and post scans with the Short Form—McGill Pain Questionnaire (MPQ) [9]. Participants’ scans were conducted at approximately the same time of day (˘ 1 h) and separated by a week. During the week between conditions, participants wore an ActiGraph accelerometer during waking hours to characterize regular physical activity and sedentary behaviors. 2.2.1. Condition Descriptions For the EX condition, participants completed 25 min of moderate intensity cycling on a Vision Fitness 2150, semi-recumbent stationary bicycle (Vision Fitness, Lake Mills, WI, USA). Following a 1-min warm-up, participants were instructed to achieve and maintain a pedaling rate of 60–70 revolutions per minute. They were also encouraged to increase or decrease the resistance level as needed to maintain a perception of effort that was “somewhat hard” or approximately “13” on Borg’s 6–20 ratings of perceived exertion (RPE) scale [10]. This intensity and duration of cycling was selected based on evidence from our group demonstrating that patients would be willing and able to complete the exercise [5]. Pedaling rate and RPE were monitored and recorded by research staff throughout cycling. For QR, participants rested on the same bike for the same amount of time as the exercise condition.
Brain Sci. 2016, 6, 8
3 of 13
2.2.2. fMRI Procedures Three experimental runs, each including six heat pain stimuli (44 ˝ C, 46 ˝ C & 48 ˝ C), were delivered to the left palm using a Medoc Pathway Thermal Sensory analyzer with a 573-mm2 CHEPS Peltier thermode. Experimental heat pain was chosen as our pain stimulus because many exercise and pain sensitivity studies have employed this modality and our primary interest was to explore brain responses to experimental pain stimuli. In this context, we are not testing clinical aspects of FM, but rather how the central nervous system regulates pain processes. Temperatures were each presented twice per run in a pseudorandom order; the order of temperatures was identical for each participant across the two conditions. No runs began with a 48 ˝ C stimulus as previous research in our lab has shown that presenting the strongest temperature first has a significant effect on ratings for subsequent temperatures. Temperatures increased from 35 ˝ C to the target temperature at a rate of 70 ˝ C per second. Stimuli lasted 10 s followed by a 10-s rating period and a 20-s off period. High-resolution goggles and a button response device were used by participants to rate the intensity and unpleasantness of the heat pain using the Gracely Box Scales [11]. Each run lasted 4:28. For the scan post-exercise, the first run of pain stimuli was delivered on average 18:30 ˘ 1:45 min after participants stopped pedaling and for the scan post-quiet rest the time interval was 20:08 ˘ 2:27. These lags between exercise and scanning included the transition from the prep room to the scanner, instrumentation of participants for physiological monitoring, and preparatory scans (e.g., localizer). During scanning, heart rate (HR) and end-tidal CO2 (ETCO2 ) were recorded and included in statistical analyses to account for exercise-related changes in physiology that could influence the interpretation of the BOLD signal. Scanning procedures were identical on each testing day. All functional and anatomical magnetic resonance images were collected on a 3-Tesla GE Discovery MR750 scanner (GE Health Systems, Waukesha, WI, USA). Following the localizer scan and high-order shimming, high-resolution functional T2* echo-planar blood oxygen level dependent (EPI-BOLD) images were obtained with an eight-channel transmit-receive head coil. Functional image acquisitions were obtained with a gradient echo sequence (TR 2000 ms, TE 25 ms, flip angle 60˝ ) and consisted of 40 sagittal slices with thickness 4 mm and no gap, yielding coverage of the whole brain. The acquisition matrix was 64 ˆ 64 and the FOV was 24 cm, delivering an in-plane voxel resolution of 3.75 mm ˆ 3.75 mm ˆ 4 mm. High-resolution T1-weighted anatomical acquisitions (TR 9 ms, TE 1.7 ms, FOV 24 cm, flip angle 10˝ ) consisted of 128 axial slices with a matrix of 256 ˆ 256, each 1.2 mm thick. 2.3. Data Processing and Analyses Physical activity data used to characterize the sample were processed using standard procedures. Criteria for inclusion of accelerometer data were at least 10 h of valid wear time for a minimum of 3 weekdays and 1 weekend day. Non-wear time was defined as 60 min with zero acceleration in the vertical axis. In-house software was used to calculate minutes spent in sedentary, light, low-moderate, high-moderate, and vigorous levels of physical activity. Cut-off points for accelerometer counts per minute were based on previous research as follows: sedentary = 100 and below; light = 101–760; low-moderate = 761–1952; high-moderate = 1953–5724; vigorous = 5725 and above [12,13]. Functional brain imaging analyses were conducted using Analysis of Functional Neuroimages (AFNI) software [14,15] and all other statistical analyses were performed with SPSS 22.0 (SPSS Inc., Chicago, IL, USA). Anatomical images were registered to the Montreal Neurological Institutes (MNI) 152 template [16] using an affine transformation. For functional data, the initial five time points were discarded from functional analyses due to saturation effects. Data were motion corrected (3dvolreg), orthogonalized to periodic components of the physiological signal (IRF-RETROICOR from PESTICA [17,18]), de-spiked (3dDespike), slice-time corrected (3dTshift), aligned to the MNI-152 template with a nonlinear warp (ANTS WarpTimeSeriesImageMultiTransform), iteratively blurred to a smoothness of 11.3 mm full-width, half-maximum (3dBlurToFWHM) and converted to percent signal
Brain Sci. 2016, 6, 8
4 of 13
change. AFNI’s 3dREMLfit program was used to perform linear regression on each participant’s data including separate regressors for the pre-stimulus countdown, heat stimulus, and rating period. 2.3.1. Corrections for Physiological Noise To control for longer-term physiological effects, in each subject’s final model we included HR and ETCO2 regressors convolved with five tent functions, evenly spaced from 0 s to 20 s (i.e., at 0, 5, 10, 15 and 20 s). This was done in order to model the unknown hemodynamic responses to these physiological processes, which have higher latencies and longer durations than responses to the types of tasks that are often performed in the neuroimaging environment (e.g., responses to cognitive tasks) [19,20]. We elected to estimate these hemodynamic responses for each subject anew rather than use the estimates of Birn [19] and Chang [20] because of the variation of the hemodynamic response to different types of changes in respiration (e.g., breath holding, cued depth and rate changes, free breathing) observed previously [19], which suggested that the hemodynamic responses estimated in those references might not generalize to subjects immediately post-exercise. Thus, while we chose an approach to correct for physiological noise similar to these methods, we are not employing their exact correction. 2.3.2. Group Level Analyses Group-level brain imaging analyses were limited to regions of interest (ROIs) based on research in the areas of central nervous system processing of pain stimuli [21]. Regions included pre- and postcentral gyri, superior parietal lobule, cingulate cortices, brainstem, frontal medial cortex, frontal and parietal opercula, frontal pole, insula, thalamus, and middle frontal and orbital frontal gyri. Pain intensity and unpleasantness ratings (0–20) were averaged across presentations of stimuli at each temperature within each run and were compared using Group (FM & CO) by Condition (EX & QR) by Run (1, 2 & 3) by Temperature (44 ˝ C, 46 ˝ C & 48 ˝ C) repeated measures ANOVAs with the primary contrasts of interest being the main effects for Group and Condition and the interaction of these variables. We observed order effects for the CO group, such that pain ratings to experimental pain were generally higher on Day 1 compared to Day 2, regardless of condition (EX or QR). Thus, we included the Condition order as a covariate in our repeated measures ANOVAs. Simple effects were used to further explore significant results across Run and Temperature. Effect sizes (Cohen’s d) were used to characterize the magnitude of the differences in pain ratings between conditions. Paired-samples t-tests and effect sizes were also used to compare pain symptoms (MPQ visual analog scale) pre and post-scanning for FM patients. Brain responses to pain were analyzed using AFNI’s Linear Mixed Effects (3dLME) program with condition and group as the independent variables and brain responses to pain as the dependent variable. To control for multiple comparisons, we thresholded the statistical map at a voxelwise p-value of 0.01 and applied a cluster-size threshold of 43 voxels (2752 mm3 ), corresponding to a cluster-wise alpha of 0.05 as determined by AFNI’s 3dClustSim. Six Pearson correlation coefficients were used to examine the relationships between differences in brain responses to pain (for significant regions of interest only) and differences in self-reported experimental pain ratings (intensity and unpleasantness) between EX and QR. To control for multiple comparisons, three families of correlations were created, one for each region, and a Bonferroni correction was applied reducing the alpha level for significance for these analyses to 0.025. Questionnaire and physical activity data were used to characterize the sample; group comparisons of these data were performed using independent samples t-tests. Physiological data collected in the scanner (HR, ETCO2 ) were averaged across each run and compared within and between groups using repeated measures ANOVAs. Alpha was set to 0.05 for these comparisons.
Brain Sci. 2016, 6, 8
5 of 13
3. Results and Discussion One FM patient was unable to return for exercise due to scheduling complications so data from 11 patients and 12 controls are presented (see Table 1 for participant characteristics). Table 1. Demographics, pain symptoms, and physical activity data. FM (n = 11) Mean (SD)
CO (n = 12) Mean (SD)
38.58 (11.17) 165.18 (6.77) 65.55 (11.17) 52.95 (13.06)
43.67 (7.02) 165.92 (5.77) 68.41 (10.20) NA
Age (years) Height (cm) Weight (kg) FIQ MPQ VAS
Pre-Exercise Pre-Quiet Rest
57.82 (29.10) * 50.50 (18.24) *
4.83 (10.18) 1.33 (2.77)
Physical Activity Data (minutes/day)
Sedentary Light Moderate Vigorous
624.40 (78.69) 164.77 (48.17) 82.15 (31.23) 0.28 (0.55)
625.88 (81.35) 158.43 (37.42) 108.04 (39.8) 3.58 (9.27)
* FM significantly greater than CO, p < 0.05; FIQ = Fibromyalgia Impact Questionnaire; FM = Fibromyalgia; CO = control.
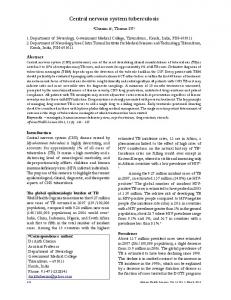
3.1. Influence of Exercise on Pain Ratings and Symptoms Detailed results for pain intensity (PI) and pain unpleasantness (PU) ratings during each run are presented in Table 2 and illustrated (Run 1 only) in Figure 1. For both PI and PU ratings, there were significant Main Effects for Temperature (PI: p = 0.002; PU: p = 0.010) and Condition (PI: p = 0.005; PU: p = 0.012) and significant Condition by Run interactions (PI: p = 0.032; PU: p = 0.030). The Condition by Run interaction indicated that pain ratings differed between conditions as a function of run. Neither the Main Effect of Group nor the Group by Condition interaction were significant (p > 0.05). Table 2. Pain intensity (PI) and unpleasantness (PU) ratings (Mean (SD)) for pain delivered post-exercise (EX) and post quiet rest (QR). FM Patients (n = 11)
CO (n = 12)
PI
PU
PI
PU
EX
Run 1 Run 2 Run 3
9.31 (5.07) 10.03 (4.49) 9.88 (4.86)
7.30 (4.36) 7.97 (4.14) 7.80 (4.39)
8.83 (4.42) 8.51 (4.06) 8.47 (4.60)
6.24 (3.74) 5.42 (3.73) 5.76 (3.70)
QR
Run 1 Run 2 Run 3
11.33 (5.21) 9.60 (3.96) 9.50 (3.60)
9.09 (4.30) 7.47 (3.21) 7.53 (3.40)
8.15 (3.44) 7.31 (3.50) 7.79 (3.16)
5.68 (3.01) 4.96 (2.39) 5.35 (2.40)
Further examination of the significant interactions using effect size estimates indicated that the results were largely driven by higher pain ratings during the QR condition in FM patients (see Figure 1). Specifically for FM patients, PI and PU ratings were moderately higher during the first run post-QR as compared to the first run following EX (∆PI: 2.0, 95% CI (0.9, 5.0); ∆PU: 1.8, 95% CI (0.6, 4.2)), demonstrating a small and transient hypoalgesic effect for EX (d = 0.39–0.41). Ratings were comparable for FM patients between EX and QR for runs 2 and 3 (d = 0.07–0.14). Effect size estimates for CO showed that pain rating differences between EX and QR were consistently small (d ď 0.20) across runs. Moreover, effect size estimates for group comparisons demonstrated that pain ratings post-EX in FM were similar to those seen in controls during the first pain run (d = 0.10–0.26; p > 0.05) but showed small to moderate elevations compared with controls during the second and third runs as the effects of exercise diminished (d = 0.30–0.65). Similarly, following QR, FM patients’ ratings were meaningfully elevated compared to CO (d = 0.51–0.93).
EX
Brain Sci. 2016, 6, 8
PI 9.31 (5.07) 10.03 (4.49) 9.88 (4.86) 11.33 (5.21) 9.60 (3.96) 9.50 (3.60)
Run 1 Run 2 Run 3 Run 1 Run 2 Run 3
QR
PU 7.30 (4.36) 7.97 (4.14) 7.80 (4.39) 9.09 (4.30) 7.47 (3.21) 7.53 (3.40)
PI 8.83 (4.42) 8.51 (4.06) 8.47 (4.60) 8.15 (3.44) 7.31 (3.50) 7.79 (3.16)
PU 6.24 (3.74) 5.42 (3.73) 5.76 (3.70) 5.68 (3.01) 4.96 (2.39) 5.35 (2.40)
6 of 13
18 FM EX 16
FM QR CO EX
14
CO QR
Pain Ratings (0-20)
12 10 8 6 4 2 0 Int
Unp
Int
44°C
Unp
Int
46°C
Unp 48°C
1. Pain intensity (Int) and unpleasantness (Unp) (Unp) ratings the first runrun of each condition. FigureFigure 1. Pain intensity (Int) and unpleasantness ratingsduring during the first of each condition. FM = fibromyalgia; CO = control; EX = post-exercise; QR = post quiet rest. FM = fibromyalgia; CO = control; EX = post-exercise; QR = post quiet rest.
Following the scan post-EX, FM patients experienced a decrease in pain symptoms as reported from the MPQ visual analog scale (pre = 57.8 ˘ 29.1; post = 53.1 ˘ 27.6; d = 0.39) whereas after the QR scan there was an increase in pain symptoms (pre = 50.5 ˘ 18.2; post = 57.3 ˘ 20.5; d = 0.17). Following EX, HR was significantly elevated (p < 0.001) and ETCO2 was significantly lower across runs (p = 0.013) compared to QR. Groups did not differ significantly in HR (p > 0.05) and there were no significant interactions (p > 0.05). However, ETCO2 was significantly higher in FM compared to CO across runs (p < 0.001). 3.2. Influence of Exercise on Brain Processing of Pain For neuroimaging data five participants were excluded (2FM, 3CO) due to excessive head movement (>2 mm, n = 3) and missing HR data (n = 2) reducing the sample size for these analyses to nine individuals per group. There was a significant within-group difference in FM patients, characterized by greater brain activity bilaterally in the anterior insula following EX as compared to QR (see Figure 2; p < 0.01). In CO, there was also a significant within-group interaction, characterized by greater activity in the right parietal operculum and the right pre/postcentral gyrus following exercise as compared to quiet rest (p < 0.05). Further, there was a significant Group by Condition interaction (p < 0.05) characterized by relatively greater activity in the left dorsolateral prefrontal cortex (DLPFC) for FM patients following EX compared to both the QR condition and CO (both conditions; see Figure 3). There were no additional significant group differences (p > 0.05) in brain responses to pain between FM or CO for either EX or QR conditions. Volumes, t-statistics and coordinates for significant regions are shown in Table 3. Table 3. Results from the Linear Mixed Effects Model examining the differences in brain responses between groups (Fibromyalgia (FM), Control (CO)) and sessions (Exercise (EX) and Quiet Rest (QR)). Direction
Peak X,Y,Z
Volume (mm3 )
Peak t-Statistic
α
+ +
32, ´20, ´18 ´52, ´20, ´6
4608 4032
2.83 2.88