EXIMIUS: A Measurement Framework for Explicit and Implicit Urban Tra�ic Sensing Zhou Qin
Zhihan Fang
Yunhuai Liu
Rutgers University
[email protected]
Rutgers University
[email protected]
Peking University
[email protected]
Chang Tan
Wei Chang
Desheng Zhang
iFlytek changtan2@i�ytek.com
iFlytek weichang2@i�ytek.com
ABSTRACT
Rutgers University
[email protected]
CCS CONCEPTS
Urban tra�c sensing has been investigated extensively by different real-time sensing approaches due to important applications such as navigation and emergency services. Basically, the existing tra�c sensing approaches can be classi�ed into two categories, i.e., explicit and implicit sensing. In this paper, we design a measurement framework called EXIMIUS for a large-scale data-driven study to investigate the strengths and weaknesses of these two sensing approaches by using two particular systems for tra�c sensing as concrete examples, i.e., a vehicular system as a crowdsourcing-based explicit sensing and a cellular system as an infrastructure-based implicit sensing. In our investigation, we utilize TB-level data from two systems: (i) vehicle GPS data from 3 thousand private cars and 2 thousand commercial vehicles, (ii) cellular signaling data from 3 million cellphone users, from the Chinese city Hefei. Our study adopts a widely-used concept called crowdedness level to rigorously explore the impacts of various spatiotemporal contexts on real-time tra�c conditions including population density, region functions, road categories, rush hours, etc. based on a wide range of context data. We quantify the strengths and weaknesses of these two sensing approaches in di�erent scenarios then we explore the possibility of unifying these two sensing approaches for better performance. Our results provide a few valuable insights for urban sensing based on explicit and implicit data from transportation and telecommunication domains.
• Networks → Network measurement; Sensor networks;
KEYWORDS
Telecommunication, transportation, network, measurement ACM Reference Format: Zhou Qin, Zhihan Fang, Yunhuai Liu, Chang Tan, Wei Chang, and Desheng Zhang. 2018. EXIMIUS: A Measurement Framework for Explicit and Implicit Urban Tra�c Sensing. In SenSys ’18: Conference on Embedded Networked Sensor Systems, November 4–7, 2018, Shenzhen, China. ACM, New York, NY, USA, 14 pages. https: //doi.org/10.1145/3274783.3274850
1
INTRODUCTION
The road Crowdedness Level (CL), as a simpli�ed indicator of tra�c speed, has very important applications in urban areas, e.g., navigation [5] [11] and emergency response [16]. In particular, Google Maps [13] and Gaode Maps [12] (i.e., a major online map service provider in China) use di�erent colors to imply di�erent CLs on maps, which re�ect a travel delay considering roads speed limits and provide hints for choosing alternative routes to save time. Compared to speed, CL with a low granularity enables a simpli�ed calculation, estimation, and prediction for tra�c conditions with a higher sensing and computational e�ciency [24] [46]. Due to its importance, CL, or tra�c condition in general, has been studied extensively by di�erent sensing systems and their data. For example, vehicular systems and their GPS data [1] [39], loop sensors and their log data [42], cellular networks and their signaling data [19][8][22][44], and even building sensing systems and their occupancy data [45]. In short, the existing CL sensing approaches can be basically classi�ed into Explicit Sensing and Implicit Sensing based on their sensing natures. The explicit sensing systems have direct CL measurements, e.g., vehicular systems and their GPS data as well as loop sensors and their log data. In contrast, implicit sensing systems have indirect CL measurements, e.g., (i) cellular networks and their signaling data, with which CLs
Permission to make digital or hard copies of all or part of this work for personal or classroom use is granted without fee provided that copies are not made or distributed for pro�t or commercial advantage and that copies bear this notice and the full citation on the �rst page. Copyrights for components of this work owned by others than the author(s) must be honored. Abstracting with credit is permitted. To copy otherwise, or republish, to post on servers or to redistribute to lists, requires prior speci�c permission and/or a fee. Request permissions from
[email protected]. SenSys ’18, November 4–7, 2018, Shenzhen, China © 2018 Copyright held by the owner/author(s). Publication rights licensed to ACM. ACM ISBN 978-1-4503-5952-8/18/11. . . $15.00 https://doi.org/10.1145/3274783.3274850
1
SenSys ’18, November 4–7, 2018, Shenzhen, China
Z. Qin et al.
are calculated based on changes of cellphone user’s attached cell towers along with the associated time interval [19]; (ii) sensing systems for buildings and their occupancy data, with which CLs are calculated based on a learned correlation between building occupancy level and nearby tra�c conditions [45]. Even with the above state-of-the-art sensing approaches, real-time urban-scale CL is still challenging to model because of the spatiotemporal coverage and accuracy of sensing systems. For the explicit sensing, its advantage is the accurate measurement, but its spatiotemporal coverage is low due to low penetration rates [33] [34] [31] [35], and further its deployment cost is high due to dedicated purposes [40] [14]. Based on our research results in the Chinese city Hefei, we �nd that a 6-thousand-vehicle network can only cover 28% of the road segments in this city with a one-hour time slot. In contrast, for implicit sensing [18] [19] [8], its advantage is high spatiotemporal coverage due to its high penetration rates [41], but its CL measurement accuracy is low because of indirect measurements [10]. Besides, implicit sensing usually makes use of existing datasets, which are dedicated to other purposes [26] [6]. For example, based on our results, we �nd that the data from cellular networks can only provide 61% accuracy on predicting travel time since their CL modeling is based on tower-level locations. To date, it is still unclear which sensing approaches and their data are better for urban-scale CL modeling under what contexts [29]. Given numerous sensing approaches for CL sensing or traf�c modeling in general, we are reluctant to provide another sensing approach. Instead, we are interested in the evaluation of which kinds of sensing systems are better in what scenarios, and how can we explore their individual strengths to collectively address their individual weaknesses. To achieve this goal, we design a measurement framework called EXIMIUS (meaning excellent in Latin) to validate EXplicit and IMplicit solutIons for Urban Sensing. In EXIMIUS, we utilize CL as a concrete metric to quantify the advantages and disadvantages of both explicit and implicit sensing. Di�erent from the existing work focusing on either explicit or implicit sensing, EXIMIUS features a comparative study and explores (i) in which contexts (including spatiotemporal and contextual factors) one approach is better than the other, and (ii) how we can combine the strengths of these two approaches to overcome their individual weaknesses. In particular, the contributions of this paper are as follows.
•
•
•
•
on real-world data from 5 thousand vehicles (GPS data), 3 million cellphones (signaling data) and 7 million residents (census data). Such large-scale infrastructures and data enable us to perform a detailed comparative study on explicit and implicit tra�c sensing. We design a context-aware measurement framework called EXIMIUS based on GPS data from a vehicular system as an example of explicit CL sensing, and signaling data from a cellular network as an example of implicit CL sensing. With these data, we provide some in-depth analytic results about their spatiotemporal coverage and accuracy. We further compare pros and cons of two state-of-the-art models based on the data in various settings to evaluate the impacts of population density, region functions, road types, and the rush hours on the performance of these two CL sensing. We implement EXIMIUS with one month of 893-GB vehicular GPS data and cellular signaling data from Chinese city Hefei, along with context data including population data and road network data. To validate the coverage and accuracy of two kinds of data and their resultant models, we utilize navigation data from one of the largest navigation and map service providers in China as the ground truth for evaluation. To our knowledge, this is the �rst time that such detailed datasets are utilized to implement an urban tra�c sensing project. Our measurement results reveal the impacts of various contextual information on CL sensing, providing insights on the trade-o�s between spatiotemporal coverage and accuracy for real-world tra�c sensing. Based on our results, we provide a detailed discussion of insights for explicit and implicit urban sensing and important lessons learned. Besides, we discuss the generality of EXIMIUS by explaining its ability to include more data sources, such as bicycles, buses, CDR, etc. Based on characteristics of explicit and implicit sensing, we provide a solution to improve spatiotemporal coverage and accuracy of tra�c sensing by integrating these two kinds of sensing based on data fusion.
The rest of the paper is organized as follows. Section 2 describes explicit and implicit sensing systems and their data. Section 3 introduces two state-of-the-art models for explicit and implicit sensing. Section 4 shows our measurement results under di�erent contexts. Section 5 discusses insights and lessons learned from our comparative analysis. Section 6 provides related work, followed by conclusion in Section 7.
• To our knowledge, we conduct the �rst quantitative investigation on tra�c condition (quanti�ed by CL) sensing approaches from explicit and implicit perspectives by utilizing two large-scale real-world infrastructures to address the trade-o�s of two approaches considering di�erent sensing features. Our study is mainly based
2
EXIMIUS: SENSING SYSTEMS & DATA
To compare implicit and explicit sensing approaches, our measurement study focuses on the Chinese city Hefei, i.e., the capital city of Anhui Provence with a total area of 4, 372 mi 2
2
EXIMIUS
SenSys ’18, November 4–7, 2018, Shenzhen, China
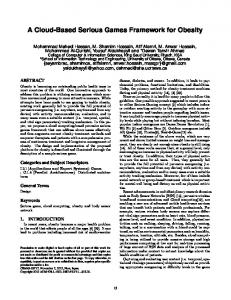
Fig 2: Roads and Cell Towers Fig 1: Voronoi Partition Fig 3: Population Distribution and 7 million population. The two sensing systems we study • Timestamp: Time when the record was generated at in EXIMIUS represent two major urban sensing infrastrucsub-second level. tures from the telecommunication domain [18] [20] and the • Tower ID: A unique identi�cation of the cell tower transportation domain [38] [25] [48] [21]. In Subsection 2.1 from which the record was generated. and 2.2, we present these two sensing systems and their • User ID: A unique encrypted identi�cation of the cellsensing data. In Subsection 2.3, we introduce contextual data phone user associated with this record. to understand their impact on sensing results. In Subsec• Web Type: The type of connection the user has estabtion 2.4, we describe how to quantify CLs under di�erent lished, e.g., 2G, 3G, 4G or LTE. spatiotemporal partitions. • Service Type: Seven service types in total, including Patch_Switch, CSFB (Circuit Switched FallBack), TAU 2.1 Cellular System for Implicit Sensing (Tracking Area Update), LTE_ATTACH, LTE_DETACH, LTE_PAGING, Service_Req (e.g., 2G, 3G, 4G, LTE). Based on our collaboration, we have o�ine data access to one of the three major cellular operators in China. This cellular Spatial and Temporal Coverage: We �rst perform a denetwork has 23,704 cell towers in Hefei and provides services tailed analysis of signaling data to validate their spatial and for 3.37 million users with 20 GB records generated per day. temporal coverage for CL modeling.
Fig 4: Cell Size Dist. Fig 5: Record # Dist. System Granularity: Based on all cell towers’ locations, we obtain a Voronoi partition [2] of Hefei as in Figure 1. We �nd that this cellular network leads to a very detailed partition even on the cell tower level. A distribution of cell region sizes is given in Figure 4. We �nd that 85% of cell regions have a size smaller than 1 km2 and 5% of regions in the downtown area have a size smaller than 0.01 km2 , making them �ne-grained enough for crowdedness level sensing. Data Format: Signaling data cover several events including cell tower attaching and detaching, etc. [19] The detailed format of signaling data is as follows.
Fig 6: Record Type Dist. Fig 7: Updating Dist. As shown in Figure 5, we �nd that 60% users have more than 10 daily records, providing a large amount of data for urban sensing. For all the data generated, we �nd that more than 50% of signaling data are generated for Service Requests, e.g., phone call, SMS, Web services as shown in Figure 6, and a large number of them are for web services, e.g., social network apps, which require frequent data accessing. To further evaluate the data generating frequency, Figure 7 gives CDF of updating intervals, i.e., the time interval between two signaling records. We �nd that 80% of the records have an updating interval shorter than 100s and the average updating
3
SenSys ’18, November 4–7, 2018, Shenzhen, China
Z. Qin et al.
interval is 70.26s, which indicate a large number of records can be used for CL modeling.
Due to operating natures of these two kinds of vehicles, we study them separately as follows. Data Format: With a GPS-level spatial granularity, both private and commercial vehicles are using on-board devices to generate data with the following format. • Timestamp: Time when the record was generated at a level of seconds. • Vehicle ID: A unique identi�cation of a vehicle, from which the record was generated. • GPS Location: A set of GPS coordinates indicate the location where the record was generated. • Speed: A number from 0 to 200 indicating the speed of the vehicle when the record was generated. On average, all private and commercial vehicles upload 1.5 million and 500 thousand records to a central server per day with cellular connection based on their uploading frequency. In Figures 10 and 11, we �nd that 90% of private vehicles upload fewer than 1,000 records per day, whereas 80% of commercial vehicles upload fewer than 300 records per day.
Fig 8: Cell Spatial Dist. Fig 9: Cell Temp. Dist. In addition to the temporal aspect, we also analyze the spatial aspect of cellular network data for CL modeling on road segments. Based on location data of towers and roads, we visualize all 23,704 towers in Hefei and Hefei road network in Figure 2 to qualitatively show the spatial road network coverage of cell towers. Each dot represents one cell tower: a yellow dot indicates a higher amount of signaling data records generated in that tower and a red dot indicates a lower amount of that. We �nd that all major road segments’ cell towers have a large number of data records, making CL modeling easier. We �nd that the cell towers are distributed densely in the downtown area and sparsely in the suburban and rural areas. There are 48.3% of road segments and 67.9% of towers covering the downtown area (around 6% of the Hefei area). We also �nd that almost all downtown road segments are associated with at least one tower.
(b) Commercial Vehicle Interval
(a) Spatial Coverage of GPS
(b) Temporal Coverage of GPS
Fig 12: CDF of vehicular Updating Interval In Figure 12, we further investigate the distribution of the updating intervals for these two kinds of vehicles. For the private vehicles, their average updating interval is around 10.17 seconds; whereas for the commercial vehicles, their average updating interval is around 33.88 seconds. We qualitatively visualize the distribution of both private and commercial vehicle data on the road map in Figure 14 and 15 with their one-day data. We �nd that most of the road segments can be covered by either one of them. But a daily coverage is too coarse-grained for real-time CL modeling. To further evaluate their �ne-grained spatial and temporal distributions, we show their coverage in 5 min slots in Figure 13.
Fig 10: PV Uploading Fig 11: CV Uploading To quantitatively investigate spatial and temporal coverage of the cellular network, Figures 8 and 9 give spatial and temporal coverage rates on the road segment level of 288 5-minute slots upon a day. We �nd that (i) 83% of road segments in downtown Hefei (48.7% of the entire Hefei) have at least one data record for every 5 minutes; (ii) almost all regions have at least one data record for every one of 288 slots. Such a detailed spatiotemporal coverage makes real-time CL sensing based on cellular network very complete.
2.2
(a) Private Vehicle Interval
Vehicular System for Explicit Sensing
Based on our collaboration with a tech company, we have access to a vehicular network in Hefei with 2,887 private vehicles and 2,021 commercial vehicles, which are used to implement an explicit sensing approach for CL modeling.
Fig 13: Spatiotemporal Coverage of Vehicular Systems
4
EXIMIUS
SenSys ’18, November 4–7, 2018, Shenzhen, China Morning
Evening PV Road Coverage: 27.9% (1h)
Fig 14: Private Vehicle Dist.
CV Road Coverage: 13.8% (1h)
Fig 15: Commercial Vehicle Dist.
We �nd that under such a �ne-grained spatial and temporal granularity, coverage of explicit data is low, which makes it challenging for them to model CL in real time.
2.3
Contexts
2.4
Metrics: Crowdedness Level
Fig 16: Ground Truth Data
and transportation community [43] [27]. Formally, the CL is associated with a spatiotemporal combination, e.g., a 5minute time slot and a road segment, and is quanti�ed by a ratio of the extended travel time on this road segment for this particular time to the shortest travel time on this road segment during any time slot. Essentially, a bigger CL value indicates a longer travel time on the road segment. Spatial Partition: In this paper, we study CL on two di�erent levels: one is the road segment level where all road segments are given by Open Street Map; another is the Voronoi region level where all regions are given by a Voronoi graph. The road segment level CL works better for explicit vehicular sensing where we infer travel time on road segments and obtain CL directly; whereas the Voronoi level CL works better for implicit cellular sensing where we perform a more complicated inference process. We �rst �nd regions with at least one road segment within it (e.g., all Voronoi regions in the downtown have at least one road segment). For the region with multiple road segments, we then calculate a comprehensive CL by taking all road segments within this region into consideration and put weights on them according to the length of the road segment in this region. Compared to traditional spatial partition without logical contexts, such as straightforward grid partition, our context-aware partition enables a more balanced spatial units for CL modeling [36]. Temporal Partition: Considering the previous work [3] and the fact that 5-minute time slot is the �nest temporal granularity we can have due to updating frequency of the ground truth data we introduce later, we evaluate di�erent time slot lengths, i.e., 5, 10, and 20 minutes, in practical settings to test the performance of explicit sensing and implicit sensing on di�erent temporal granularity. Further, to put our inference into high-level context, we also consider time of day as factor to evaluate their impacts on CL inference.
To contextualize our CL modeling, we utilize two kinds of context data: (i) population, i.e., Worldpop data [32]; (ii) road networks, i.e., OpenStreetMap data [15]. Worldpop Data: Worldpop dataset is an open dataset [32], which provides static population with a spatial granularity of 100m⇥100m by fusing multiple data sources including survey data and satellite picture data. We visualize the population of Hefei in Figure 3. We �nd that most of the residents are living in the downtown area. Such a detailed dataset provides a valuable urban density context for us to understand the performance of implicit and explicit sensing approaches. The total population calculated by Worldpop data is 7.1 million, close to the population released by Hefei government. Open Street Map Data: OpenStreetMap data [15] contain detailed roads and POI (i.e., points of interest) information in Hefei. In the OpenStreetMap data, each road segment is assigned with one of eight types, i.e., Motorway, Trunk, Primary, Secondary, Tertiary, Residential, Unclassi�ed, and Service. Figure 17 gives the road types distribution in Hefei, and we �nd that 81.8 % of road segments are Motorway, Trunk, Primary, Secondary, Tertiary, and Residential, which can be covered by vehicular data we have. With the data from OpenStreetMap, we aim to understand the impact of di�erent road types on the performance of two sensing systems.
In this paper, we utilize crowdedness level (CL) to quantify the �nal results from these two kinds of sensing approaches. The CL has been widely used in the online map services [13]
5
SenSys ’18, November 4–7, 2018, Shenzhen, China
2.5
Z. Qin et al.
Ground Truth
For the evaluation purpose only, we have obtained datasets from one of the biggest navigation service companies in China. It provides real-time information about the crowdedness level of 47% of the road segments in the city, covering the entire downtown area of the city. Their real-time CL data are obtained by a proprietary solution based on data sources including tra�c cameras, loop sensors, �oating vehicles, etc. There are four di�erent CL values ranging from 1 to 4, denoting an increasing tra�c jam. Such detailed real-time CL data are very challenging to obtain at large-scale due to di�culty of extensive sensing infrastructures deployment[3]. We visualize all the road segments with the ground truth data in Figure 16 with four colors and we �nd that the ground truth data only cover the downtown area. During the evening rush hour from 8:00 to 9:00 pm, we have 89.0%, 8.7%, 1.5%, and 0.3% of road segments for four crowdedness levels, respectively. The lengths of di�erent road segments are shown in Figure 18, from which we �nd that almost 95% road segments have a length of shorter than 0.5 km, enabling a �ne-grained CL modeling.
Fig 17: Road Type Dist.
3
Fig 19: GPS and Signaling Trace of a User The left �gure visualizes the raw GPS data and the right �gure presents the trace of attached cell towers. We �nd that two traces have high-level similarity, but the trace based on signaling data is more uncertain. In particular, consider the fact that the length of most road segments in Hefei road networks is shorter than 0.5 km (Figure 18), and the coverage radius of a cell tower is roughly 300 meters, it is challenging for us to estimate travel time on the road segment level. This is because the coverage distance can be as long as 600 meters, which is even greater than the length of road segments. This leads to large estimation error considering that a cellphone user standing on the border of two cell towers can be attached to either tower at any time due to the congestion control of the cellular networks, leading to a phenomenon called “Ping-Pong E�ect” [17], meaning a cellphone user quickly moves between two cell towers. In order to better validate claims above, we analyze some statistic features from the traces of GPS and signaling data of this one user and present the results in Table 1. The Ref. speed is a reference average speed calculated by real physical trace distance (5.9km) and absolute travel time (691s). Table 1: Comparison of CL Estimation
Fig 18: Segment Lengths
Data GPS Signaling
EXIMIUS: DATA-DRIVEN MODELS
Since our measurement framework EXIMIUS is aimed to evaluate two kinds of urban sensing approaches, instead of designing a new sensing model, we utilize the sensing systems and their data introduced in the last section to implement two state-of-the-art models.
3.1
Ave. speed 10.0(m/s) 100.1(m/s)
Speed var. 33.6 18671.51
Travel time 669.0(s) 690.0(s)
Ref. speed 8.84(m/s) 8.84(m/s)
We �nd that the speed calculation based on signaling data cause larger error compared to GPS data, but travel time is relatively accurate. Besides, it is not reasonable to calculate travel time between short distances, especially for a distance shorter than the coverage radius of one tower, since it will be challenging either to distinguish the moving status of a cellphone user or to estimate the travel time precisely. Thus, we choose relative longer real-world road segments as our target roads and implement the algorithm in [19] with extra constraints. Based on Algorithm 1, we extract users who were actually traveling on vehicles by setting travel time and travel distance limits, then we can have all the cell pairs candidates in two driving directions. Actually, we �nd that setting limits for the distance of cell tower pairs is enough for outliers �ltering. For a speci�c user, there may be multiple records, so we implement an intuitive algorithm for the �nal travel
Model Driven by Implicit Sensing Data
Among several state-of-the-art models for CL modeling (traf�c condition modeling in general), we utilize the model from [19], which is the latest model using detailed cellular signaling data for travel time and crowdedness level inference. However, since this is a data-driven model, we utilize a few techniques to ensure our cellular signaling data can be used to implement this model. Intuitively, the travel time can be extracted by simply considering two timestamps from two di�erent cell towers. We show a test trace of a user with both GPS data and signaling data in Figure 19.
6
EXIMIUS
SenSys ’18, November 4–7, 2018, Shenzhen, China
Algorithm 1 Algorithm of selecting cell tower pairs tmax ( maximum travel time of target road segment tmin ( minimum travel time of target road segment distmax ( maximum distance of two cell towers distmin ( minimum distance of two cell towers T ( set of cell towers in proximity of target road for tower i in T do for tower j in T do if i , j and dismin distance(tower i , tower j ) dismax then Calculate direction of cell tower pairs Calculate travel time of cell tower pairs end if end for end for Return cell tower pairs satisfying all conditions
Fig 20: Example of Highway Segment aspect, we still consider the similar partition, i.e., time of the day. Inputs of the model are raw GPS data from private vehicles and commercial vehicles. They are formatted into traces by di�erent users and di�erent time periods. Di�erent from storing historical travel durations into entries, we store crowdedness level into entries for two reasons: i) we directly compare CL derived from signaling data in the end, so it would be more e�cient for us to store CL directly; ii) it is challenging to calculate travel durations given speci�c boundaries of polygon regions since the segmentation of trips is needed. However, after converting travel time to CL, we can easily obtain CL status by examining how the CL calculated by this trip contributes to the actual overall CL of the corresponding roads.
time calculation [19]. The main idea is to consider (i) the last signaling record attached to the departure cell tower, (ii) the �rst signaling record attached to the arrival cell tower, and (iii) the average travel time for di�erent users. We utilize a highway segment given in Figure 20 called national highway G206 to show an example of how to calculate the travel time based on signaling data [19]. This segment of national highway G206 has a total length of 8.2 km and the maximum speed for the road is 120 km/h (i.e., corresponding to a travel time of 4.2 minutes). There are 235 towers in proximity and 1,618 di�erent road segments on this road, and 9,153 users during a day recorded by signaling log. The maximum number of records for a single user is 2,252; the minimum number is 2; the average number is 40. Based on the travel time calculation algorithm, we then convert the resultant travel time into the CL by speed ranges of four CLs.
3.2
Algorithm 2 Algorithm of travel time prediction T ( All traces of users P ( All Voronoi polygons M ( Matrix storing historical CL data mpt ( CL of time period t and polygon region p for trace in T do Convert travel time to CL if mpt does not exist then Create an entry under this context Assign value of CL to the entry else mpt exists Append value of current CL to mpt end if end for Update M with weighted entries return M
Model Driven by Explicit Sensing Data
Based on explicit sensing data, we implement a travel time estimation model to obtain CLs for all road segments with di�erent time intervals. Given the historical GPS data we have and features of these data, we implement the model from [3] as our explicit sensing model, where an algorithm focusing on creating a prediction table by referring to historical GPS data at the same region partitioned and similar time is introduced. Even though some models are proposed recently [42], they either require additional datasets or their model descriptions are at a high level, and cannot be implemented with details for a fair comparison. During the implementation of our explicit sensing model, we utilize a spatial partition based on Voronoi polygons generated by locations of cell towers in order to provide a fair comparison with signaling data. As for the temporal
Note that we do not average all the historical data directly, instead we consider the values of di�erent CL within speci�c time and location to improve the accuracy in our case. The detailed are given in Algorithm 2 [3].
4
MEASUREMENT RESULTS
In this section, we show our measurement results from CL modeling. In order to comprehensively compare these two
7
SenSys ’18, November 4–7, 2018, Shenzhen, China
Z. Qin et al. Table 3: Comparison of CL Estimation
kinds of sensing approaches, we consider several factors affecting the performance of tra�c sensing, i.e., evaluation sites (Subsection 4.1), spatial impacts (Subsection 4.2), temporal impacts (Subsection 4.3), and contextual information (Subsection 4.4).
4.1
Context Accuracy (Explicit) (%) Coverage (Explicit) (%) Accuracy (Implicit) (%) Coverage (Implicit) (%) Explicit CL var. Implicit CL var. Ground Truth CL var.
Comparisons on Four Evaluation Sites
Since di�erent road types typically have di�erent speed limits and tra�c volume capacities, we perform a data-driven investigation of four kinds of road types based on Hefei road networks. We report our results in detail based on four roads from four kinds of these road types. These four roads have di�erent road lengths from 0.9 km to 2.6 km, and have different number of road segments from 395 to 2,782, and are from di�erent urban regions around the city, i.e., commercial area, residential area, industrial area, and airport highway area. By considering all these possible features regarding road segments we can make sure our evaluation sites are representative. The average statistical characteristics from these four roads are given in Table 2. Road 1 avenue 2.23 1595 273 14,921 403 76,615 3,504,747
Road 2 main ave. 1.9 395 509 11,342 365 92,976 4,126,435
Road 3 motorway 0.9 1709 680 65,314 804 240,549 10,429,728
Road 2 97.2 45.8 73.6 100 0.31 0.03 0.18
Road 3 98.6 45.8 62.5 100 0.26 0.04 0.22
Road 4 98.6 86.1 73.6 100 0.08 0.16 0.05
overall temporal coverage rates are smaller than these of implicit sensing data, explicit sensing data enable a sensing approach with better accuracy, which veri�es our previous observation that cellphone-based implicit sensing has better coverage, but vehicle-based explicit sensing has higher accuracy. Further, by calculating the CL variance, we �nd that a smaller variance normally corresponds to a higher estimation accuracy in both cellphone-based implicit sensing and vehicle-based explicit sensing for the CL estimation.
4.2
Spatial Factors
Tra�c sensing is also heavily a�ected by following spatial factors: (i) urban region functions, e.g., the downtown area may be more crowded, and a rural area may be less crowded; (ii) road lengths, e.g., the longer road may have more vehicles and more cellphone users to contribute data; (iii) road types, e.g., the highway may have less tra�c jam compared to other road types. Thus, we further explore impacts of spatial contextual information on two sensing approaches. Based on Figure 21, the CL prediction results from both sensing approaches indicate that highway has a higher prediction accuracy than other road types, e.g., Road 4 has the best performance. Further, the road length may have a big impact on the prediction results since the shortest Road 3 has the biggest Mean Absolute Percentage Error (MAPE) value compared to other roads. For all results, it seems that the MAPE value is inversely proportional to road lengths, indicating that the CL prediction on a shorter road segment may cause larger errors. This is because there are fewer data points when the road is shorter, sparse data points may bring biases since they cannot accurately re�ect the real tra�c status of road segments. Finally, the cellphone-based implicit sensing has a lower CL prediction accuracy in general compared to vehicle-based explicit sensing except for the highway, which contains enough signaling data across cell towers to estimate CLs. In addition to road-based setting, we also implement a regionbased CL prediction for these two approaches based on Voronoi regions. For cellphone-based implicit sensing, we calculate user density and population density from Worldpop data, also consider CLs inferred by users’ switching between di�erent towers, and then implement prediction by a regression model. For vehicle-based explicit sensing, we implement
Table 2: Statistics of Road Segments Context Road type Road len.(km) # of segment # of GPS users # of GPS recs # of towers # of tele users # of tele recs
Road 1 98.6 44.4 61.1 100 0.52 0.22 0.17
Road 4 highway 2.6 2782 710 81,100 1017 246,324 10,723,447
To compare cellphone-based explicit sensing and vehiclebased implicit sensing, we combine private vehicles GPS data and commercial vehicles GPS data together as vehicular data to implement the explicit CL sensing model described in Section 3.2. We compare this model with the implicit CL sensing model based on the telecommunication data, i.e., signaling data, described in Section 3.1. From the table above, we �nd that in our dataset, the implicit sensing data, i.e., signaling data, have much more records and users logged during a day compared to the explicit sensing data, i.e., vehicle GPS data. One reason is that we have much more cellphone users than car users; another reason is that signaling data update much more frequently, leading to a higher temporal coverage rate. With these data, we calculate the results of the CL inference of these four sample roads and then compare them with the ground truth data introduced in Section 2.5. The detailed results are summarized in Table 3. From the above results, we �nd that with a 5-minute slot length setting, the temporal coverage rate of vehicle-based explicit sensing is lower than that of cellphone-based implicit sensing across all evaluation roads. Even though their
8
EXIMIUS
SenSys ’18, November 4–7, 2018, Shenzhen, China these two hours are the most crowded time period in one day. We calculate the variance of Ground Truth CL of 6 hours on the same regions, and we �nd that these two hours have relatively higher variance than other four hours. As a result, a lower �uctuation may provide a better estimation of the CLs due to better sensing.
Fig 21: Road Accuracy
Fig 22: Region Accuracy
a state-of-the-art model [3] by �rst partitioning the whole city in 5 thousand grids and then locating Voronoi regions in these grids, saving time to locate the entries of each GPS point for the later prediction. Once we obtain a user’s location, we �rst locate it in large grid partitions, and then locate its associated Voronoi polygon. Finally, we store each user’s speed and timestamp as an entry into matrix. Results from two data sources are shown in Figure 22 based on a 5minute time slot temporal partition. Based on the results, we �nd that for region-based CL sensing, vehicle-based explicit sensing still outperforms cellphone-based implicit sensing, which is consistent with our previous observation.
4.3
Fig 23: CL Prediction
Fig 24: Gaode CL Dist.
For cellphone-based implicit sensing, we show the impact of di�erent time slot lengths on the CL prediction results in Figure 25. We �nd that as we increase the length of the time slot from 5 to 20 minutes, MAPE generally decreases. This is because the CL in a longer time slot, e.g., 20 minutes, is easier to predict due to less �uctuation and more data collected compared to the CL in a shorter time slot, e.g., 5 minutes. Further, we explore the CL prediction results during di�erent time of day in Figure 26. In particular, we average the accuracy within an hour based on di�erent time slot lengths. We �nd that generally 8h00 and 18h00 have higher prediction error. This is because these two hours are with highly dynamic tra�c demand across the city and even the ground truth varies signi�cantly during short time periods, which lead to higher prediction errors.
Temporal Factors
Di�erent time of day can directly a�ect tra�c status, e.g., tra�c will be more crowded during rush hours. Since the CLs of the rush hours are more important due to the potential higher tra�c demand, we study the temporal contexts during six hours, i.e., 6-7, 7-8, and 8-9 in the morning representing the morning rush hours; 16-17, 17-18, and 18-19 in the afternoon representing the evening rush hours. The time slot length, as another temporal factor, is also vital to our tra�c sensing performance. We use 5, 10, and 20 minutes time slots to test their performance on di�erent temporal granularity. In all, we show the CL prediction performance at both di�erent time of day, and in di�erent time slots. Based on our previous Voronoi region partition, we investigate the tra�c CL prediction based on Voronoi regions by randomly selecting 1,000 regions in Hefei downtown area where Ground Truth data are available with their speci�c features on the Voronoi polygon size, the number of cellphone users, and the number of population from Worldpop data. In particular, we divide a one-month CL dataset into 29-day training data and 1-day testing data, and after rotating the test data among 30 days, the average results were reported. In Figure 23, we show estimation MAPE of the 1,000 regions from downtown area during morning and evening rush hours in 5-minute slots, based on historical CL data. We �nd that the MAPE values are similar in these six rush hours. Further, 08h00 and 18h00 have higher MAPE compared to other four rush hours, respectively. These results match the trend of CL during a day in Figure 24 (where 1 means no tra�c jam and 4 denotes heavy tra�c jam), showing that
Fig 25: Temp. of Phone
Fig 26: 6 Hour of Phone
For vehicle-based explicit sensing, we show the impact of di�erent time slot lengths on the CL prediction results in Figure 27 and the impact of time of day on CL prediction results in Figure 28. We �nd some similar trends as results from cellphone-based implicit sensing. In particular, a relative long time slot leads to a smaller MAPE value, i.e., higher CL prediction accuracy. Similarly, 8h00 and 18h00 have relatively lower prediction accuracy, matching the results from cellphone-based implicit sensing due to high tra�c demand. Finally, we compare results of vehicle-based explicit sensing and cellphone-based implicit sensing. We �nd that as
9
SenSys ’18, November 4–7, 2018, Shenzhen, China
Z. Qin et al.
shown by Figure 25 and Figure 27, given the same temporal granularity, i.e., the same time slot length, vehicle-based explicit sensing has a lower MAPE (i.e., higher accuracy). Similarly, as shown by Figure 26 and Figure 28, we �nd for the same time of day, vehicle-based explicit sensing has a lower MAPE compared to cellphone-based implicit sensing. The above results indicate that given the same time of day and the same time slot length, vehicle-based explicit sensing has better performance in terms of CL prediction than cellphone-based implicit sensing.
road segments. We �nd that the MAPE increases (i.e., CL prediction accuracy decreases) if there are a higher population or more users in the polygon, indicated by Figure 32 and 33.
Fig 27: Temp. of Vehicle Fig 28: 6 Hour of Vehicle Besides, we also show estimation results from non-rush hours upon our four sample roads by implicit sensing (Figure 29) and explicit sensing (Figure 30), compared to the Ground Truth data from the navigation service provider. We �nd that generally, explicit sensing has better performance than implicit sensing and Road 4 (highway) has a smaller estimation error. One possible explanation is that for the non-rush hour, the implicit sensing is only based on limited cellphone data, which leads to poorer performance.
Fig 32: Population
Fig 33: User Number
Fig 34: Integration
4.5
Integration of Two Sensing Approaches
Based on these two sensing approaches, we discuss the possibility of integrating two sensing approaches by one general model. Considering that we can infer CL by either cellphonebased implicit sensing or vehicle-based explicit sensing, we then have two di�erent time series of CL. In this case, two CL series are complementary to each other if one (i.e.,vehiclebased explicit sensing) lacks enough coverage rates under a speci�c temporal period and the other (i.e., cellphone-based implicit sensing) lacks accurate measurements. Intuitively, fusing two time series can have a better spatiotemporal coverage than themselves alone. Further, more travel time records within certain regions can essentially reveal more information regarding actual tra�c condition. In particular, we convert speeds to CLs according to a standard provided by the navigation service provider, which considers both road segments types and corresponding speed limits. We then have two series of CL data from signaling and GPS. For each time slot, if there is only one value from two series, we use this value; if there are two values, we take average of the two values. By this fusion we have better spatiotemporal coverage, estimation and prediction accuracy. We show an example here by taking consideration of both signaling data and GPS data as traces of users to estimate and predict CL in four roads we mentioned above. The results are shown in the following Table 4. The estimation part here is to directly calculate CLs by both cellphone-based implicit sensing and vehicle-based explicit sensing. For the signaling data, we consider traces of moving users and their average
Fig 29: Temp. of Implicit Fig 30: Temp. of Explicit
4.4
Fig 31: Polygon Size
Contextual Factors
Tra�c sensing may also be in�uenced by other contextual factors, such as region size, population density, and user density, e.g., more users may indicate a higher tra�c volume. We show how the contextual information in�uences the �nal inference result, aiming to provide insights into how to improve CL inference accuracy. Based on the Voronoi regions, we present our prediction results from ascending sorted polygon sizes, population density, and user density. The results are in Figures 31, 32 and 33, respectively. It is shown in Figure 31 that MAPE decreases as regions’ sizes increase, which indicates larger regions can have better CL prediction accuracy, it is because larger regions include more
10
EXIMIUS Table 4: Comparison of CL Estimation and Prediction MAPE GPS (%) Estimate Signaling (%) Fusion (%) GPS (%) Predict Signaling (%) Fusion (%)
Road 1 56.3 31.9 23.6 29.5 30.3 28.2
Road 2 57.6 14.6 17.4 32.1 32.1 32.4
Road 3 42.3 20.8 18.1 37.5 37.9 37.2
SenSys ’18, November 4–7, 2018, Shenzhen, China general, cellular networks as an example of implicit sensing have better spatial coverage than vehicular networks as an example of explicit sensing. However, the spatial coverage of cellular networks is �xed because of the stationary natures of cell towers. In contrast, the spatial coverage of vehicular networks is dynamic due to mobile natures of vehicles. This indicates cellular networks can cover more regions, but vehicular networks are more �exible. Temporal Coverage: As shown in Figures 9 and 13, we �nd that for cellular networks as implicit sensing, their temporal coverage is very high for some regions, indicating cellular networks always have data for these regions. However, for some remote regions, if there is no cell tower deployed in these regions, their temporal coverage is always 0. In contrast, for vehicular networks as explicit sensing, they have covered almost all regions, but the distribution is nonuniform, e.g., lots of regions with 20 slots covered among 288 slots, making it less ideal for continuous modeling. Performance Comparison: We �nd that the prediction results for crowdedness levels by explicit sensing and implicit sensing approaches have their own advantages and disadvantages, in terms of coverage and accuracy. Which approach to use should be based on a set of factors related to system availability, cost, granularity, etc. Our study reveals some advantages of either explicit or implicit sensing in some concrete settings, and the details can be found among measurement results. Data Collection: All the data used in this project are legally collected by the service providers. The data from commercial vehicles are collected by a logistic company who owns and manages these vehicles. The private vehicle data are collected by a large insurance company by an onboard device and smartphone app, and all customers are informed about data collection and agreed to provide their data for the company and its business partners for business analyses. In return, they received monthly premium reductions. Finally, all the cellular signaling data are also collected under the consent of the cellphone users by signing the contracts. More Implicit and Explicit Sensing: Due to limited data access, we only consider a cellular network as an example of implicit sensing and a vehicular network as an example of explicit sensing. However, our framework can also be generalized by other real-world datasets, which can be treated as explicit and implicit sensing data. We aim to further explore other urban systems to improve our analysis, if the system users opt to participate under privacy preserving mechanisms, e.g., (i) image data from the tra�c cameras or the cameras inside the transit systems as implicit sensing. (ii) data of a growing bicycle network with 8,000 bicycles in Hefei for rentals using the smart cards as implicit sensing. (iii) CDR data and cellular tra�c data collected from telecommunication systems.
Road 4 11.1 23.6 9.7 7.1 11.5 6.9
travel time; for the GPS data, we obtain users’ speeds and convert it into CLs. We �nd that, generally, MAPE values decrease by using two datasets for an integrated sensing approach. We also fuse two data sources on the Voronoi region level. In particular, based on a speci�c data source (e.g., the cellphone signaling data), we integrate calculated CLs from di�erent road segments on the same Voronoi region based on the method introduced in Section 2.4. For each region, we calculate a comprehensive CL by considering all road segments within this region and put weights on them based on the road segment length in this region. We then perform the similar process based on the other data source (e.g., the vehicular GPS data), and �nally we use the average CL from these two methods as our �nal CL result in this particular region. The results are given in Figure 34. We �nd that by combing two datasets as an integrated sensing approach, it outperforms both individual sensing approaches based on GPS or signaling data alone. We expect a more sophisticated fusion approach which will further improve the results by considering the weights on di�erent data sources instead of a straightforward averaging approach, which is out of the scope of this work and will be considered in our future work due to space limitation.
5
DISCUSSIONS AND LESSONS LEARNED
In this section, we discuss a few insights we obtained in our measurement study and some lessons learned. Limitations: In this work, we only use data from a particular city Hefei for a measurement study for explicit and implicit sensing, so the results and conclusions obtained in this work may only apply to Hefei and cities with similar features, such as spatiotemporal coverage of data, updating frequency of data, population distribution, etc. We believe if the key factors such as statistic features of vehicular and cellular data, and contextual information are similar among cities, our results then can be generalized because they are the basis of all the above analyses. Further, we study the traf�c conditions based on pre-de�ned spatial partitions, which may not be the optimal partition for tra�c condition modeling. However, in general, how to partition cities into di�erent regions to understand tra�c condition or human mobility is still an open question [3]. Spatial Coverage: As shown in Figures 8 and 13, cellular and vehicular networks have di�erent spatial coverages. In
11
SenSys ’18, November 4–7, 2018, Shenzhen, China
Z. Qin et al.
Privacy: While understanding tra�c condition is bene�cial for city residents, we have to protect the privacy of involved residents, i.e., cellphone users and vehicle drivers. In this project, all data analyzed are anonymized by the data provider and the analyzed data cannot be used to trace back to individual cellphone users or private and commercial drivers; we only process data related to tra�c condition modeling and delete other non-relevant information to reduce risk; �nally, in this work, all our analysis results on tra�c conditions are given at aggregated cell tower or road segment levels instead of location for a speci�c timestamp, thus they cannot be used to trace back to individuals.
6
to use their cellphones. For example, the �rst set of work utilizing cellular data [28] to estimate the tra�c conditions is based on the idea of utilizing mobile phones as tra�c probes because this infrastructure is already in place in most urban areas, e.g., tra�c speed information can be obtained by passively monitoring data transmission in the cellular network. Further, Janecek et al. [18] [19] utilize signaling data from both active and inactive cellphone users to infer tra�c jam and achieved gain in coverage and accuracy by performing two-stage estimation on signaling data. Summary: As we have shown in our work, both of these two approaches have strengths and weaknesses, and we need to carefully examine features of a particular city and sensing infrastructures for the best results of tra�c modeling in a real-world setting.
STATE OF THE ART
In general, there are many approaches in estimating and predicting real-time tra�c conditions based on di�erent sensing systems and their data. In this paper, we divide them into two categories, i.e., explicit sensing and implicit sensing. Explicit Sensing: To explicitly sense the tra�c conditions, many systems have been proposed. There are online map services, e.g., Google Map[13] and Gaode Map[12], which are mostly based on crowd-sourcing and smartphone apps. They utilize their users’ GPS locations and speeds to model and predict tra�c speeds with good accuracy. Another major direction is about onboard GPS devices in both private cars and commercial vehicles such as taxis [3], buses [47] and trucks [4][30]. In particular, Aslam et al. [1] present a system to use taxis as roving sensors to infer city-scale traf�c conditions. Besides, tra�c infrastructures (such as loop sensors and tra�c cameras) are the most direct methods for tra�c volume and tra�c speed modeling [9]. For example, researchers propose various models for tra�c estimation based on the image data obtained by tra�c cameras and achieved high accuracy [7][23]. However, as we show in our measurement results, these solutions have the problems with low penetration rates and uncertain mobility patterns of sensing devices, e.g., vehicles and smartphone users. Implicit Sensing: The key rationale for implicit sensing is low-cost data collection and high spatiotemporal coverage. For example, the telecommunication infrastructure has been utilized to infer tra�c conditions given that there are already massive datasets collected from telecommunication systems, e.g., Call Detail Record (CDR) [37], WiFi data [34], signaling data [18][19][8], etc. These datasets reveal coarse-grained locations and time associated with these locations, which can be used to infer tra�c conditions. Moreover, these infrastructure data are almost free, since they are automatically collected by existing infrastructures [10]. Considering the ubiquity of cellphones, cellular data thus have extremely high spatiotemporal rates. There are data records as long as there are people with cellphones and they even do not have
7
CONCLUSION
In this paper, by designing and implementing EXIMIUS, we utilize two large-scale urban systems and tra�c crowdedness level as examples to quantify, measure, and understand both explicit and implicit urban sensing approaches. Our EXIMIUS is based on a 3-million-user cellphone network and a 6-thousand-vehicle network along with their 1TB log data and various context data to provide a few novel insights on explicit and implicit urban sensing. Based on our measurements and comparative results in Hefei, we share a few lessons learned, which we believe will help fellow researchers when choosing from explicit and implicit urban sensing approaches. First, neither explicit vehicle-based sensing nor implicit cellphone-based sensing can provide both high spatiotemporal coverage and high accuracy for tra�c crowdedness level modeling. The explicit vehicle-based sensing has better accuracy whereas the implicit cellphone-based sensing has higher spatiotemporal coverage. Second, various urban context information, e.g., population, road types, the rush hours, functions of regions, can provide additional accuracy and coverage, but their impacts on explicit vehiclebased sensing and implicit cellphone-based sensing are quite di�erent. Last but not least, we show that a straightforward hybrid approach by combining explicit vehicle-based sensing and implicit cellphone-based sensing only on data level can provide signi�cant improvement for both spatiotemporal coverage and accuracy.
ACKNOWLEDGMENTS
This work is partially supported by Rutgers Global Center, Rutgers Research Council, China 973 Program (2015CB352400), National Natural Science Foundation of China (NSFC) 41401470, 61772026 and 61332018, and National Key R&D Program of China 2018YFB0803400.
12
EXIMIUS
SenSys ’18, November 4–7, 2018, Shenzhen, China
REFERENCES
[19] J������, A., V������, D., H�����, K. A., R�������, F., ��� H������, H. The cellular network as a sensor: From mobile phone data to real-time road tra�c monitoring. IEEE Transactions on Intelligent Transportation Systems 16, 5 (2015), 2551–2572. [20] J��, M., H�, Y., F���, D., C���, X., M���, X., ��� X���, T. iguard: A real-time anti-theft system for smartphones. IEEE Transactions on Mobile Computing (2018). [21] K��, G., M������, H., W���, Y., C���, Y., X�, W., G�������, M., ��� V�, T. Detection of on-road vehicles emanating gps interference. In Proceedings of the 2014 ACM SIGSAC Conference on Computer and Communications Security (2014), ACM, pp. 621–632. [22] L���, N. D., X�, Y., L�, H., H�, S., C��������, T., C�������, A. T., ��� Z���, F. Enabling large-scale human activity inference on smartphones using community similarity networks (csn). In Proceedings of the 13th international conference on Ubiquitous computing (2011), ACM, pp. 355–364. [23] L�, L., C���, L., H����, X., ��� H����, J. A tra�c congestion estimation approach from video using time-spatial imagery. In Intelligent Networks and Intelligent Systems, 2008. ICINIS’08. First International Conference on (2008), IEEE, pp. 465–469. [24] L��, S., L��, Y., N�, L., L�, M., ��� F��, J. Detecting crowdedness spot in city transportation. IEEE Transactions on Vehicular Technology 62, 4 (2013), 1527–1539. [25] M���, C., C��, Y., H�, Q., S�, L., ��� G��, J. Travel purpose inference with gps trajectories, pois, and geo-tagged social media data. In Big Data (Big Data), 2017 IEEE International Conference on (2017), IEEE, pp. 1319–1324. [26] M�������������, H., G������, O., M���, D., B������, R., ��� W���, G. E�ectiveness of a task-based residential energy e�ciency program in oahu. [27] P����������, S., M������, A., ��� T������, N. Tracking people in highly dynamic industrial environments. IEEE Transactions on Mobile Computing (Issue: 99) (2016). [28] R���, G. Mobile phones as tra�c probes: practices, prospects and issues. Transport Reviews 26, 3 (2006), 275–291. [29] S����, S. A. M., S�����, S. A., ��� I������, H. Recent survey on crowd density estimation and counting for visual surveillance. Engineering Applications of Arti�cial Intelligence 41 (2015), 103–114. [30] S��, Q., ��� A�����A��, M. Big data applications in real-time tra�c operation and safety monitoring and improvement on urban expressways. Transportation Research Part C: Emerging Technologies 58 (2015), 380–394. [31] ��������. Number of internet users who used the internet for route planning,to access maps or road maps (e.g. google maps) in germany from 2013 to 2016, by frequency (in millions). https://www.statista.com/statistics/432169/ online-route-planning-and-map-usage-eg-google-maps-germany, 2017. [32] T����, A. J. Worldpop, open data for spatial demography. Scienti�c data 4 (2017), 170004–170004. [33] T����������, A., R�����������, L., B�����������, H., M�����, S., ��� G����, L. Accurate, low-energy trajectory mapping for mobile devices. [34] T����������, A., R�����������, L., L�C����, K., M�����, S., B��� ���������, H., T�����, S., ��� E�������, J. Vtrack: accurate, energyaware road tra�c delay estimation using mobile phones. In Proceedings of the 7th ACM conference on embedded networked sensor systems (2009), ACM, pp. 85–98. [35] US DOT. Cv pilots take advantage of multiple communication media. https://www.its.dot.gov/pilots/cvp_media.htm, 2017. [36] W���, D., Z����, W., Y��, Z., X��, D., ��� L��, X. Spatio-temporal dynamics of population in shanghai: A case study based on cell phone
[1] A����, J., L��, S., P��, X., ��� R��, D. City-scale tra�c estimation from a roving sensor network. In Proceedings of the 10th ACM Conference on Embedded Network Sensor Systems (2012), ACM, pp. 141–154. [2] A����������, F. Voronoi diagramsâĂŤa survey of a fundamental geometric data structure. ACM Computing Surveys (CSUR) 23, 3 (1991), 345–405. [3] B����, R. K., N�����, K. X., ��� J����, L. Real-time trip information service for a large taxi �eet. In Proceedings of the 9th international conference on Mobile systems, applications, and services (2011), ACM, pp. 99–112. [4] C�����, P. S., Z����, D., ��� L�, S. Urban tra�c modelling and prediction using large scale taxi gps traces. In International Conference on Pervasive Computing (2012), Springer, pp. 57–72. [5] C���, C. P., Z���, J., ��� Z���, W. A real-time vehicle navigation algorithm in sensor network environments. IEEE Transactions on Intelligent Transportation Systems 13, 4 (2012), 1657–1666. [6] C����, Y., C���, K., Z����, B., L����, C.�J. M., J����, X., ��� Z���, F. Accurate real-time occupant energy-footprinting in commercial buildings. In Proceedings of the Fourth ACM Workshop on Embedded Sensing Systems for Energy-E�ciency in Buildings (2012), ACM, pp. 115– 122. [7] C��������, R., P�������, M., ��� M����, P. Image analysis and rulebased reasoning for a tra�c monitoring system. IEEE Transactions on Intelligent Transportation Systems 1, 2 (2000), 119–130. [8] D�������, T., F����, R., V���, F., ��� E����, T. Estimating urban road tra�c states using mobile network signaling data. In Abstract book of the 20th International Conference on Intelligent Transportation Systems (2017). [9] D�, R., C���, C., Y���, B., L�, N., G���, X., ��� S���, X. E�ective urban tra�c monitoring by vehicular sensor networks. IEEE Transactions on Vehicular Technology 64, 1 (2015), 273–286. [10] F�, M., K����, J. A., ��� C�����, J. P. Estimating annual average daily tra�c and transport emissions for a national road network: A bottom-up methodology for both nationally-aggregated and spatiallydisaggregated results. Journal of Transport Geography 58 (2017), 186– 195. [11] G��, Y., S����������, K., C��, Z., ��� S�, L. Predictive tra�c assignment: A new method and system for optimal balancing of road tra�c. In Intelligent Transportation Systems (ITSC), 2015 IEEE 18th International Conference on (2015), IEEE, pp. 400–407. [12] G����. Gaode map. https://ditu.amap.com, 2017. [13] G�����. Google map. https://www.google.com/maps, 2017. [14] H���������, H., Q��, Z., S�����, T., ��� K�������, B. Large-scale distributed dedicated-and non-dedicated smart city sensing systems. IEEE Sensors Journal 17, 23 (2017), 7649–7658. [15] H�����, M., ��� W����, P. Openstreetmap: User-generated street maps. IEEE Pervasive Computing 7, 4 (2008), 12–18. [16] I����, Y., S������, A., I����, T., ��� K���������, K. Indoor emergency evacuation service on autonomous navigation system using mobile phone. In Universal Communication, 2008. ISUC’08. Second International Symposium on (2008), IEEE, pp. 79–85. [17] I��������, T., V����, A. M., N���, A., ��� C�����, R. A location-based vertical handover algorithm for limitation of the ping-pong e�ect. In Networking and Communications, 2008. WIMOB’08. IEEE International Conference on Wireless and Mobile Computing, (2008), IEEE, pp. 385– 389. [18] J������, A., H�����, K. A., V������, D., R�������, F., ��� H������, H. Cellular data meet vehicular tra�c theory: location area updates and cell transitions for travel time estimation. In Proceedings of the 2012 ACM Conference on Ubiquitous Computing (2012), ACM, pp. 361–370.
13
SenSys ’18, November 4–7, 2018, Shenzhen, China
[37]
[38] [39]
[40] [41]
[42]
[43]
[44]
[45]
[46]
[47] [48]
Z. Qin et al.
signaling data. In Big Data Support of Urban Planning and Management. Springer, 2018, pp. 239–254. W���, H., C��������, F., D� L������, G., ��� R����, C. Transportation mode inference from anonymized and aggregated mobile phone call detail records. In Intelligent Transportation Systems (ITSC), 2010 13th International IEEE Conference on (2010), IEEE, pp. 318–323. W�, J., L�, K., J����, Y., L�, Q., S����, L., ��� S��, Y. Large-scale battery system development and user-speci�c driving behavior analysis for emerging electric-drive vehicles. Energies 4, 5 (2011), 758–779. X��, X., Z����, F., ��� Z����, D. Privatehunt: Multi-source datadriven dispatching in for-hire vehicle systems. Proceedings of the ACM on Interactive, Mobile, Wearable and Ubiquitous Technologies 2, 1 (2018), 45. Y���, J., N����, B., ��� L��, M. Surface street tra�c estimation. In Proceedings of the 5th international conference on Mobile systems, applications and services (2007), ACM, pp. 220–232. Z���, H., ��� B����, J. Anonymization of location data does not work: A large-scale measurement study. In Proceedings of the 17th annual international conference on Mobile computing and networking (2011), ACM, pp. 145–156. Z����, D., Z���, J., Z����, F., ��� H�, T. Urbancps: a cyber-physical system based on multi-source big infrastructure data for heterogeneous model integration. In Proceedings of the ACM/IEEE Sixth International Conference on Cyber-Physical Systems (2015), ACM, pp. 238–247. Z����, T., L���, N., ��� B�������, S. A vehicle-based measurement framework for enhancing whitespace spectrum databases. In Proceedings of the 20th annual international conference on Mobile computing and networking (2014), ACM, pp. 17–28. Z���, Y., L�, S., H�, S., S�, L., Y��, S., S���, H., W���, H., ��� A������� ���, T. Greendrive: A smartphone-based intelligent speed adaptation system with real-time tra�c signal prediction. In Cyber-Physical Systems (ICCPS), 2017 ACM/IEEE 8th International Conference on (2017), IEEE, pp. 229–238. Z����, Z., W���, D., P��, J., Y���, Y., F��, C., ��� X���, F. Urban tra�c prediction through the second use of inexpensive big data from buildings. In Proceedings of the 25th ACM International on Conference on Information and Knowledge Management (2016), ACM, pp. 1363–1372. Z���, P., Z����, Y., ��� L�, M. How long to wait?: predicting bus arrival time with mobile phone based participatory sensing. In Proceedings of the 10th international conference on Mobile systems, applications, and services (2012), ACM, pp. 379–392. Z���, P., Z����, Y., ��� L�, M. How long to wait? predicting bus arrival time with mobile phone based participatory sensing. IEEE Transactions on Mobile Computing 13, 6 (2014), 1228–1241. Z��, Y., C���, C., ��� G��, M. An evaluation of vehicular networks with real vehicular gps traces. EURASIP Journal on Wireless Communications and Networking 2013, 1 (2013), 190.
14