Expected Dependency Pair Match: Predicting translation quality with expected syntactic structure Jeremy G. Kahn (
[email protected]) University of Washington
Matthew Snover (
[email protected]) University of Maryland
Mari Ostendorf (
[email protected]) University of Washington Abstract. Recent efforts aimed at improving over standard machine translation evaluation methods (BLEU, TER) have investigated mechanisms for accounting for allowable wording differences either in terms of syntactic structure or synonyms/paraphrases. This paper explores an approach for combining scores from partial syntactic dependency matches with standard local n-gram matches using a statistical parser, and taking advantage of parse probabilities in deriving expected scores based on the N-best parses for the hypothesized sentence translation. The new scoring metric, Expected Dependency Pair Match (EDPM), is shown to be superior to BLEU and TER in terms of correlation to human judgements and as a perdocument and per-sentence predictor of HTER, using mean subtraction to account for document difficulty. Further, we explore the potential benefit of combining the n-gram and syntactic features of EDPM with the alternative wording features of TERp, with experiments showing that there is a benefit to accounting for syntactic structure on top of the semantic equivalency features. Keywords: machine translation evaluation, syntax, dependency trees
1. Introduction Machine translation (MT) evaluation is a challenge for research because the space of good translations is large, and two equally good translations may appear to be quite different at first glance. The challenges of choosing among translations are compounded when this evaluation is done automatically. Human evaluation, however, is both timeconsuming and difficult, so research has turned increasingly towards automatic measures of translation quality, usually by comparing the system translation to one or more reference (human) translations. Automatic measures of this kind not only provide a well-defined evaluation standard but are also required for training on error criteria, e.g. with minimum error rate training (Och, 2003). c 2009 Kluwer Academic Publishers. Printed in the Netherlands.
mtjournal.tex; 15/05/2009; 15:03; p.1
2
Kahn, Snover & Ostendorf
Currently, the most popular evaluation measures include a measure based on n-gram precision known as BLEU (Papineni et al., 2002) and the edit-distance measure Translation Edit Rate (TER) (Snover et al., 2006). Recent research has found that these measures may not accurately track translation quality both empirically (Charniak et al., 2003) and theoretically (Callison-Burch, 2006). These challenges have motivated a search for better measures that incorporate additional language knowledge sources. METEOR (Banerjee and Lavie, 2005), for example, uses synonym tables and morphological stemming to do progressively more-forgiving matching. It can be tuned towards recall or precision, but is generally not tuned by users. TERp (Snover et al., 2009) is an extension of the previously-mentioned TER that also incorporates synonym sets, along with automaticallyderived paraphrase tables. TERp is explicitly intended to be tuned to a development set by users. Tuning has the advantage that the weight of different types of errors can be adjusted to match the needs of the task, though it makes it more difficult to compare results across tasks, particularly when there is little data for tuning. As an alternative to these synonym- and paraphrase-based approaches, other metrics model syntactically-local (rather than string-local) wordsequences. Liu and Gildea (2005) compared tree-local n-gram precision in various configurations of constituency and dependency trees. The dependency-based SParseval measure (Roark et al., 2006), designed as a parse-quality metric for speech, is a similar approach, in that it is an F-measure over a decomposition of reference and hypothesis trees. Owczarzak et al. (2007) proposed d and d var measures that compare LFG-derived relational tuples from reference and hypothesis translations and reported substantial improvement in correlation with human judgment relative to BLEU and TER. These syntactically-oriented measures require a system for proposing dependency structure over the reference and hypothesis translations. Some (Liu and Gildea, 2005; Roark et al., 2006) use PCFG parsers with deterministic head-finding, while others (Owczarzak et al., 2007) extract the semantic dependency relations from an LFG parser (Cahill et al., 2004). This work extends the dependency-scoring strategies of Roark et al. (2006) and Owczarzak et al. (2007) using a widely-used and publically available PCFG parser and deterministic head-finding rules. We may evaluate automatic MT measures in a variety of ways. Some (Banerjee and Lavie, 2005; Liu and Gildea, 2005; Owczarzak et al., 2007) have evaluated their success by comparing the measure to human judgments of fluency and adequacy. In other work, e.g. Snover et al. (2006), measures are evaluated by comparison to human-targeted TER
mtjournal.tex; 15/05/2009; 15:03; p.2
Expected Dependency Pair Match
3
(HTER), a distance to a human-revised reference that uses wording closer to the MT system choices (keeping the original meaning) that is intended to measure the post-editing work required after translation. In this paper, we explore both kinds of evaluation. In section 2), we outline our approach to including syntactic information in MT evaluation, by describing a family of metrics. In section 3, we describe the implementation details and make explicit which dimensions of this family of metrics we explore in this paper. Section 4 examines the correlation of several members of this family with human judgments of fluency and adequacy over a corpus of sentence translations and selects a favorable member of the family, Expected Dependency Pair Match (EDPM), based on this comparison. Section 5 compares the correlation of EDPM with HTER over a corpus of document- and sentence-level comparisons, and demonstrates that its correlation is favorable to that of competitor measures BLEU and TER at both sentence and document levels, regardless of source-language or genre. Section 6 uses the tuning components of the TERp tools to explore the combination of these syntactic measures with other TERp word-based measures. Finally, section 7 concludes with some remarks on challenges and future work.
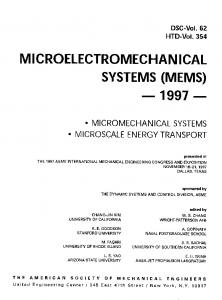
2. Approach This work explores a family of dependency pair match (DPM) measures that are composed of precision and recall combinations over various decompositions of a syntactic dependency tree. These measures are extensions of the dependency-pair F measures found in Roark et al. (2006) and Owczarzak et al. (2007). Rather than comparing string sequences, as BLEU does with its n-gram precision, this approach defers to a parser for an indication of the relevant word tuples associated with meaning — in these implementations, the head on which that word depends. Each sentence (both reference and hypothesis) is converted to a labeled syntactic dependency tree and then relations from each tree are extracted and compared. A member of this family is defined by several parameters. The first of these parameters is the nature of the decomposition of the dependency tree structure. A decomposition list is the list of ways in which the tree is reduced to a bag of tree-local tuples. Figure 1 illustrates the dependency-link-head decomposition of a toy dependency tree into a list of hd, l, hi tuples. Some members of the DPM family may apply more than one decomposition; other good examples are the dl decomposition, which generates a bag of dependent word with outbound links, and
mtjournal.tex; 15/05/2009; 15:03; p.3
4
Kahn, Snover & Ostendorf
Reference
Hypothesis
tree det hthe, → , cat i mod hred, → , cat i dlh list subj hcat, → , ate i root hate, → , i Precisiondlh is 13 and Recalldlh
det , → , cat i subj h cat , → , stumbledi root hstumbled, → , i h
the
is 14 : thus F [dlh] =
2 7
Figure 1. Example hypothesis and reference dependency trees and the dlh decomposition of each.
dl
lh
det , → i subj h cat , → i root hstumbled, → i
det h → , cat i subj h → , stumbledi root h → , i
h
the
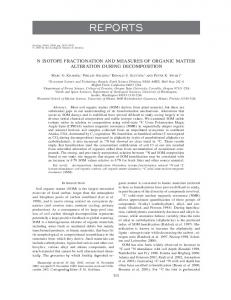
Figure 2. The dl and lh decompositions of the hypothesis tree in figure 1. The items extracted here are individually less restrictive in their ability to match against reference tuples.
the lh decomposition, which generates a bag of inbound link labels, with the head word for each included. Figure 2 demonstrates the dl, lh decomposition for the hypothesis tree in figure 1. It is worth noting here that the dlh and lh decompositions (but not the dl decomposition) “overweight” the headwords, in that there are n elements in the resulting bag, but if a word has no dependents it is found in the resulting bag exactly one time (in the dlh case) or not at all (in the lh case). Conversely, syntactically “key” words, that are directly modified by many other words in the tree, are included multiple times in the decomposition (once for each inbound link). We argue that this overcounting is a virtue; the syntactic structure indicates which words are more important to translate correctly. We may not completely trust the parser’s best parse. The parser itself, if we use a probabilistic parser, can provide an n-best parse list for the translation reference and translation hypothesis. We use the probability statistics of the list to compute expected counts for each decomposition. Though this approach yields partial counts, standard comparisons like precision and recall are still valid, and using the ex-
mtjournal.tex; 15/05/2009; 15:03; p.4
Expected Dependency Pair Match
5
pectations can help cope with both error in the parser and ambiguity in the translations (reference and hypothesis). When multiple decomposition types are used together, we may combine these subscores in a variety of ways. We may compute precision and recall subscores for each decomposition separately, or, since the results of each decomposition are of different types entirely, we may compute them as members of one large bag for an even simpler F score. These two approaches are equivalent when only one decomposition type is included. For simplicity in presentation, we use the following notation, where dl and lh represent the two kinds of decompositions described above and µh represents a harmonic mean: F [dl, lh] = µh (Prec (dl ∪ lh) , Recall (dl ∪ lh)) (1) µP R [dl, lh] = µh (Prec (dl) , Recall (dl) , Prec (lh) , Recall (lh)) (2) Dependency-based SParseval and the d approach from Owczarzak et al. (2007) may each be understood as F [dlh], while the latter’s d var method may be understood as something close to F [dl, lh]. Both of the combination methods above (F [·] and µP R [·]) are “naive” in that they treat each component score as equivalent to the next. One further direction to explore involves tuning (presumably on held-out data) the precision and recall weights for each decomposition type for a later linear combination. The possible family of metrics outlined above is quite large. In the next section, we make explicit the range of these parameters that we explore in this article.
3. Experimental paradigm 3.1. Parse tree implementation In principle, the family of DPM measures may be implemented with any parser that generates a dependency graph (a single labelled arc for each word, pointing to its head-word). Prior work (Owczarzak et al., 2007) on related measures has used an LFG parser (Cahill et al., 2004) or an unlabelled dependency tree (Liu and Gildea, 2005). In this work, we use a state-of-the-art PCFG (the first stage of Charniak and Johnson (2005)) and context-free head-finding rules (Magerman, 1995) to generate a 50-best list of dependency trees for each hypothesis and reference translation. We use the parser’s default (Englishlanguage) Wall Street Journal training parameters. Head-finding uses the Charniak parser’s rules, with three modifications: prepositional and complementizer phrases choose nominal and verbal heads respectively
mtjournal.tex; 15/05/2009; 15:03; p.5
6
Kahn, Snover & Ostendorf
S
stumbled
VP
NP cat
stumbled
VBD
DT
NN cat
stumbled
the
cat
stumbled
the
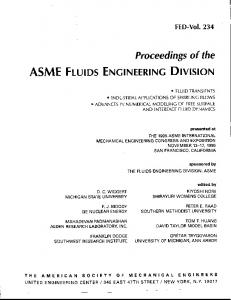
Figure 3. An example constituent tree (heads of each constituent are listed small below the label) and the labelled dependency tree derived from it using the strategy described in section 3.
(rather than functional heads) and auxiliary verbs are modifiers of main verbs (rather than the converse). A/B
Having constructed the dependency tree, we label the arcs as d → h, where the arc label A/B between dependent d and its head h is composed of A (the lowest constituent-label headed by h and dominating d) and B (the highest constituent label headed by d). For example, in figure 3, the S node is the lowest node headed by stumbled that dominates cat, and the NP node is the highest constituent label headed by cat, S/N P
so the arc between cat and stumbled is labelled → . This strategy is very similar to one adopted in the reference implementation of labelleddependency SParseval, and may be considered as an approximation of the rich semantics generated by LFG parsers (Cahill et al., 2004) or another heavily knowledge-engineered parser, but with much less knowledge-engineering required. The A/B labels are not as descriptive as the LFG semantics, but S/N P
they have a similar resolution, e.g. the → arc label usually represents a subject dependent of a sentential verb. 3.2. Dimensions of metric family In the experiments presented later in this article, we explore the space of metrics outlined above along multiple dimensions: Decompositions. We consider syntactic decompositions of the following types:
mtjournal.tex; 15/05/2009; 15:03; p.6
Expected Dependency Pair Match
7
dlh hDependent, arc Label, Headi Here, every tuple includes two words and the dependency-label between them. dl hDependent, arc Labeli The tuple is the word plus the label of the arc linking it to its head; this decomposition marks how the word fits into its syntactic context (what it modifies). lh harc Label, Headi Each tuple here is the dependency relation plus the word being modified; this decomposition implicitly marks how key the word is to the sentence. dh hDependent, Headi This decomposition drops the arc from the dependency-pair tuple, ignoring the syntactic-role information implied in the arc labels. 1g,2g These decompositions are syntactically-null. They simply include each 1-gram (or 2-gram) without any syntactic labeling at all. They are thus simple measures of unigram (bigram) precision and recall. Size of n-best list. Although the parser can generate considerably more, we consider n-best lists of size 1 and of size 50. Confidence of n-best hypotheses. An expectation requires a probability distribution over the n-best list, and we consider three options: uniform, the parser probabilities, and a flattened version γ of the parser probabilities such that p˜(x) = Pp(x) γ (where γ is p(i) i a free parameter) to account for the fact that the parser tends to be over-confident. In all cases, the probabilities are normalized to sum to one over the the n-best list, where the maximum n in this work is 50. The uniform distribution (γ = 0) is intended to be equivalent to the (Owczarzak et al., 2007) d 50 and d 50 var measures.1 Score combination. We consider three possible methods for combining scores across decompositions, as suggested in section 2: F [·] treats each decomposition as contributing n more items to the bag of tokens extracted from the tree, and then computes a global F score. µP R [·] constructs a precision and recall score from each decomposition, and then does an evenly-weighted harmonic mean of all the component precision and recall scores. Tuned, like the previous combination, calculates precision and recall separately for each decomposition, but performs a linear weighted combination of the resulting precision and recall
mtjournal.tex; 15/05/2009; 15:03; p.7
8
Kahn, Snover & Ostendorf
scores. For this tuning, we note that TERp (Snover et al., 2009) provides a tuneable system over a small number of parameters (they include, among others, separate cost for insertions, deletions, substitutions and synonyms) and an optimization algorithm that assigns weights to each parameter. We use the various decompositions’ precision and recall as new parameters to the TERp optimizer. 3.3. Reference evaluation measures over parallel translations For some of the experiments presented here (sections 5 and 6), we have multiple translations of the same source segment, each from a different translation engine and each with its own HTER score. For these translations, reporting correlations of metric m with absolute HTER scores can conflate m’s power in identifying which of two candidate translations is better with m’s (and HTER’s) ability to distinguish which source segments are more difficult to translate. To avoid this conflation, on the HTER corpora we report correlations on µ ¯m and µ ¯HTER (rather than measure m and HTER), where µ ¯ represents mean-removal: µ ¯m(ti ) = m(ti ) −
I X m(tj ) j=1
I
(3)
Mean-removal lowers the correlation r values reported but ensures that the reported correlations are among differences in the translations rather than among differences in the underlying segments. 2 When reporting HTER correlations per-sentence, we use lengthweighted correlation, since unweighted correlations effectively put too much emphasis on short sentences. We do not weight for length for the per-document correlations in section 5, because we assume documents to be equally important (regardless of length). 4. Correlation with human judgments of fluency & adequacy To explore members of the DPM metric family, we explore the correlations of various configurations against a corpus of human judgments of fluency and adequacy.
mtjournal.tex; 15/05/2009; 15:03; p.8
9
Expected Dependency Pair Match
Table I. Comparing dl, lh to dlh and baselines. metric
|r|
F [dl, lh] BLEU4 F [dlh] TER
0.226 0.218 0.185 0.173
4.1. Corpus For these experiments, we use LDC Multiple Translation Chinese corpus parts 2 (LDC, 2003) and 4 (LDC, 2006). These corpora include multiple human judgments of fluency and adequacy for each sentence, with each judgment using a different human judge and a different reference translation. For a rough3 comparison with Owczarzak et al. (2007), we treat each judgment as a separate segment. This treatment of this corpus yields 16,815 tuples of hhypothesis, reference, fluency, adequacyi. In these experiments, we extend this tuple with automatic scores derived from hhypothesis, referencei and examine the correlations4 between those automatic scores and the arithmetic mean of the fluency and adequacy measures. 4.2. Exploring decompositions We begin by comparing some of the simplest DPM measures to baseline measures case-sensitive BLEU (4-grams, with add-one smoothing) and TER. For these first experiments, we consider only the 1best parse (n = 1). In table I we see that using the partial-label dl, lh decomposition has a better correlation with the fluency/adequacy scores than TER or BLEU4 . These results confirm, with a PCFG, what Owczarzak et al. (2007) found with an LFG parser: that partialdependency matches are better correlated with human judgments than full-dependency links. In table II, we compare among several other members of the DPM family. Here, we find that combining the decompositions naively in F [·] (before computing precision and recall) has a better r than the harmonic mean of precision and recall subscores in µP R [·]. We also see that we can combine the benefits of string-local n-grams (F [1g, 2g]) with the benefits of dependency information (F [dl, lh]) for a further improved correlation with human judgment, with the best correlation in F [1g, 2g, dl, lh]. Including progressively larger chunks of the depen-
mtjournal.tex; 15/05/2009; 15:03; p.9
10
Kahn, Snover & Ostendorf
Table II. Comparing combination methods F [·] and µP R [·], and comparing the 1g, 2g, dl, lh decomposition with the dl, lh decomposition and other decompositions. metric
r
F [1g, 2g, dl, lh] µP R [1g, 2g, dl, lh] F [1g, 2g] µP R [1g, 2g] F [dl, lh] µP R [dl, lh]
0.237 0.217 0.227 0.215 0.226 0.208
Table III. Comparing n = 1 to n = 50 for several variants of the DPM measure. metric
n
r
F [1g, 2g, dl, lh] F [1g, 2g, dl, lh] F [1g, dl, lh] F [1g, dl, lh] F [dl, lh] F [dl, lh]
50 1 50 1 50 1
0.239 0.237 0.237 0.234 0.234 0.226
dency graph with F [1g, dl, dlh] (not shown in table, but inspired by the BLEUk idea of progressively larger n-grams) does not seem to be an improvement over F [dl, lh]. 4.3. Exploring parse expectations To explore the effect of extracting parse feature-counts from a forest instead of a single tree, we present in table III several variants, with n = 1 and with n = 50. For the n = 50 cases, we set γ = 0 to assign uniform probabilities to the parse forest, to compare as closely as possible to Owczarzak et al. (2007), which includes a d var 50 measure with 50best parses, with ranks but no weights. While not all of these differences are significant, the trend is universally that the correlation r improves as the number of parses (n) is increased. Tuning experiments find that increasing γ to 0.25 can increase the r reported here for F [1g, 2g, dl, lh] marginally (but insignificantly).
mtjournal.tex; 15/05/2009; 15:03; p.10
Expected Dependency Pair Match
11
4.4. Summary In this section, we have presented experiments exploring a number of variants of the DPM metric against an average fluency/adequacy judgment. The experiments suggest a best-case variant, where we set: EDP M = F [1g, 2g, dl, lh], n = 50, γ = 0.25 in which we choose a 1g, 2g, dl, lh sub-graph decomposition based on the improvements from better sub-graphs (table I), multiple parses (n = 50) based on table III, and γ = 0.25. We use these EDPM parametersettings in the experiments exploring document-level correlations with HTER (section 5).
5. Correlating EDPM with HTER In this section, we move from an exploration of the space of possible DPM metrics to a single chosen DPM-derived metric (EDPM). Here, we compare EDPM to other metrics in correlation with document-level and segment-level HTER performance. 5.1. HTER corpus The GALE 2.5 translation corpus is made up of system translations into English from three sites. The three sites all use system combination to integrate results from multiple systems, some of which are phrasebased and some which may use syntax on either the source or target side. No system provided system-generated parses. The corpus being translated comes from Arabic and Chinese in four genres: bc (broadcast conversation), bn (broadcast news), nw (newswire), and wb (web text), with corpus sizes shown in table IV. The corpus includes one English reference translation ri (LDC, 2008) for each sentence i and a system translation ti,z for each of the three systems z. Additionally, each of the system translations of each segment i has a corresponding humantargeted reference aligned at the sentence level, so we have available the HTER score of each segment HTER(ti,z ) at both the sentence and document level. As discussed in section 3, we report correlations here between µ ¯m and µ ¯HTER, rather than m and HTER directly, to abstract away from variations in the underlying documents. In table Va, we show per-document Pearson’s r between µ ¯EDPM and µ ¯HTER, as well as two other baselines: µ ¯TER and µ ¯BLEU4 . We see that the EDPM has the highest correlation in each of the subcorpora
mtjournal.tex; 15/05/2009; 15:03; p.11
12
Kahn, Snover & Ostendorf
Table IV. Corpus statistics for the GALE 2.5 translation corpus. Arabic doc sent
Chinese doc sent
Total doc sent
bc bn nw wb
59 63 68 69
750 666 494 683
56 63 70 68
1061 620 440 588
115 126 138 137
1811 1286 934 1271
Total
259
2593
257
2709
516
5302
Table Va. Per-document correlations of µ ¯EDPM and others to µ ¯HTER, by genre and by source language. Bold numbers are within 95% significance of the best per column; italics indicate that the sign of the r value has less than 95% confidence. r vs. µ ¯HTER µ ¯TER µ ¯BLEU µ ¯EDPM
bc
bn
nw
wb
0.59 -0.42 -0.69
0.35 -0.32 -0.39
0.47 -0.46 -0.47
0.17 -0.27 -0.27
all Arabic
all Chinese
0.54 -0.42 -0.60
0.32 -0.33 -0.39
all 0.44 -0.37 -0.50
created by dividing by genre or by source language, as well as the corpus as a whole. Not every difference is above 95% confidence, but the trend is the same across all of the subcorpora. EDPM’s strengths, relative to the other measures, are particularly clear in the unstructured domains (wb and bc). Table Vb presents per-sentence correlations, weighted by sentence length. Though many of the r values are smaller magnitude in this correlation, EDPM again has the largest correlation in each category. TER, however, does quite well with length-weighted sentence correlaTable Vb. Per-sentence, length-weighted correlations of µ ¯EDPM and others to µ ¯HTER, by genre and by source language. r vs. µ ¯HTER µ ¯TER µ ¯BLEU µ ¯EDPM
bc
bn
nw
wb
0.44 -0.31 -0.46
0.29 -0.24 -0.31
0.33 -0.29 -0.34
0.25 -0.25 -0.30
all Arabic
all Chinese
0.44 -0.31 -0.44
0.25 -0.24 -0.30
all 0.36 -0.28 -0.37
mtjournal.tex; 15/05/2009; 15:03; p.12
Expected Dependency Pair Match
13
tion, with r values within 95% confidence of EDPM scores on nearly every breakdown.
6. Weight-tuning to combine syntax and other knowledge sources In the previous section, we observed that TER and EDPM each perform better than BLEU when considering mean-removed length-weighted correlations with HTER. We observe that TER’s basic operations (insertions, deletions, shifts and substitutions) are fundamentally different from those of EDPM, which is an F -style overlap measure and is seeking to make explicit comparison based on an inferred syntactic structure. These two different approaches (word-level and syntactic features) are complementary, and we seek in this section to explore mechanisms for combining them. As discussed in section 1, the TER Plus (TERp) research tools (Snover et al., 2009) provide an optimizer for weighting multiple simple subscores, including selecting weights for the TER basic operations. TERp’s feature list extends TER to additionally include synonymy, stemming, and automatically-derived paraphrases. The TERp optimizer performs a hill-climbing search, with randomized restarts, to maximize the correlation of a linear combination of the features with a set of human judgments. Within the TERp framework the features are the count of the various edit types normalized for the length of the reference so that the dot product of the features with a vector of edit costs will give the TERp score for a given segment. In these experiments, we follow Snover et al. (2009) by first aligning the MT outputs with the reference, using TERp with a set of default edit costs, to find the counts of the various edit types. These alignments and edit costs are then held constant to optimize the edit costs. In the case of comparing TERp without the paraphrasing feature, a separate alignment was performed without that feature enabled. Additional features can be added to the TERp optimization framework and optimized in the same manner as the edit costs. In the experiments presented in this section, we extend this feature list by including the syntactic overlap features, and we use the TERp optimizer tools to tune the relative weight of each feature. 6.1. Features We train a model using features from one or more of the following sets:
mtjournal.tex; 15/05/2009; 15:03; p.13
14
Kahn, Snover & Ostendorf
E : the fully syntactic features from the DPM family. Specifically, this |hyp|−|correct| correct| ) feature set includes error-counts ( and |ref|−||ref |ref| | for the dl, lh, dlh, and dh decompositions of the syntactic structure, using n = 50 and γ = 0.25. The E set includes 8 features. N : the non-syntactic features from the DPM family; specifically, errorcounts for the 1g and 2g decompositions. The N set includes 4 features. T : the features from basic TERp, excluding paraphrases, which include a separate cost for each of matches, insertions, deletions, substitutions, shifts, and synonym matches and stem matches. The T set includes 7 features. P : features from the automatically-derived TERp paraphrase table. These are four features which are a function of of the edit distance between the two phrases in each paraphrase and the probability of the paraphrase. B : two “length penalties” one is assigned the count of hypothesis words beyond the count of reference words, and one assigned the count of reference words beyond the count of hypothesis wordsbrevity/prolixity (2 features: one for longer-than-ref, one for shorterthan-ref). We assign two features here to let the system separately penalize “too short” translations and “too long”. 6.2. Corpus For these tuning experiments we use the same GALE 2.5 documents and sentences from the previous section. Since this approach requires tuning, we assign documents randomly into two groups, such that each group has the same document distribution across source-language and genre. These two corpus halves are used in two-fold cross-validation, testing on one and training on the other. We tune on (and report correlation with) length-weighted per-sentence correlation with HTER, using mean-removed scores as before. 6.3. Effects of features on tuning In figure 4, we plot the Pearson’s r (with 95% confidence interval) for the results on the two test sets (each trained on one and tested on the other). For each set of features, we plot the r (and confidence) on both halves of the corpus (for each half, tuned on the other half). In the leftmost group of the figure, we include baselines: EDPM and BLEU
mtjournal.tex; 15/05/2009; 15:03; p.14
Expected Dependency Pair Match
15
Figure 4. Pearson’s r values for the two halves of the training set, with 95% confidence intervals.
and TER (which are not tuned). Next, the tuned E feature, which (by itself) does not perform as well as TER or EDPM. The remaining groups of three show that for each set of features, as E (and EB) are included with others, correlation improves (though not significantly). These all move in the same direction. By the same measurement, P features help beyond T – as reported elsewhere – but N features do not seem to find a better correlation than TP features. Overall, we find that this approach for combining the underlying idea of EDPM with the underlying ideas of TERp is promising, in that the E features offer small (though non-significant) improvements to the features already within TERp. However, this combination approach still has more in common with the µP R combination method (explored in section 4) than with EDPM, which suggests a reason that the EN features — though tuned — do not outperform EDPM.
7. Conclusion In this research, we explore dependency pair match (DPM) a family of syntactically-oriented measures. Through a corpus of human fluency and adequacy judgments, we settle on EDPM, a member of that family with promising predictive power. We find that EDPM is superior to BLEU and TER in terms of correlation with human judgments and as a per-document and per-sentence predictor of HTER (using mean-
mtjournal.tex; 15/05/2009; 15:03; p.15
16
Kahn, Snover & Ostendorf
subtraction to account for underlying document- and segment-level difficulty). We experiment with including syntactic features in TERp-style tuning, with linear weight combination, and find that including these features improves correlation with mean-subtracted HTER, although these improvements do not reach significance. Several areas of future work are open to us. One obstacle to using this method widely is the computational cost of parsing compared to word-based measures such as BLEU or TER. Using these syntactic techniques may be possible as a late-pass evaluation, to identify how candidate translation systems are performing overall. Alternatively, the various tree-decompositions of the DPM family could be used as system diagnostics, by looking at relative quality of these component scores compared to those of an alternative candidate system. Another possible approach is to store packed forests (Huang, 2008) rather than generating an n-best list only to sum across it again in calculating the expectation. Another research area relates to the quality of the parser. In this work, we demonstrated that the Charniak and Johnson (2005) PCFG parser could serve in place of the LFG parser used in Owczarzak et al. (2007). PCFG parsers, however, are fairly easily adaptable to another domain. One research direction explores the intersection of genre (and genre-mismatch), parser quality, and prediction of human performance. We are interested in the trade-offs — if any — among parse quality, genre adaptation, and predictive power as a translation metric.
Acknowledgements This material is based upon work supported by the National Science Foundation under Grant No. 0741585 and the Defense Advanced Research Projects Agency under Contract Nos. HR0011-06-C-0022 and HR0011-06-C-0023. Any opinions, findings, and conclusions or recommendations expressed in this material are those of the author(s) and do not necessarily reflect the views of the National Science Foundation or the Defense Advanced Research Projects Agency.
Notes 1
Owczarzak et al. (2007) report no use of parse confidence weights, thus d 50 and d 50 var may be using a sum of counts over the 50-best list rather than expected-counts over a uniform distribution, as we suggest in section 3.2. These two approaches are equivalent — so long as the n-best list is always the same length for hypothesis and reference. In our implementation, the n-best list does not always
mtjournal.tex; 15/05/2009; 15:03; p.16
Expected Dependency Pair Match
17
reach 50 candidate parses on short sentences, so the expectation matches our intent better than a sum of counts over the n-best. 2 Previous work (Kahn et al., 2008) reported HTER correlations against pairwise differences among translation segments derived from the same source segment, unlike the mean-removal suggested in section 3.3. Those results are similar to those reported in section 5. However, we believe that pairwise differences introduce problems with the independence assumptions in the Pearson’s r tests, and we use mean-removal throughout this work instead. 3 Our segment count reported in section 4.1 differs from Owczarzak et al. (2007), who report 16,800 segments over the same corpus. We find baseline correlations (BLEU4 and TER) lower than those reported there as well, so the results presented here are not directly comparable with that paper, though we demonstrate similar gains over those baselines in essentially the same corpus. 4 The independence of the translation segments in the Multiple Translation Corpus described in section 4.1 is questionable, since the same hypothesis translations are used in multiple items, but for the sake of methodological comparison with prior work, this strategy is preserved.
References Banerjee, S. and A. Lavie: 2005, ‘METEOR: An Automatic Metric for MT Evaluation with Improved Correlation with Human Judgments’. In: Proc. ACL Workshop on Intrinsic and Extrinsic Evaluation Measures for MT and/or Summarization. pp. 65–72. Cahill, A., M. Burke, R. O’Donovan, J. Van Genabith, and A. Way: 2004, ‘LongDistance Dependency Resolution in Automatically Acquired Wide-Coverage PCFG-Based LFG Approximations’. In: Proc. ACL. pp. 319–326. Callison-Burch, C.: 2006, ‘Re-evaluating the Role of BLEU in Machine Translation Research’. In: Proc. EACL. pp. 249–256. Charniak, E. and M. Johnson: 2005, ‘Coarse-to-Fine n-Best Parsing and MaxEnt Discriminative Reranking’. In: Proc. ACL. pp. 173–180. Charniak, E., K. Knight, and K. Yamada: 2003, ‘Syntax-based Language Models for Statistical Machine Translation’. In: Proceedings MT Summit IX. Huang, L.: 2008, ‘Forest Reranking: Discriminative Parsing with Non-Local Features’. In: Proceedings of ACL-08: HLT. Columbus, Ohio, pp. 586–594. Kahn, J. G., B. Roark, and M. Ostendorf: 2008, ‘Automatic Syntactic MT Evaluation with Expected Dependency Pair Match’. In: MetricsMATR: NIST Metrics for Machine Translation Challenge. Honolulu, Hawaii. LDC: 2003, ‘Multiple Translation Chinese corpus, part 2’. Catalog number LDC2003T17. LDC: 2006, ‘Multiple Translation Chinese corpus, part 4’. Catalog number LDC2006T04. LDC: 2008, ‘GALE Phase 2 + Retest Evaluation References’. Catalog number LDC2008E11. Liu, D. and D. Gildea: 2005, ‘Syntactic Features for Evaluation of Machine Translation’. In: Proc. ACL Workshop on Intrinsic and Extrinsic Evaluation Measures for MT and/or Summarization. pp. 25–32. Magerman, D. M.: 1995, ‘Statistical Decision-Tree Models for Parsing’. In: Proc. ACL. pp. 276–283.
mtjournal.tex; 15/05/2009; 15:03; p.17
18
Kahn, Snover & Ostendorf
Och, F. J.: 2003, ‘Minimum Error Rate Training in Statistical Machine Translation’. In: Proc. ACL. Owczarzak, K., J. van Genabith, and A. Way: 2007, ‘Labelled Dependencies in Machine Translation Evaluation’. In: Proceedings of the Second Workshop on Statistical Machine Translation. pp. 104–111. Papineni, K., S. Roukos, T. Ward, and W.-J. Zhu: 2002, ‘BLEU: a Method for Automatic Evaluation of Machine Translation’. In: Proceedings ACL. pp. 311– 318. Roark, B., M. Harper, E. Charniak, B. Dorr, M. Johnson, J. G. Kahn, Y. Liu, M. Ostendorf, J. Hale, A. Krasnyanskaya, M. Lease, I. Shafran, M. Snover, R. Stewart, and L. Yung: 2006, ‘SParseval: Evaluation Metrics for Parsing Speech’. In: Proceedings LREC. Snover, M., B. Dorr, R. Schwartz, L. Micciulla, and J. Makhoul: 2006, ‘A Study of Translation Edit Rate with Targeted Human Annotation’. In: Proceedings AMTA. Snover, M., N. Madnani, B. Dorr, and R. Schwartz: 2009, ‘Fluency, Adequacy, or HTER? Exploring Different Human Judgments with a Tunable MT Metric’. In: Proceedings of the Fourth Workshop on Statistical Machine Translation at the 12th Meeting of the European Chapter of the Association for Computational Linguistics (EACL-2009). Athens, Greece.
mtjournal.tex; 15/05/2009; 15:03; p.18