and thus takes O(E) time, where E is the number of edges in the graph. It assigns actions ..... In Donald, Lynch, and Rus, editors,. Algorithmic ... [11] C. Fennema, A. Hanson, E. Riseman, J. R. Beveride, and R. Kumar. Model-directed ... [19] B. Nickerson, P. Jasiobedzki, D. Wilkes, M. Jenkin, E. Milios, J. Tsot- sos, A. Jepson ...
To appear in the International Journal of Robotics Research, 2004
Expected Shortest Paths for Landmark-Based Robot Navigation Amy J. Briggs1 1 2
Carrick Detweiler1 Daniel Scharstein1 Alexander Vandenberg-Rodes2
Middlebury College, Middlebury VT 05753, USA Princeton University, Princeton NJ 08544, USA
Abstract In this paper we address the problem of planning reliable landmarkbased robot navigation strategies in the presence of significant sensor uncertainty. The navigation environments are modeled with directed weighted graphs in which edges can be traversed with given probabilities. To construct robust and efficient navigation plans, we compute expected shortest paths in such graphs. We formulate the expected shortest paths problem as a Markov decision process and provide two algorithms for its solution. We demonstrate the practicality of our approach using an extensive experimental analysis using graphs with varying sizes and parameters.
1
Introduction
Reliable strategies for mobile robot navigation using visual landmarks must be robust in the face of significant uncertainty in landmark detection. Varying lighting conditions, temporary occlusion, and unreliability of landmark recognition are all factors that contribute to such uncertainty, whether the visual landmarks are artificial or extracted from the environment. This paper presents algorithms and experimental results for computing expected shortest paths for use in navigation between landmarks. The paper builds on our real-time landmark detection system [26] and on our vision-based navigation framework [7, 8]. Here we extend our prior work with significant contributions to the understanding of probabilistic navigation. First, we present two algorithms for the solution to the expected shortest paths problem and prove their convergence. Second, we present a careful analysis of the properties of the two algorithms, with an extensive empirical evaluation of 1
their performance in practice. We first review the natural graph formulation of the problem, and then show how the problem can be concisely described as a Markov decision process. The specific problem we address is the following. We assume an unmapped indoor environment (such as a factory floor or hospital) in which a mobile robot must repeatedly navigate. To enable the robot to localize itself quickly and then navigate in this space, the environment is enhanced with artificial visual landmarks. During an initial exploratory phase the robot systematically visits all landmarks and constructs their visibility graph. This graph is continually updated during subsequent navigation. All motion paths are planned from landmark to landmark, moving along the visibility edges of the graph. Because landmark detection is unreliable, each edge is annotated not only with its length, but also with an estimate of the probability that the target landmark can be detected. These estimates are based on the history of all observations made by the robot, and are updated as the robot navigates the environment. Given such a graph, planning an optimal path to a goal landmark involves solving the expected shortest path (ESP) problem, i.e., computing the expected lengths of the shortest paths from all nodes to the goal. Using probabilistic techniques, our navigation system constructs reliable and efficient motion plans in the presence of occlusion, unreliability of landmark detection, and variations in visibility due to changes in the environment over time. The ESP algorithms can be applied to important problems in other domains as well. For example, probabilistic graphs can be used to model communication networks in which individual links can fail. The ESP algorithms could then be used for optimal package routing given continually changing models of link reliability. Another application is that of traffic planning in a road network where some roads may be closed due to poor weather, accidents, congestion, road construction, or other temporary interruptions (e.g., draw bridges or railway crossings). The ESP formulation can also be applied to other robot path planning problems, for example to configuration-space planning in uncertain or changing environments. After reviewing related work in Section 2, we define the expected shortest path problem and give two algorithms for its solution in Section 3. We then present the Markov decision process formulation of the problem and analyze the properties of the algorithms, value iteration and policy iteration, in Section 4. We report on our experimental results evaluating the performance of the algorithms on large sets of graphs in Section 5, and conclude with ideas for future work in Section 6.
2
2
Related work
Techniques for mobile robot navigation based on landmarks include those planned within a geometric environment map enhanced with perceptual landmarks [14, 19], and those based on a topological description of landmark locations without a global map [21, 27, 33]. Many research groups have used artificial landmarks that can be easily and unobtrusively added to the environment for localization and navigation tasks [3, 15, 30]. Shortest-path problems involving probabilistic or stochastic graphs have been considered in a variety of fields, including computer networks, operations research, transportation science, and artificial intelligence. In computer networks, one can model a communication network with a graph in which each link has a certain probability of failing. Most work in this category assumes that graphs are stationary, i.e., unpassable edges do not become passable and vice versa. Typical problems in this context are to compute the probability whether two or all nodes are connected [9, 24, 32], or the expected cost of shortest paths between nodes [22, 18]. In contrast, in our problem the state of an edge can change as the robot traverses the graph, and the notion of the shortest path is directly linked to the robot’s navigation strategy. A different category of related work involves finding shortest paths in stochastic graphs where the cost of each edge is a random variable, which may be time-dependent. This is a common problem in operations research and transportation science [10, 12]. For example, one might seek an optimal path in a stochastic, time-dependent graph such as a train network with given (but perhaps unreliable) arrival and departure schedules. The objective could be to minimize the expected travel time [1, 12], or to maximize a more general arrival-time utility function [2, 16]. Most relevant to the work presented in this paper are results from operations research and AI on stochastic shortest-path problems that are instances of Markov decision processes (MDPs). Bertsekas and Tsitsiklis [4] analyze a general class of stochastic shortest-path problems, where at each node one must select a probability distribution over all possible successor nodes, and where the edge weights may be both positive and negative. They provide convergence and optimality results related to those in Section 4 below, but in a more general setting, and without an analysis of convergence speed. Bonet and Geffner [6] provide optimality guarantees for real-time dynamic programming (RTDP), an approximation algorithm using a heuristic function for solving stochastic shortest-path problems, and show experimental evidence that RTDP outperforms value iteration in some domains. 3
In contrast, the results presented in this paper relate to the specific MDP arising from the robot’s navigation strategy, and to the relative performance of the value iteration and policy iteration algorithms in this domain. In the robotics community, several researchers have used partially observable MDPs (POMDPs) for robot localization and navigation [28, 29, 31, 33]. These approaches model the robot’s state with a probability distribution, as opposed to our method, which assumes a known state. However, POMDPs are computationally intractable [17], and require approximate solutions such as a discretization of the state space [29] or “coastal navigation” [31]. MDPs and POMDPs have also been proposed for hierarchical robot control [23]. Also related is the work of Blei and Kaelbling [5], who describe Markov decision processes for finding shortest paths in stochastic graphs with partially unknown topologies. Their work differs from ours in that they assume that an edge is either passable or not, but that the state of each edge is only known with a certain probability. Finally, probabilistic graphs also appear in the context of probabilistic road-map planning (PRM). For example, Kavraki and Latombe [13] propose a randomized method for configuration space preprocessing that generates a network of collision-free configurations in a known environment, while ˇ Overmars and Svestka [20] describe a similar probabilistic learning approach that extends to a number of motion planning problems.
3
The expected shortest paths problem
We assume an environment augmented with N visual landmarks a, b, c, . . . that can be detected by the robot, albeit unreliably. We assume an edge from landmark a to landmark b has associated probability pab ∈ [0, 1] and length lab > 0. The probability pab represents the likelihood that landmark b can be detected from landmark a; the length lab represents a measure of cost to traverse the edge (e.g., time of travel). We assume that the robot can only travel to landmarks that are currently visible. Thus, the probabilities pab more generally represent the likelihoods that edges are passable. The robot, at any given landmark (or node) n, must choose among the currently visible landmarks (i.e., passable edges) where to travel to next. It also has the option of staying at the current node, and waiting for new landmarks to become visible. If no edge is currently passable, this is the only option. We represent the possibility of staying with a self-edge at each node n. Since staying is always an option, the associated probability is pnn = 1.
4
To prevent the robot from staying at a landmark indefinitely, we associate with the self-edge a non-zero cost lnn > 0, for example, the time it takes to acquire a new image and to search it for landmarks. A navigation task in such a probabilistic graph is specified by a designated goal node g that the robot wants to reach from its current node. In a nonprobabilistic graph, the optimal paths from all nodes to the goal can be computed easily, for example using Dijkstra’s shortest-path algorithm. At any given node in such a graph, the robot would then always take the single edge yielding the shortest path. In our case, however, the robot at a given node has to choose among the currently passable edges the one yielding the path with shortest expected length, or expected shortest path (ESP). Thus, solving the ESP problem involves computing for each node a strategy or policy that ranks the outgoing edges by their respective ESP lengths.
3.1
Building the visibility graph
Before presenting the ESP equations and the algorithms for their solution, we briefly discuss how the visibility graph can be constructed and how length and probability factors can be estimated and maintained. Clearly, once a visibility edge has been traversed by the robot, its length lij is known and can be stored. When artificial landmarks with known size are used we can also estimate the lengths of edges that have not yet been traversed, based on the size of the landmark in the image. Such estimates are immediately available with each new visibility edge, and can be replaced with the measured distance once the edge has been traversed. Estimates for the probabilities pij (that landmark j is visible from landmark i) can be derived from the history of observations of landmark j from landmark i. Note that observation histories can have “leading zeros”; that is, even if j was not visible the first few times an observation was made from landmark i, it is possible to reconstruct the complete observation history for j by keeping track of all observations ever made at landmark i. If we assume independent observations made with a fixed probability pij , the optimal estimate for pij is the ratio of detections to the total number of observations. In reality, however, the observations will neither be independent, nor will the pij stay constant over time. While some failures to detect a landmark will have truly random causes (for example, occlusion by a person walking by), others will be caused by lighting changes throughout the day, or perhaps even by permanent changes to the environment (most extremely, the removal or addition of a landmark). Typically, observations closely spaced in time will be highly correlated. Therefore, in practice, a 5
a
Eag
p na l na g
n p nn =1 lnn >0
p nb l nb
Ebg b
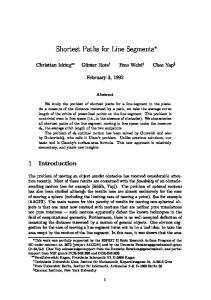
Figure 1: A node n with self-edge and two outgoing edges to nodes a and b. All edges have lengths lij and probabilities of being passable pij . We wish to compute the expected lengths Eig of the shortest paths from each node i to goal g. The four possible visibility scenarios at node n are reflected in Equation 2. more sophisticated estimate should be used, perhaps taking into consideration the time stamp of each observation.
3.2
The ESP equations
We now assume that current estimates of all lij and pij are available and turn to the problem of computing the expected shortest paths. Given a goal node g, we define the ESP problem to compute for each node n the expected length Eng of the shortest path from n to g. Clearly, Egg = 0.
(1)
We now derive equations that recursively relate the N −1 unknowns Eng , for all n �= g. Consider first a node n with two outgoing edges n → a and n → b (see Figure 1). The robot, upon arriving at n, will be faced with one of four visibility scenarios, depending on which of a and b can be detected. Suppose for example that a is visible but b is not. This scenario occurs with probability pna pnb , where p denotes (1 − p). Given this situation, the robot has two options: to go to a, or to stay at n. (The latter may be desirable if b is usually visible and yields a much shorter path.) The expected total length of the path through node a is lna + Eag , while the expected total length of staying at node n is lnn + Eng . For notational convenience, let Ling = lni + Eig 6
denote the total expected length of the path from n to g through i. The length of the shortest expected path (with b not visible) is then min(Lang , Lnng ), i.e., the smaller of the two candidate lengths. We can now write the complete equation for Eng by weighting the shortest candidate path with its corresponding probability in each of the four visibility scenarios: pna pnb Lnng
Eng = + + +
(2)
pna pnb min(Lang , pna pnb min(Lbng , pna pnb min(Lang ,
Lnng ) Lnng ) Lbng ,
Lnng ).
It is easy to see how this equation generalizes to nodes with more than two outgoing edges. In particular, a node with k outgoing edges n → a, n → b, . . . , n → z yields an equation with 2k terms: pna pnb . . . pnz Lnng
Eng = + + +
(3)
pna pnb . . . pnz min(Lang , pna pnb . . . pnz min(Lbng , pna pnb . . . pnz min(Lang ,
Lnng ) Lnng ) Lbng ,
Lnng )
+ ... + pna pnb . . . pnz min(Lang , Lbng , . . . , Lzng , Lnng ). We thus have a system of N − 1 equations that recursively relate the N − 1 unknowns Eng , n �= g. Because of the minimum expressions the system cannot be solved directly. Note, however, that Equation 3 could be written as a linear equation with only k terms if the ordering among the candidate lengths Ling were known. This observation plays an important role in our algorithms, so we will elaborate a bit. Going back to the simpler Equation 2, consider the possible orderings among Lang , Lbng , and Lnng . While one can deduce that Lnng cannot be the smallest of the three, each of the remaining four orderings is possible: Lang ≤ Lbng ≤ Lnng , Lbng
≤
Lang
≤
Lang ≤ Lnng ≤ Lbng ,
Lnng ,
Lbng
≤
Lnng
≤
(4)
Lang .
Assume for example that the first of these orderings holds: Lang ≤ Lbng ≤ Lnng . Such an ordering translates literally into a navigation strategy for a robot at landmark n: go to landmark a if possible (visible); if not, try to go to b if possible; else remain at n. Given this ordering, Equation 2 simplifies to Eng = pna Lang + pna pnb Lbng + pna pnb Lnng . 7
(5)
A final observation: if Lnng is not last in the ordering, the subsequent terms in the equation drop out since pnn = 1 (the self-edge can always be taken) and thus pnn = 0. For example, given the ordering Lbng ≤ Lnng ≤ Lang , Equation 2 simplifies to: Eng = pnb Lbng + pnb Lnng .
3.3
(6)
Algorithms for the ESP problem
To solve the ESP problem, we have developed variants of two algorithms commonly used to solve Markov decision processes (MDPs) (see Section 4 below). Borrowing the names from the MDP literature, these are value iteration (VI) and policy iteration (PI). Here we describe our algorithms in terms of the above notation. We then analyze some of their properties in the context of an MDP formulation in the next section. Value iteration Recall that our goal is to solve the system of N −1 equations, each of the form of Equation 3. Collecting the N−1 unknowns Eng , n �= g, into a vector v we can write the entire system of equations concisely: v = F (v).
(7)
Thus, the desired solution v of this system of equations is a fixed point of function F . The value iteration algorithm finds this fixed point by treating Equation 7 as an iterative process v (n+1) = F (v (n) ).
(8)
In [7] we have shown that this process converges to a unique fixed point v ∗ given an initial value v (0) = 0, if there exists a path with non-zero probabilities from each node to the goal. Convergence is geometric once the current value is in the vicinity of the fixed point. The idea of the proof is to show that each component of v (0) , v (1) , v (2) , . . . forms a bounded increasing sequence, and thus has a limit; see [7] for details. For an efficient implementation, we use the observation about orderings made in the previous section. That is, to evaluate Equation 3 for a node n with out-degree k, we first sort the candidate lengths Ling in O(k log k) time, and then evaluate the resulting linear equation in O(k) time. The total time for one iteration of Equation 8 is thus almost linear in the total number of edges in the graph E. 8
Policy iteration The idea of the second algorithm is to hypothesize edge orderings (as in Equation 4) at all nodes, and to solve the resulting linear system of Equation 7. The process is then repeated, using the previous solution to determine the new edge orderings. The iteration terminates when the solution to the current system of equations yields the same orderings as the previous solution. The name of the algorithm, policy iteration, reflects that instead of iterating over the values of the expected lengths, we iterate over the ordering of the expected lengths of the outgoing paths at each node. Recall that these orderings represent strategies (or policies) for the robot when faced with different visibility scenarios at a node. Note that while each iteration of the VI algorithm requires evaluating N − 1 linear equations (which together with the sorting step takes O(N 2 log N ) time for dense graphs), each iteration of the PI algorithm requires solving this linear system, requiring a total time of O(N 3 ) for dense graphs. As we show in Section 5, however, the PI algorithm is competitive since it converges in very few iterations. Analyzing the convergence properties of the policy iteration algorithm is easiest in the context of a Markov decision process (MDP) formulation, which we present next.
4
MDP formulation
The ESP problem can be formulated nicely as a Markov decision process (MDP). In brief, a MDP consists of a set of states S, and a set of allowable actions As for each state s ∈ S. Each action α ∈ As taken in state s yields a reward r(s, α), and results in a new (random) state s� according to a transition probability distribution p(·|s, α). The objective is to devise a policy with a stationary decision rule δ : S → As that selects a certain (fixed) action in each state so as to optimize a function of the total reward. This brief discussion ignores many common variations of MDPs, including time-dependent or discounted rewards, and non-stationary policies. For a comprehensive introduction to Markov decision processes, see the book by Puterman [25]. The ESP problem specifically translates into a non-discounted negative expected total-reward MDP. This means that each reward is interpreted as cost or penalty, and that the objective is to minimize the total expected cost. Upon reaching the goal g, no further cost is incurred. In our case, the set of states S is the collection of landmarks. The 9
concept of an allowable action at a landmark is slightly more complicated: it is not simply a destination landmark the robot should go to (which may not always be visible), but rather a strategy telling the robot what to do in any visibility scenario. Of course, such strategies correspond to the familiar edge orderings from Equation 4. Thus, the set of allowable actions As at landmark s is the set of all orderings among the outgoing edges of s. For example, suppose the robot is at a node s with three outgoing edges s → a, s → b, s → c. Then an example of α ∈ As would be: go to landmark c if possible; otherwise, go to landmark a if possible; otherwise, remain at s (take the self-edge) and try again. We notate this as α = s : c, a, s. A robot following this action (strategy) will end up at c, a, or s, depending on the visibility scenario. The transition probabilities are thus p(c|s, α) = psc
(9)
p(a|s, α) = psc psa p(s|s, α) = psc psa . The expected cost for α is simply the expected length for this action r(s, α) = psc lsc + psc psa lsa + psc psa lss .
(10)
Note that p(i|s, α) = 0 for any other landmark i since the self-edge can always be taken. We can therefore write the expected cost for action α as � lsi p(i|s, α). (11) r(s, α) = i∈S
A decision rule (or policy) δ assigns to each landmark one action (strategy) α. Under a given policy, the robot traverses the graph until it reaches the goal landmark. We assume the action at goal g is always α = g : g, and r(g, α) = 0. Since we wish to find the expected shortest path, we seek a policy that minimizes the total expected cost, i.e., the sum of the costs accrued by the actions leading to the goal. We now derive the total expected cost for a given decision rule δ. Let us denote the landmarks x1 , . . . , xN . Let rδ be the vector containing the expected cost for the action given by δ at each of the N landmarks. That is, entry s of rδ is rδ [s] = r(s, δ(xs )). (12) Let Pδ be the N × N transition probability matrix under the decision rule δ, i.e., the entry at row s and column d is Pδ [s, d] = p(xd |xs , δ(xs )). 10
(13)
Now define the j-step transition probability matrix j Pδ such that j Pδ [s, d] is the probability of arriving at xd after j transitions from xs . The probabilities after j + 1 steps are then j+1 Pδ [s, d]
=
=
N � i=1 N �
j Pδ [s, i]
p(xd |xi , δ(xi ))
j Pδ [s, i]
Pδ [i, d],
(14)
i=1
and therefore
j+1 Pδ
= j Pδ Pδ . Since 1 Pδ = Pδ , we get by induction j Pδ
= Pδj .
(15)
The vector of expected costs for the first transition is just rδ . It is easy to see that the costs for the second transition are Pδ rδ ; for the third, Pδ2 rδ , etc. The vector vδ of total expected costs for δ is thus the infinite sum vδ =
∞ �
Pδi rδ .
(16)
i=0
Expanding this sum we get vδ = rδ + Pδ rδ + Pδ2 rδ + Pδ3 rδ + . . . = rδ + Pδ (rδ + Pδ rδ + Pδ2 rδ + . . . ), and thus vδ = rδ + Pδ vδ .
(17)
So, given a decision rule δ we can compute the expected lengths by solving (I − Pδ ) vδ = rδ .
(18)
We now ask the question “which policy results in the shortest total expected lengths?” and present our two algorithms, value iteration and policy iteration, in this MDP formulation. The difference between the two is that VI iterates over the expected lengths v, while PI iterates over the policies δ.
4.1
Value iteration
The value iteration algorithm computes a sequence of values v (0) , v (1) , . . . , as follows: 11
1. Choose an initial v (0) , and set n = 0. 2. Compute � v (n+1) [k] = min
α∈Axk
r(xk , α) +
N �
� p(xi |xk , α) v (n) [i] .
(19)
i=1
3. If v (n+1) is very close to v (n) , then terminate and return the policy δ consisting of the minimizing actions α for all nodes. Else, increment n by 1, and go to step 2. When written in matrix form, Equation 19 becomes v (n+1) = min(rδ + Pδ v (n) ), δ
(20)
which parallels Equation 8 in Section 3.3. Our convergence result from [7] guarantees that Equation 20 has a unique fixed point v ∗ , and that the sequence v (n) converges monotonically to v ∗ when v (0) = 0.
4.2
Policy iteration
The policy iteration algorithm computes a sequence of policies δ (0) , δ (1) , . . . , as follows: 1. Choose an initial policy δ (0) , and set n = 0. 2. Solve (I − Pδ(n) ) v (n) = rδ(n) for v (n) . 3. If δ (n) is in the set D = arg min(rδ + Pδ v (n) ), δ
then terminate and return δ (n) . Else choose some δ (n+1) ∈ D, increment n by 1, and go to step 2. We now turn to the convergence proof. It turns out that for general nondiscounted negative expected reward MDPs, the policy iteration algorithm does not always converge to the optimal policy [25]. Given the conditions in our model, however, it does. We will first prove the following lemma, analog to Proposition 7.3.13 in the text by Puterman [25]. 12
Lemma 1 For each iteration n in policy iteration, v (n+1) ≤ v (n) (where the inequality applies component-wise). Proof: By step 3 in the policy iteration algorithm, if δ (n) is in the set D, then v (n+1) = v (n) . If δ (n) is not in D, then rδ(n+1) + Pδ(n+1) v (n) ≤ rδ(n) + Pδ(n) v (n) = v (n) .
(21)
Because all entries of Pδk(n) are non-negative for every k > 0, we can substitute rδ(n+1) + Pδ(n+1) v (n) for v (n) in the above inequality, giving: rδ(n+1) + Pδ(n+1) (rδ(n+1) + Pδ(n+1) v (n) ) = (I + Pδ(n+1) )rδ(n+1) +
Pδ2(n+1) v (n)
≤v
(22) (n)
.
(23)
So by induction, K−1 �
(
Pδk(n+1) rδ(n+1) ) + PδK(n+1) v (n) ≤ v (n)
(24)
k=0
for any positive K. Since all entries of v (n) are non-negative, K−1 �
Pδk(n+1) rδ(n+1) ≤ v (n)
(25)
k=0
for K > 0. Taking the limit as K goes to infinity gives ∞ �
Pδk(n+1) rδ(n+1) ≤ v (n) .
(26)
k=0
Therefore by Equation 16, v (n+1) ≤ v (n) . We are now prepared to prove our main theorem:
✷
Theorem 1 Given the above model and an initial policy δ (0) such that vδ(0) is finite, policy iteration converges to a policy δ with minimal vδ . Proof: Suppose we start with some δ (0) such that v (0) is finite. By Lemma 1, for each iteration n, v (n+1) ≤ v (n) . There are finitely many edges in the graph, so there are only finitely many decision rules (since each decision rule is an ordering of the edges). Since the sequence v (n) is non-increasing and no decision rule appears twice, the algorithm must terminate, because there exists an optimal decision rule. When it does at the n-th iteration, δ (n) 13
... ...
...
...
... xn
x k-1
xk
g
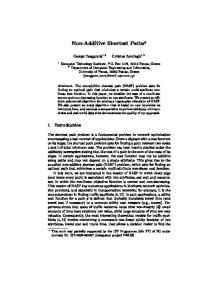
Figure 2: Every landmark xn is part of a chain of landmarks that leads to goal g. is in arg min(rδ + Pδ v (n) ), so v (n) = min(rδ + Pδ v (n) ). Our fixed-point result from the VI algorithm then guarantees that we have the optimal decision rule δ. ✷ (0) The remaining problem is to find an initial policy δ that yields finite expected costs vδ(0) . Note that there are many policies that yield infinite expected costs. Intuitively, such policies can “trap” the robot within a subgraph from which it cannot reach the goal. The simplest example is a policy containing an action α = s : s that commands the robot to always stay at a node s. Circular traps such s : t, s and t : s, t are also possible. A policy δ with finite vδ can easily be constructed, however, using a breadth-first search that starts at the goal node g and follows the edges in reverse direction. Initially, the action α = s : g, s is assigned to each node s that has a direct edge to the goal. Recursively, actions α = s : b(s), s are then assigned to other nodes s, where b(s) denotes the node’s predecessor in the search (i.e., a node one step closer to the goal). The above algorithm performs a backwards search through every edge, and thus takes O(E) time, where E is the number of edges in the graph. It assigns actions that impose a (non-circular) tree structure on the graph, with goal g forming the root of the tree (see Figure 2). In particular, each node xn is part of a chain of nodes leading to the goal xn → . . . → xk → xk−1 → . . . → g. Assume xk and xk−1 are two successive nodes along that chain. By Equation 17, v[k] = r(xk , α) + pxk xk−1 v[k − 1] + pxk xk−1 v[k], (27) so v[k] =
r(xk , α) + v[k − 1]. pxk xk−1 14
(28)
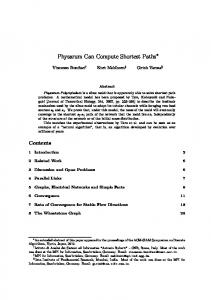
Actual shortest paths (Dijkstra): Policy a: b b: g c: g
Length 10 6 4
Expected shortest paths: Policy a : c, b, a b : g, c, b c : g, c
Length 11.94 7.90 4.25
Figure 3: A sample graph and its actual and expected shortest path lengths to goal node g. The top number on each edge represents the probability, the bottom number the length. Since the probabilities for each landmark are non-zero, and the costs are finite, by induction from the goal landmark g, each v[k] through v[n] is finite. Therefore the above breadth-first search algorithm gives a suitable starting policy δ (0) for the policy iteration algorithm. We now have convergence proofs for both VI and PI algorithms, and also an algorithm for constructing an initial policy for PI. To our knowledge, no theoretical results exist about the convergence speed of either algorithm. Thus, in order to assess the practicality of both VI and PI algorithms, we now turn to our empirical evaluation.
5
Experiments
We have implemented both the value iteration and policy iteration algorithms, and have performed an extensive experimental evaluation to assess their respective performance. Our implementation is in C, and we use Matlab for solving the linear system of equations in the policy iteration algorithm. 15
As a first step in both algorithms we compute the actual shortest paths (ignoring the probabilities) using Dijkstra’s shortest path algorithm. This is done for several reasons: First, in a graph that is being constructed by a robot exploring the environment, the goal may not be reachable from all nodes (e.g., from nodes that the robot has only seen but not yet visited). Running Dijkstra’s algorithm will identify these nodes, which can then be removed before solving the ESP problem. Second, the lengths of the actual shortest paths are lower bounds on the lengths of the expected shortest paths, and can be used as better initial estimates for the unknowns Eng for the value iteration algorithm. (Since the VI convergence proof is based on bounded increasing sequences, it extends to any start value that is component-wise smaller than the solution.) Finally, for policy iteration, it turns out that the actual shortest paths provide an alternate way of finding an initial policy that yields finite expected lengths, and thus a solvable system. While the breadth-first search algorithm from Section 4.2 for finding an initial policy is asymptotically faster, extra memory and time are needed to establish back-pointers along all edges before the actual search, which are not required by Dijkstra’s algorithm. In practice, we have found that the two methods have very similar running times. Figure 3 shows a small sample graph together with its actual and expected shortest paths, and corresponding policies. For testing purposes we have generated more than 50,000 graphs with different properties, including number of nodes N , number of edges E, and range of probability values. Graphs used have up to 3000 nodes, and graph densities range from sparse (E ∝ N ) to dense (E ∝ N 2 ). The probability values are drawn from uniform distributions characterized as very low (0.0001–0.001), low (0.0001–0.5), full (0.0001–1), high (0.25–1), or very high (0.75–1). The graphs were generated by allocating N nodes, and adding E edges between random pairs of nodes. Additional edges were then added between disconnected components until the goal node was reachable from all other nodes. Below we report on our results on such graphs. We have also experimented with other graph structures, including large diameter “corridor” graphs, and “multi-room” graphs (sparsely connected collections of highly connected subgraphs, simulating the visibility graphs of multi-room buildings), but have not found significant differences in convergence. The plots shown in Figure 4 measure the number of iterations necessary for VI and PI as a function of the number of nodes N in the graph. Each plot shows the results of 1250 individual experiments on random graphs with up to 2500 nodes. We have performed such experiments for many different 16
Iterations vs. number of nodes N 1000000
1000000
100000
100000
10000
10000
1000
1000
100
100
VI
10
10 0
PI
500
1000
1500
2000
2500
0
12
12
10
10
8
8
6
6
4
4
2
2
0
500
1000
1500
2000
2500
0 0
500
1000
1500
2000
2500
0
Sparse graphs
500
1000
1500
2000
2500
Dense graphs
Figure 4: Number of iterations for VI (first row) and PI (second row) algorithms as a function of the number of nodes in the graph. The plots on the left show results for sparse graphs (E ≈ N ), the plots on the right show results for dense graphs (E ≈ N 2 /15). types of graphs and parameters. The plots in Figure 4 contrast sparse graphs (E ≈ N ) with dense graphs (E ≈ N 2 /15), both with full random probabilities (ranging from 0.0001 to 1). Examining the plots in the first row of Figure 4, it can be seen that the value iteration algorithm requires large numbers of iterations (often upwards of 10,000) on sparse graphs, while it converges much faster on dense graphs (typically within a few hundred iterations). The likely reason for this is that changes in the variables can propagate much faster in densely connected graphs. Note that the initial “peak” in the second plot is due to our definition of “dense” as E ≈ N 2 /15, which for small N still results in fairly sparse graphs. Interestingly, the average number of iterations for dense graphs does not increase with larger values of N — if anything, there is a slight decrease. Results for the policy iteration algorithm (shown in the second row of Figure 4) are vastly different. In all cases, PI only takes very few iterations 17
to converge. While the number of iterations increases with the number of nodes, the curves flatten out quickly, and the distributions of iterations for N = 1000 are very similar to those for N = 2500. Even for the largest N , most sparse graphs take no more than 6–9 iterations to converge; the dense graphs rarely take more than 7 or 8 iterations. In fact, among the more than 50,000 graphs we have generated, only a handful require 11 iterations, only 3 require 12 iterations, and we have yet to find a graph that requires more than 12 iterations. As is the case for VI, the distribution of iterations for dense graphs is narrower and has fewer outliers. We have also investigated the effect of different probability ranges. Figure 5 shows the number of iterations of the VI and PI algorithms on sparse graphs for three different probability ranges: very low (0.0001–0.001), full (0.0001–1), and very high (0.75–1). The plot on the left shows that the VI algorithm is strongly affected by the probabilities. In particular, very low probabilities cause very slow convergence, while very high probabilities cause very fast convergence. The reason for the latter is that the start values computed using Dijkstra’s algorithms are very close to the lengths of the expected shortest paths if all probabilities are high. In our experience, the extreme case of very low probabilities is unlikely to occur in practical applications. Similarly unlikely are uniformly high probabilities, and even a few edges with low probabilities can slow down the convergence. The PI algorithm, on the other hand, is less affected by the probabilities, as shown in the plot on the right. In particular, there is no clear distinction between very low and full probabilities. Uniformly high probabilities do reduce the number of iterations significantly, but, as argued before, this is not a typical scenario. The results of other experiments we have performed are consistent with the ones reported here. In particular, for PI, the curve defined by the number of iterations vs. graph size always resembles a logarithmic shape, indicating that few iterations are necessary even for very large graphs. Also, we have been unable to construct “pathological cases” that require a certain minimum number of iterations for PI. Value iteration, on the other hand, can be made to converge arbitrarily slowly by constructing graphs whose edges all have very low probabilities as shown in Figure 5. Although such graphs may not be common in practical applications, this is further evidence for the unpredictability of the convergence speed of VI that is also exhibited in the top left plot in Figure 4. We now turn to the actual running times of the two algorithms. Figure 6 shows plots that compare the running times of VI and PI as a function of N on the same sets of graphs as in Figure 4, using a full probability 18
Iterations vs. number of nodes N 1000000
12 10
100000
8 10000 6 1000 4 100
2
10
0 0
100
200
300
400
500
0
VI
100
200
300
400
500
PI
Figure 5: Number of iterations for VI (left) and PI (right) for very low (◦), full (×), and very high (�) edge probabilities on sparse graphs. range. All experiments were performed under Linux on a 1.53 GHz Athlon machine with 512 MB of memory. It can be seen that policy iteration clearly outperforms value iteration, in particular on sparse graphs, where PI is faster by several orders of magnitude. Much of this performance gain can be attributed to using Matlab’s sparse matrix representation and sparse equation solver. (Using a regular solver for sparse graphs is slower by at least a factor of 10.) On dense graphs, the margin between PI and VI is much smaller, since VI takes fewer iterations than it does on sparse graphs, but PI’s equation solving step requires more work. Even in this case, however, PI is the winner, running at least a factor of 2 faster than VI. The only case in which VI outperforms PI is on dense graphs with uniformly high probabilities, where VI converges very quickly, similar to the results shown in Figure 5. It should be noted that the reported running times are process times. When we measure total time, the running times of PI and VI on dense graphs become almost identical. The likely reason for this is that the time for PI’s memory allocation steps are not measured in the process time. Graphs encountered in real environments span the range of the types of graphs discussed here. In practical applications, sparse graphs will be more common, and PI, although slightly more difficult to implement, will be the better choice. A practical issue is the memory requirements of the two algorithms. VI, which only needs to evaluate the system of equations, requires only enough 19
Running times (seconds) vs. number of nodes N
1000 100 10
Sparse graphs
1 0.1 0.01 0
500
1000
1500
2000
2500
1000 100 10
Dense graphs
1 0.1 0.01 0
500
1000
1500
2000
2500
Figure 6: Running times in seconds for VI (×) and PI (+) algorithms as a function of the number of nodes in the graph. The first plot shows results for sparse graphs (E ≈ N ); the second plot shows results for dense graphs (E ≈ N 2 /15).
20
memory to store the graph. PI, which needs to solve the system, needs up to O(N 2 ) space to store the matrix representing this system. Given a large enough graph, the matrix will be too large to be allocated, making PI impossible to use. For our implementation and hardware, this happens for dense graphs upwards of about 2800 nodes. In such situations, VI would be the only choice. Since we are using Matlab’s sparse matrix representation, however, the memory is sufficient for much larger sparse graphs. For example, a sparse graph with 15,000 nodes and about 25,000 edges can still be solved using PI in less than 1 second.
6
Conclusion
In this paper we have investigated the expected shortest path (ESP) problem, which arises in landmark-based robot navigation where the reliability of landmark detection is modeled explicitly. We have presented two algorithms for its solution, value iteration (VI) and policy iteration (PI), and have proven their convergence properties in the context of a MDP formulation. Using an extensive experimental analysis, we have demonstrated the practicality of both algorithms, and have shown that PI usually outperforms VI. In particular, on sparse graphs, PI is orders of magnitude faster. On very large dense graphs, however, PI cannot be used due to its larger memory requirements. In future work we plan to investigate the application of our algorithms to navigation using natural landmarks extracted from the environment. Building on related work in this area [11, 19, 21, 27], we aim to extend our probabilistic framework to obtain more reliable and efficient path planners for vision-based robot navigation in arbitrary environments.
Acknowledgments The authors are grateful for the insights of Steve Abbott and Deniz Sarioz that contributed to this work, and for the assistance of Darius Braziunas, Victor Dan, Cristian Dima, Huan Ding, David Ehringer, Dan Knights, Jeff Lanza, Fafa Paku, and Peter Wall in the implementation of the navigation framework presented here. Support for this work was provided in part by the National Science Foundation under grants IIS-0118892, CCR-9902032, CAREER grant 9984485, POWRE grant EIA-9806108, by Middlebury College, by the Howard Hughes Medical Institute, and by the Council on Undergraduate Research.
21
References [1] R. K. Ahuja, J. B. Orlin, S. Pallottino, and M. G. Scutell` a. Dynamic shortest paths minimizing travel times and costs. Networks, 41(4):197– 205, 2003. [2] J. F. Bard and J. L. Miller. Probabilistic shortest path problems with budgetary constraints. Computers and Operations Research, 16(2):145– 159, 1989. [3] C. Becker, J. Salas, K. Tokusei, and J.-C. Latombe. Reliable navigation using landmarks. In Proceedings of IEEE International Conference on Robotics and Automation, pages 401–406, June 1995. [4] D. P. Bertsekas and J. N. Tsitsiklis. An analysis of stochastic shortest path problems. Mathematics of Operations Research, 16(3):580–595, 1991. [5] D. M. Blei and L. P. Kaelbling. Shortest paths in a dynamic uncertain domain. In Proceedings of the IJCAI Workshop on Adaptive Spatial Representations of Dynamic Environments, 1999. [6] B. Bonet and H. Geffner. Solving stochastic shortest-path problems with RTDP. Technical report, UCLA, 2002. [7] A. Briggs, D. Scharstein, and S. Abbott. Reliable mobile robot navigation from unreliable visual cues. In Donald, Lynch, and Rus, editors, Algorithmic and Computational Robotics: New Directions, A. K. Peters, pages 349–362, 2001. [8] A. Briggs, D. Scharstein, D. Braziunas, C. Dima, and P. Wall. Mobile robot navigation using self-similar landmarks. In Proceedings of the IEEE International Conference on Robotics and Automation (ICRA 2000), pages 1428–1434, April 2000. [9] C. J. Colbourn. The Combinatorics of Network Reliability. Oxford University Press, 1987. [10] A. Eiger, P. B. Mirchandani, and H. Soroush. Path preferences and optimal paths in probabilistic networks. Transportation Science, 19(1):75– 84, 1985.
22
[11] C. Fennema, A. Hanson, E. Riseman, J. R. Beveride, and R. Kumar. Model-directed mobile robot navigation. IEEE Transactions on Systems, Man, and Cybernetics, 20(6):1352–1369, 1990. [12] R. W. Hall. The fastest path through a network with random timedependent travel times. Transportation Science, 20(3):182–188, 1986. [13] L. Kavraki and J.-C. Latombe. Randomized preprocessing of configuration space for fast path planning. In Proceedings of IEEE International Conference on Robotics and Automation, pages 2138–2145, May 1994. [14] A. Lazanas and J.-C. Latombe. Landmark-based robot navigation. Algorithmica, 13(5):472–501, May 1995. [15] C. Lin and R. Tummala. Mobile robot navigation using artificial landmarks. Journal of Robotic Systems, 14(2):93–106, 1997. [16] R. P. Loui. Optimal paths in graphs with stochastic or multidimensional weights. Communications of the ACM, 26(9):670–676, 1983. [17] O. Madani, A. Condon, and S. Hanks. On the undecidability of probabilistic planning and infinite-horizon partially observable markov decision process problems. Artificial Intelligence, 147(1/2):5–34, 2003. [18] M. Mani, A. Zelikovsky, G. Bhatia, and A. Kahng. Traversing probabilistic graphs. Technical Report 990010, UCLA, 1999. [19] B. Nickerson, P. Jasiobedzki, D. Wilkes, M. Jenkin, E. Milios, J. Tsotsos, A. Jepson, and O. N. Bains. The ARK project: Autonomous mobile robots for known industrial environments. Robotics and Autonomous Systems, 25:83–104, 1998. ˇ [20] M. H. Overmars and P. Svestka. A probabilistic learning approach to motion planning. In Goldberg, Halperin, Latombe, and Wilson, editors, 1994 Workshop on the Algorithmic Foundations of Robotics, A. K. Peters, pages 19–37, 1995. [21] C. Owen and U. Nehmzow. Landmark-based navigation for a mobile robot. In Proceedings of Simulation of Adaptive Behaviour. MIT Press, 1998. [22] C. H. Papadimitriou and M. Yannakakis. Shortest paths without a map. Theoretical Computer Science, 84:127–150, 1991.
23
[23] J. Pineau, G. Gordon, and S. Thrun. Policy-contingent abstraction for robust robot control. In Proceedings of the 19th Conference on Uncertainty in Artificial Intelligence, 2003. [24] J. S. Provan and M. O. Ball. The complexity of counting cuts and of computing the probability that a graph is connected. SIAM Journal of Computing, 12(4), November 1983. [25] M. Puterman. Markov Decision Processes: Discrete Stochastic Dynamic Programming. John Wiley & Sons, New York, NY, 1994. [26] D. Scharstein and A. Briggs. Real-time recognition of self-similar landmarks. Image and Vision Computing, 19(11):763–772, September 2001. [27] R. Sim and G. Dudek. Mobile robot localization from learned landmarks. In Proceedings of IEEE/RSJ Conference on Intelligent Robots and Systems (IROS), Victoria, BC, October 1998. [28] R. Simmons, J. Fernandez, R. Goodwin, S. Koenig, and J. O’Sullivan. Xavier: An autonomous mobile robot on the web. IEEE Robotics and Automation Magazine, 1999. [29] R. Simmons and S. Koenig. Probabilistic navigation in partially observable environments. In Proceedings of the International Joint Conference on Artificial Intelligence, pages 1080–1087, 1995. [30] C. J. Taylor and D. J. Kriegman. Vision-based motion planning and exploration algorithms for mobile robots. In Goldberg, Halperin, Latombe, and Wilson, editors, 1994 Workshop on the Algorithmic Foundations of Robotics, A. K. Peters, pages 69–83, 1995. [31] S. Thrun, M. Beetz, M. Bennewitz, W. Burgard, A. B. Cremers, F. Dellaert, D. Fox, D. Hahnel, C. Rosenberg, N. Roy, J. Schulte, and D. Schulz. Probabilistic algorithms and the interactive museum tour-guide robot Minerva. International Journal of Robotics Research, 19(11), 2000. [32] L. G. Valiant. The complexity of enumeration and reliability problems. SIAM Journal of Computing, 8(3), August 1979. [33] F. Zanichelli. Topological maps and robust localization for autonomous navigation. In Proceedings of the International Joint Conference on Artificial Intelligence, Workshop ROB-2, 1999.
24