IEEE TRANSACTIONS ON NUCLEAR SCIENCE, VOL. 52, NO. 5, OCTOBER 2005. Experimental Comparison of Pixel Detector Arrays and CCD-Based Systems ...
1760
IEEE TRANSACTIONS ON NUCLEAR SCIENCE, VOL. 52, NO. 5, OCTOBER 2005
Experimental Comparison of Pixel Detector Arrays and CCD-Based Systems for X-Ray Area Detection on Synchrotron Beamlines Cyril Ponchut, Federico Zontone, and Heinz Graafsma
Abstract—We compared the detection characteristics of a pixel area X-ray detector, Medipix-2, with those of a CCD-based X-ray detector. The goal was to challenge the overall imaging performance of the emerging pixel area detection technique against that of a well-known detection device, in view of applications on synchrotron beamlines. A CCD-based detector was chosen as the reference because of the intensive and widespread use of CCD systems on beamlines. In order to establish the comparison on an absolute side-by-side basis we built an optimized CCD-based system with the same input pixel size as Medipix-2 and we characterized both systems in identical conditions. We present the results obtained, in particular the frequency-dependent noise, spatial response and DQE. We also report on various test experiments with Medipix-2 in X-ray scattering and X-ray imaging using a synchrotron source. Index Terms—DQE, MTF, pixel detectors, SAXS, synchrotron, X-ray imaging.
I. INTRODUCTION
P
HOTON-COUNTING pixel arrays are nowadays considered of highest interest for various synchrotron experiments. The main advantages over the familiar CCD-based systems are the elimination of noise hits by energy thresholding, the absence of large tails in the point-spread function as resulting from direct X-ray conversion in a semiconductor, some energy discrimination capability, as well as the high possible frame rate owing to parallel readout architectures. This opens new perspectives at third generation synchrotron facilities for applications currently limited by the detector performance, like small-angle X-ray scattering (SAXS) [1], [2] and protein crystallography [3], [4] which both need faster detectors in order to cope with the beam flux available at the sample. In addition SAXS experiments require a detection dynamic range higher than that currently achievable with CCD systems [1]. Applications in X-ray diffraction [2] and in X-ray imaging may also be considered. In order to better quantify the benefits as well as the weaknesses of photon-counting pixel arrays in comparison to well-known and widely used CCD-based systems we carried out a side-by-side characterization ofboth devices,usingaCCDdetectorof thesame image geometry and same pixel size as the pixel array. Photon counting pixel arrays and CCD detectors are based on totally different detection principles, respectively the single photon detecManuscript received November 10, 2004; revised May 17, 2005. The authors are with the European Synchrotron Radiation Facility, Grenoble F-38000, France. Digital Object Identifier 10.1109/TNS.2005.856624
tion with direct X-ray to charge conversion in a semiconductor and the energy fluence integration with intermediate X-ray to light conversion in a phosphor screen. However by considering both systems essentially as imaging devices we could define a common set of imaging parameters and thus apply identical measurement methods for both systems, thereby obtaining consistent and directly comparable characterization data. Finally, in order to illustrate the previous results and to provide examples for possible applications, we completed this study by some test experiments carried out on synchrotron beamlines. II. SYSTEMS DESCRIPTION The photon-counting pixel array, referred to as MPX2, is a Medipix2 ASIC [5] bump-bonded to a 300 m thick pixellated Silicon sensor. Each pixel acts as an independent X-ray photon counter including a charge preamplifier, a shaper (peaking time 150 ns), a discriminator (minimum energy threshold 6–7 keV with the Silicon sensor) and an event counter (capacity 8001 counts). The image produced during an exposure is the map of the number of events above threshold detected in each pixel. The fine threshold adjustment of each pixel [5] is used to reduce the dispersion of energy thresholds between pixels. The CCD detector consists of a back-illuminated slow scan C (VersArray CCD camera thermoelectrically cooled to 1300B, Roper Scientific), an X-ray converter screen made of a 15 m thick layer of P43 (Gd O S:Tb) phosphor powder (Proxitronic) deposited on a fiberoptic faceplate with a fiber size of 6 m and a numerical aperture of 1 (Hamamatsu), and a high resolution lens tandem with a magnification of 1:1.5 and a numerical aperture of 0.24 (Rodenstock, Kinoptik). The input phosphor screen converts the input X-ray signal into a visible light image projected on the CCD sensor by the coupling lens. The produced image is the map of the integrated energetic fluence of the X-ray beam absorbed in the phosphor during the X-ray exposure. The CCD system is designed to match both the image geometry and the X-ray quantum absorption efficiency of MPX2 (Table I). III. IMAGING CHARACTERIZATION The X-ray source is a Molybdenum sealed anode operated at 25 kV and filtered with 100 m Zirconium. As a first order approximation the residual Bremmstrahlung and the Mo K emission line after Zr filtration are neglected, and the resulting spectrum is assimilated to a monoenergetic line at 17.4 keV (Mo K emission line).
0018-9499/$20.00 © 2005 IEEE
PONCHUT et al.: EXPERIMENTAL COMPARISON OF PIXEL DETECTOR ARRAYS AND CCD-BASED SYSTEMS
TABLE I MAIN DETECTOR CHARACTERISTICS
A. Gain Calibration The gain G of a linear system is defined as the ratio of the output signal to the corresponding input signal, i.e., in our case as the ratio of the average image level (after dark subtraction for the CCD) to the corresponding average incoming X-ray flux per pixel. The image level is expressed in ADU (analog-to-digital units). For MPX2, one ADU represents one detected event. G is not used as a figure of merit, rather, it serves to scale the results from the two systems to the same physical units. Specifically, the absolute counts obtained with a single photon detector. The incoming X-ray flux at the detector input is calibrated with a 5 mm thick NaI scintillating photon counter. The beam aperture is reduced with slits in order to operate the calibrating counter within its linear range, i.e., below a few tens of thousands counts/second. The MPX2 discriminator threshold is set to about 8 keV for complete noise rejection with minimum loss of absorbed photons. The detected count rate with MPX2 is about 1030 counts/pixel/s, i.e., well below the count rate limit of 1 MHz [5], thereby ensuring that the dead time error is negligible and that MPX2 is operated in its linear range. In these ADU/incident X-ray and conditions we obtain ADU/incident X-ray. The MPX2 gain is close to the Si sensor quantum absorption efficiency, thereby showing that most absorbed photons are actually detected. This will be confirmed by DQE measurements (Section F). This suggests that charge splitting at pixel edges [6] does not affect significantly the overall number of counted events, one explanation being that lost events due to charge splitting may be compensated by a similar amount of double counts. However this situation is due to the particular setting of the energy threshold (8 keV) at about half of the beam energy (17.4 keV). For other threshold settings the balance between lost and double counts, hence the measured gain, could differ. The CCD gain results from the product of phosphor quantum absorption, phosphor optical yield, optical coupling yield, CCD quantum efficiency, and ADC conversion gain. It must be outlined that since the gain includes the sensor quantum efficiency for both systems, it is dependent on the X-ray energy, as well as are all the quantities rescaled into incident photon equivalents. B. Dark Noise, Dark Signal The dark noise is measured as the standard deviation in a small region (typically 50 50 pixels) of the subtraction of two
1761
dark exposures of 1 second, divided by sqrt(2) for normalization to a single image and divided by gain G for conversion into input-equivalent units. Following this procedure the measure MPX2 dark noise is zero in any region including no noisy pixels (15–20 pixels typically at 8 keV energy threshold), and the CCD dark noise is typically 3 ADU/pixel r.m.s, i.e., 0.7 incident X-rays/pixel r.m.s. The dark signal is measured as the average level in the subtraction of a short dark exposure from a long one, divided by the difference in integration times and converted into equivalent incident X-rays. With MPX2 we thereby obtain typically 960 counts/second in total for the whole matrix, i.e., an inputincident X-rays/pixel/second. It equivalent signal of 4.3 x must be mentioned that this value may vary notably from one MPX2 assembly to another. If masking the few noisy pixels the total dark signal is less than 1 count/second for the whole incident X-rays/pixel/second matrix, i.e., less than 4.5 x equivalent. In comparison, the measured dark signal of the CCD C cooling is 0.45 ADU/pixel/second, i.e., 0.1 incident at X-rays/pixel/second equivalent. C. Line Spread Function (LSF), Dynamic Range The presampling LSFs [Fig. 1(a)] are measured with the tilted slit method [7], resulting in LSF oversampling by a factor for a tilt angle . No flatfield correction is performed. The CCD LSF FWHM is notably larger than one pixel due to light scatter in the phosphor screen and to optical imperfections. This also creates broad LSF tails [Fig. 1(b)]. LSF tails combine with dark offset fluctuations and readout noise to limit the . The MPX2 practical dynamic range of the CCD to about LSF FWHM is sharper (FWHM roughly equal to the pixel pitch) . The wings of and the observed dynamic range is close to the MPX2 LSF are interpreted as mainly residual X-ray scatter from the X-ray slits. Scattering from the MPX2 assembly itself is deemed negligible because at the used energy (17.4 keV) the K fluorescence lines of Ag (conductive glue) and Sn (bump-bonds) are not excited, and the Compton scattering in the Si sensor is negligible in comparison with the dominant photoelectric interaction. The imperfect slit collimation was not detectable with the CCD since it was masked by the internal detector scattering. Hence the use of pixel arrays with current beamline setups may lead to situations where the precision of the data is limited by the beam quality rather than by the detector itself. The dynamic range can be defined as the ratio of maximum to minimum detectable signals. The minimum signal is one count/pixel for MPX2, and is defined as the r.m.s. background noise in a dark image for an integrating CCD detector. Hence the dynamic range of MPX2 increases linearly with the number N of accumulated frames, whereas it increases at best as with the CCD due to quadratic noise build-up. D. Modulation Transfer Function (MTF) The presampling MTFs are calculated as the module of the Discrete Fourier Transform of the oversampled LSF profiles ob. These are compared tained previously, normalized to 1 at with a theoretical MTF calculated for a 55 m square pixel with uniform sensitivity convoluted with a 20 m X-ray slit (Fig. 2). The MTF of MPX2 at Nyquist frequency is slightly lower than
1762
IEEE TRANSACTIONS ON NUCLEAR SCIENCE, VOL. 52, NO. 5, OCTOBER 2005
Fig. 1. Line spread functions. (a) Oversampled LSF obtained with the tilted slit method. Slits: 1 mm thick Tungsten, width 20 �m, tilt angle 2:2 with respect to pixel matrix. (b) LSF tails obtained by summing 80 image cross sections perpendicular to the slit. The MPX2 image is obtained by summing 20 frames in order to reach the same image level as the CCD image.
Fig. 2. Presampling MTFs calculated from presampled LSFs, and theoretical MTF for a square pixel with uniform response. On the horizontal axis F = 1 is the sampling frequency and F = 0:5 is the Nyquist frequency.
Fig. 3. NPS profiles expressed in incident photon units for direct quantitative comparison. On the horizontal axis F = 1 is the sampling frequency and F = 0:5 is the Nyquist frequency.
expected (0.51 instead of 0.60), and the MTF lobe for is strongly damped. This is because the actual spatial response of one pixel is smoother than the used model due to the loss of events close to the pixel edge [6], thereby leading to a reduction of the MTF at high frequencies. Other works report on noticeably different MTF data for MPX2, for example a MTF at Nyquist frequency of about 0.2, [8] however this result was obtained at 50 keV average energy with a thicker Silicon sensor (525 m). The higher amount of X-ray scattering (fluorescence, Compton) at higher energy as well as the longer charge path in the thicker sensor both contribute to reduce the MTF. The MTF of the CCD is strongly attenuated above the Nyquist frequency due to image blurring caused by light scattering in the phosphor, in the fiberoptic plate, and to a lesser extend in the coupling lens.
favorable to the CCD, as it will result in a lower r.m.s. noise in CCD images than in MPX2 images for the same input X-ray flux.
E. Noise Power Spectrum (NPS) Both detectors are exposed to the same flood-field X-ray beam. For each system two images are recorded at the same exposure then subtracted and normalized by sqrt(2). This eliminates nonrandom image noise components like incident beam and sensor inhomogeneities which are correctable by flatfield correction and which should therefore not be included in the NPS. A 1-D NPS is obtained by angular integration of the 2-D NPS [9] calculated in a homogeneous region of 128 128 pixels (Fig. 3). As predicted [10] the NPS of MPX2 is white due to the uncorrelated pixel response in direct detection, whereas the NPS of the CCD is strongly attenuated at Nyquist frequency due to the noise smoothing effect of light scattering. This is
F. Detective Quantum Efficiency The Detective Quantum Efficiency (DQE) is a reference figure of merit for the comparison of detectors. It is formally defined as [11] (1) where are the average value and the noise of the measured are the average value and signal (i.e., the image levels) and noise of the physical signal (i.e., the incident beam flux). For a perfect detector the DQE is equal to its absorption quantum efficiency QE. Expressing the DQE in the Fourier domain (see for example [12]) leads to (2) where G is the gain, MTF is the presampling MTF, is the radial noise power spectrum in the image, N is the number and MTF spectra. The DQE profiles calcuof points in lated according to (2) are shown in Fig. 4. For both detectors, is close to the quantum absorption limit (Table I). For MPX2 this confirms that charge collection disturbances at pixel edges like charge sharing [6] do not have a detrimental effect on the DQE. A remarkable result is that both detectors
PONCHUT et al.: EXPERIMENTAL COMPARISON OF PIXEL DETECTOR ARRAYS AND CCD-BASED SYSTEMS
1763
Fig. 4. DQE profiles calculated from NPS and MTF profiles.
have relatively similar DQE profiles although having quite different NPS and MTF. For the CCD the low noise at high frequency compensates for the low MTF, whereas for MPX2 the noise aliasing reduces the DQE [10]. At medium frequency the CCD has a slightly higher DQE than MPX2, which is attributed to the absence of noise aliasing.
Fig. 5. Diffraction pattern of the first YBCO layers (weak pattern in the left) growing on a YSZ substrate (large central line). Data collected at the ID15 ESRF beamline.
G. Linearity The MPX2 linearity of response as a function of incident count rate will be quantified in further tests. Due to their similar event shaping times (150 ns) we expect the MPX2 linearity to be similar to that reported for Medipix-1 [6], for which we measured a dead time error of about 3% at 100 000 cps. Hence a dead time correction is necessary for high count rates in order to restore a linear response. For the CCD the average nonlinearity as specified by the manufacturer is less than 2%. However experience with CCD systems shows that nonlinearity often increases at low incident flux due to instabilities of the average background reference level which are typically a few ADUs in amplitude. MPX2 having no dark background is not prone to this problem and can therefore achieve a highly linear response at low count rates.
Fig. 6. Scattering pattern of colloidal PMMA with 40% concentration, obtained with MPX2. Data collected at the ID10 ESRF beamline.
H. Time Response The whole MPX2 matrix can be readout in a few tens of milliseconds in serial readout mode (the content of all pixel counters are concatenated and output to a serial readout port) and in 0.3 ms in parallel readout mode (the contents of pixel counters are output to a 32 bit parallel port) [5]. Partial matrix readout is not possible. For comparison the CCD readout speed is 274 ms in 4 4 binning, mainly limited by the ADC speed. For both devices, no exposure can be performed during readout. I. Energy Discrimination Unlike the CCD system, MPX2 allows to collect energy-discriminated data by using the low and high discriminator thresholds. However a detailed anaysis of this feature is not in the scope of this work since there could be no possible comparison with the CCD system. Energy discrimimation capabilities of photon-counting pixel arrays are already iluustrated in previous works (for example [2]).
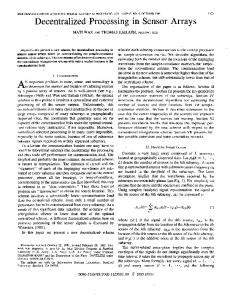
Fig. 7. Scattered intensities of PMMA particles, comparison between MPX2 and a point detector. Data have been normalized with respect to the point detector. Data collected on ID10 ESRF beamline.
IV. APPLICATIONS AND EXAMPLES A. In-Situ Diffraction Study of the Growth of Thin Superconducting YBa2Cu3O7-x Layers on Top of Buffered Crystalline Substrates Using the SOL-GEL Techniques The excellent spatial resolution and the single photon sensitivity of pixel detectors can be used to study small signals in
1764
IEEE TRANSACTIONS ON NUCLEAR SCIENCE, VOL. 52, NO. 5, OCTOBER 2005
Fig. 8. Image of a lead bar pattern. (a) CCD. (b) MPX2. Image gray levels are scaled in incident counts/pixels and displayed with the same gray levels range. The image contrast is inverted for better visibility. Exposure 5 s. Energy 17.4 keV (filtered Mo anode), tube current 15 mA. The numbers in the images are the bar spatial frequencies in lp/mm.
the vicinity of strong signals. Fig. 5 shows part of the diffrac(YBCO) tion pattern of a thin super conducting YBa Cu O layer grown on top of a stainless steel substrate covered by an Yttrium stabilized Zirconium (YSZ) buffer layer. The goal of the experiment was to follow the growth behavior of the YBCO layer as function of temperature. The starting material is a so called SOL-GEL solution containing the components of the superconducting material. Upon heating the sample to 800 C, the superconducting material is formed and crystallizes at the same time. This means that in the initial stages there is no YBCO diffraction peak. Fig. 5 shows the final stage, where the YBCO signal is only a few photons/pixels. The experiment was performed with 39 keV X-rays, needed to penetrate the furnace in which the sample was mounted. The experiment showed the YBCO layer to grow during the first 10 minutes after which it remains stable. This in contrast to current believe that the growth hours. This result would have process takes between 1 and been more difficult to obtain with the CCD system due to the detector noise masking the weak signal. B. Small-Angle X-Ray Scattering The SAXS intensity from a colloidal suspension of PMMA particles has been used to compare MPX2 to a standard (scintillation) dimensionless detector, with the intent to illustrate the ability of a small-pixel photon-counting array to provide excellent SAXS data. The measurement was performed in the frame of an X-ray Photon Correlation Spectroscopy experiment where a small (12 m) coherent X-ray beam of 8 keV energy, monochromatized by a standard Si111 mirror, is used. A reference SAXS profile was recorded with the dimensionless detector by scanning a 100 m wide slit placed at 2285 mm
from the sample with an acquisition time of 5 seconds per point. This profile was compared to the one obtained by azimuthal integration of a 2D scattering pattern acquired with MPX2 in a 1 second exposure (Fig. 6). MPX2 was placed at nearly the same distance to the sample as the dimensionless detector. The SAXS intensities are plotted on Fig. 7 as a function of being the the momentum-transfer Q scattering angle and the wavelength). It shows the typical intensity modulations coming from spherical particles. The MPX2 profile nicely follows the scan with the point detector over many decades, showing the intrinsic linearity of the MPX2 detector inherent to its photon counting capability. C. Imaging Images of the same resolution pattern (Huttner type 21) are taken with the CCD and with MPX2 (Fig. 8). The pattern is made of a lead foil of 0.02 mm thickness inserted into a transparent plastic housing. A flatfield correction is applied to both images. Dead or noisy pixels are not corrected. The MPX2 image shows a better resolution than the CCD image however the aliasing artifacts hamper the visibility of the resolution lines. There is nearly no aliasingdistortion in the CCD image but the contrast in the lines is poorer. The shot noise isslightly visible in the MPX image background whereas the CCD image background is smooth, thereby illustrating the difference in NPS spectra for both systems. The MPX2 image shows a few dead or noisy pixels but these may be partly corrected by interpolation. Hence as regards imaging applications it is difficult to objectively rank both systems in the general case. Finally the CCD may be found well suited for general-purpose or qualitative imaging owing to its smoother image noise and the absence of aliasing, whereas the MPX2 may be preferred for quantitative imaging applications like for instance
PONCHUT et al.: EXPERIMENTAL COMPARISON OF PIXEL DETECTOR ARRAYS AND CCD-BASED SYSTEMS
computed tomography, owing to its higher spatial resolution and dynamic range. V. CONCLUSION We performed a side-by-side characterization of an integrating CCD detector and of a direct detection photon counting array having identical pixel sizes and X-ray absorption efficiencies. The CCD shows a slightly higher DQE at medium frequencies probably due to the absence of aliasing, whereas the pixel array has a better DQE at high frequencies owing to its narrower point spread function. However both DQE profiles are relatively comparable despite quite different MTF and NPS characteristics. The imaging characterization and the tests performed on synchrotron beamlines show that the photon-counting array is better than the CCD for small-angle X-ray scattering and for X-ray diffraction with low signals as well as possibly for quantitative imaging, whereas the CCD may be better suited for qualitative imaging owing to a smoother image with no aliasing artifacts. Unlike the CCD system, the pixel array provides energy discrimination possibilities which may allow for enhanced data quality as well as for novel applications. ACKNOWLEDGMENT The authors would like to thank V. Vonk and F. Berberich (ESRF) for their help on the ID15c ESRF beamline. REFERENCES [1] J. F. Bérar, L. Blanquart, N. Boudet, P. Breugnon, B. Caillot, J. C. Clemens, P. Delpierre, I. Koudobine, C. Mouget, P. Potheau, and I. Valin, “A pixel detector with large dynamic range for high photon counting rates,” J. App. Crystallogr., vol. 35, pp. 471–476, 2002.
1765
[2] C. Ponchut and F. Zontone, “Evaluation of Medipix-1 in X-ray scattering and X-ray diffraction applications,” Nucl. Instrum. Methods Phys. Res. A, vol. 510, pp. 29–34, 2003. [3] C. Broennimann, E. F. Eikenberry, R. Horisberger, G. Huelsen, B. Schmitt, C. Schulze-Briese, and T. Tomizaki, “Continuous sample rotation data collection for protein crystallography with the PILATUS detector,” Nucl. Instrum. Methods Phys. Res. A, vol. 510, pp. 24–28, 2003. [4] J. R. Plaisier, R. I. Koning, H. K. Koerten, A. M. V. Roon, E. A. J. Thomassen, M. E. Kuil, J. Hendrix, C. Broennimann, N. S. Pannu, and J. P. Abrahams, “Area detectors in structural biology,” Nucl. Instrum. Methods Phys. Res. A, vol. 509, pp. 274–282, 2003. [5] X. Llopart, M. Campbell, R. Dinapoli, D. SanSegundo, and E. Pernigotti, “Medipix2: A 64-k pixel readout chip with 55 �m square elements working in single photon counting mode,” IEEE Trans. Nucl. Sci., vol. 49, no. 5, pp. 2279–2283, Oct. 2002. [6] C. Ponchut, J. L. Visschers, A. Fornaini, H. Graafsma, M. Maiorino, G. Mettivier, and D. Calvet, “Evaluation of a photon-counting hybrid pixel detector array with a synchrotron X-ray source,” Nucl. Instrum. Methods Phys. Res. A, vol. 484, pp. 396–406, 2002. [7] H. Fujita, D.-Y. Tsai, T. Itoh, K. Doi, J. Morishita, K. Ueda, and A. Ohtsuka, “A simple method for determining the modulation transfer function in digital radiography,” IEEE Trans. Med. Imag., vol. 11, no. 1, pp. 34–39, Mar. 1992. [8] B. Surre, M. Caria, J. Chaput, T. Hassoun, F. Laverroux, and L. Sarry, “First DQE measurement of 500 �m silicon hybrid pixel sensor with photon counting readout for X-ray medical imaging,” Nucl. Instrum. Methods Phys. Res. A, vol. 546, pp. 24–27, 2005. [9] R. Aufrichtig, Y. Su, Y. Cheng, and P. R. Granfors, “Measurement of the noise power spectrum in digital x-ray detectors,” Proc. SPIE-Int. Soc. Opt. Eng., vol. 4320, pp. 362–372, 2001. [10] J. P. Moy, “Image quality of scintillator based X-ray electronic imagers,” Proc. SPIE-Int. Soc. Opt. Eng., vol. 3336, pp. 187–194, 1998. [11] S. M. Gruner, J. R. Milch, and G. T. Reynolds, “Evaluation of area photon detectors by a method based on detective quantum efficiency (DQE),” IEEE Trans. Nucl. Sci., vol. 25, no. 1, pp. 562–565, Feb. 1978. [12] P. R. Granfors, R. Aufrichtig, G. E. Possin, B. W. Gianbattista, Z. S. Huang, J. Liu, and B. Ma, “Performance of a 41 41 cm amorphous silicon flatpanel detector designed for angiographic and R&F imaging applications,” Med. Phys., vol. 30, pp. 2715–2726, 2003.
2