Experimental Investigation of Distribution Transformer Aged Solid Insulation M. J. Mousavi IEEE Student Member
K. L. Butler-Purry IEEE Senior Member
Abstract— In this paper, a laboratory test setup designed to perform transformer insulation experiments at low voltage level is introduced. Monitoring the leakage current flowing through the insulation samples that are taken from an aged distribution transformer is the principle of the investigation. The electrode system utilized and the experimental procedure are described. The test results that highlight important aspects of the insulation behavior concerning incipient fault detection and diagnosis is addressed. The results help identify particular phenomena that might happen when an incipient fault initiates and taking them into account in the characterization of such faults to develop a detection method for the distribution transformer incipient fault. Index Terms-- Distribution transformer, incipient fault, aged solid insulation
custom-built transformer that had been used to perform internal short circuit tests [1]. The physical dimension of samples was approximately 1 × 1 inch. In the experiments, monitoring of the leakage current at low voltage levels was used to evaluate the aging effects of the samples. In section II, the utilized electrode system will be introduced. Test models preparation and conditioning will be addressed and the laboratory set up will be described in detail. In section III, experimental results will be illustrated and discussed. Finally conclusions will be given in Section IV.
I. INTRODUCTION
A. Electrode System In each insulation study with solid insulating materials, there is a need to design an electrode setup to handle samples between electrodes and perform intended experiments. In the past, researchers have considered different designs of electrode systems to meet their specific needs. Wang has used a 60 0 cone-shaped stainless steel point electrode to measure pulsating partial discharge occurring in point dielectric gaps under an alternating voltage [2]. To measure the dielectric current through Fiberglass Reinforced Plastic (FRP) sticks, an electrode system was constructed from two copper plates trimmed with copper tube and the assembly of the testing circuit was shielded and grounded [3]. T.R.Blackburn has built a HV electrode as a Rogowski shape to avoid any edge discharges [4]. In the work presented in [5], a three-terminal electrode system using a guard film was developed for the precise measurement of high- field tan δ , where the guard film was used to reduce the disturbance of electric field around the edge of the main electrode. Komori has taken benefit of using the CIGRE Method II (CM II) electrode system, which is basically a stainless steel plane electrode to make measurement of partial discharges with the aid of computer [6]. In [7], four electrode systems were used to generate PD signals. The electrodes were an IEC (b) electrode system, a
D
istribution transformers are built with tight insulation tolerances and are consequently subject to various severe aging stresses. Solid insulating materials are utilized to insulate not only primary and secondary windings but also the adjacent turns of the same winding in a dry type distribution transformer. While the aging of the insulation becomes gradually more severe, the leakage current tends to increase and arcing discharge may occur. This can be interpreted as an indication of an incipient fault that will eventually lead to shorts between adjacent turns. Thus investigation of the insulation performance is a key issue to anticipate and detect transformer incipient faults. In this work, effect of aging on the dielectric performance of the solid paper that is used as distribution transformer insulating material, has been investigated experimentally. The solid insulation is NOMEX type paper that is a synthetic aromatic polyamide polymer. In this study, samples were obtained from a damaged
The authors are with Texas A&M University, Department of Electrical Engineering, Power System Automation Lab, College Station, TX 77843-3128 (Email:
[email protected] ,
[email protected] ) This work was supported in part by the Texas Advanced Technology Program under Grant No. 000512-0311-1999.
II. EXPERIMENTAL PROCEDURE
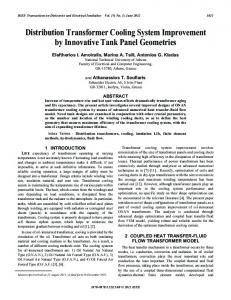
CIGRE Method I electrode system, a semi conductive needle electrode system and a needle-plane electrode system. These are often used as standard electrode systems. The American Society for Testing and Materials standards specifies typical electrodes that are most commonly referenced for flat surface material [8,9]. In this study, a typical electrode system was built according to ASTM D149 standard to create a homogenous electric field in the testing region [9]. It consists of opposing cylinders that are 51 mm in diameter, 25 mm thick and with edges rounded to 6.4 mm radius and made from stainless steel. Circular metallic electrodes either brass or stainless steel are commonly used in measurements performed on solid specimens. B. Test Models The insulation samples or rather test models [10] were taken from the aged distribution transformer that was custom built for performing internal short circuit faults. After conducting a large number of short circuit faults, it finally catastrophically failed due to excessive insulation failure [11]. Thus samples from various locations in the transformer are suitable for this study. The transformer rating was 25 KVA, 7200/240 volts. To obtain test models from the transformer, windings were slit, and from the exposed insulation, test samples were cut out. Three pieces of test samples formed each test subgroup. From a statistical approach, it was decided that a minimum of three specimens of the same type be tested at each experiment. Table 1 describes test cases from which results are obtained. These tests were carried out at two different conditions, dry and wet conditions. This is specified in the third column of the table. It will be shown that there is an appreciable difference when moisture is applied to the samples. C. Laboratory set up To investigate specimen aging, the laboratory test set up shown in Fig. 1 was developed. It consists of a power circuit and data acquisition sections. The voltage source (Vs) employed was a Variac capable of providing a maximum of 140 V at 1.4 KVA. This supply was connected to the barrier board through a very fast acting 5 A fuse. The current monitor (CM) was a standard, wideband current monitor, model 110 made by Pearson Electronic, Inc. It was capable of measuring current with low and high 3dB points of 1Hz and 20 MHz, respectively. Its output was 0.1 volts per amp of current. Both constant value and variable value resistances (R) were employed to control the short circuit fault current in case there was an insulation failure. The total resistance of the circuit was set such that for any case the short circuit
current would not go above the safety limits. Due to the relatively high level of voltage signals from the electrode system and voltage source, the interface box was utilized to lower the signals to levels that could be directly recorded using the data acquisition system. This box had two sets of voltage dividers and one set of shunt resistors. The resistors were of the carbon composition type with a tolerance of within 5% of the specified value. The step down ratio was 72 and 48 for voltage source and electrode voltage signals, respectively. TABLE 1 TEST CASES OF AGED SAMPLES
Test #
Sample #
Condition
1 2 3 4 5 6 7 8 9 10 11 12 13 14
4 8 8 8&9 8&9 10 10 11 13 14 15 16 17 14&15
dry dry wet wet wet dry wet dry dry dry dry dry dry wet
Filter Box
Interface Box
Barrier Board
(a): Physical test setup Fuse
R
Ve
Vs (0-140 v)
Electrode System
CM To DAQ Card (b): Simplified circuit diagram Fig. 1. Laboratory test setup
The Filter Box contained a set of analog filters that were used to condition the signal for sampling. Anti-aliasing filters were used where appropriate to meet the Nyquist sampling rate. The filter box provided five output analog signals derived from the original input signal. In fact, it was composed of five internal filter circuits that operate at different cut-off frequencies. The filter box was furnished with two duplicate parallel paths that allow two different signals to be filtered at the same time. Data acquisition was accomplished by using a 12 Bit, National Instrument DAQ Card with resolution of 16E-4 and maximum sampling rate of 250 Ks/s. The DAQ Card could handle up to 16 analog inputs simultaneously. The output signals from the filter box were connected to the DAQ Card through a BNC adapter chassis (BNC- 2090). III. EXPERIMENTAL RESULTS
I
A large number of tests were conducted. The electrode system utilized and the experiment procedure were described in section II. In the following sections, the test results that address important and interesting issues of insulation aging will be presented and discussed. Through the experiments with aged samples, four distinct behaviors were observed that are necessary to be distinguished for incipient fault detection. They are: sudden short circuit current, arcing current with stochastic behavior, two step continuous arcing current and continuous evolving arcing current. 1) Sudden short circuit current This is the worst case that might happen in which the insulation breaks down suddenly without any prior significant activity. Therefore, there is no possibility to detect it in advance if such phenomenon happens. As illustrated in Fig. 2, a short circuit current flows through the sample 8, 21 seconds after applying the voltage. In fact the insulation breaks down when short circuit current flows. The same phenomena is likely to happen under special circumstances such as severe aging of the insulation due to excessive voltage gradient, multi stress factors contribution and moisture exposure. In this case, in particular, moisture exposure plays a significant role in the occurrence of that phenomenon since this sample (sample 8) was tested under wet conditions. 2) Arcing current with stochastic behavior This phenomenon is illustrated in Fig. 3 in which the current flowing through sample 17 at wet condition is depicted. It forms continuous leakage current that is occasionally accompanied with arcing current and is random in magnitude. This might persist for some time but eventually it will lead to a short circuit current. Essentially, this behavior is an advance stage of an incipient fault.
Extracting the statistical information of the signal and analyzing it over a long time may help detect the ongoing arcing current activity before fault and suggest necessary action in order to prevent a catastrophic failure. 3) Two step continuous arcing current Fig. 4 shows the two step continuous arcing current flows through the sample 17 in another test. In this case, a continuous arcing current flows after the voltage is applied. It precisely follows the pattern that has been observed in the past research work and was modeled with resistance–voltage source parallel combination [12]. Arcing is occurring continuously in the positive and negative half cycles but the duration and delay times in the phases (burning period and extinction period is not constant. In fact, the insulation chemical properties influence the pattern of variation of the arc, which might be different for other samples. Since the material at the arc area changes during the burning period, the next burning period will show different behavior when it resumes. In fact, during the extinction period the insulation chemical properties changes which in turn causes distinctive activity in the next period of arcing. This is clearly indicated in Fig. 4. It should be noted that the current waveform has been multiplied by 50 to be comparable with the voltage signal on the same plot.
Fig. 2. Sudden short circuit current for sample 8
Fig. 3. Stochastic arcing current for sample 17
4) Continuous evolving arcing current Fig. 5 represents another phenomena, which is called continuous evolving arcing current. Unlike the previous case
in which the magnitude of the arcing current is almost constant, the arcing current increases in magnitude in this case. It may happen several times until short circuit current initiates. As shown in the figure, there is arcing activity in the current waveform after the voltage is applied but it evolves later so that the magnitude of the arcing current gets bigger. If this phenomenon persists it will eventually lead to the insulation breakdown and a short circuit fault will occur. Factors like physical and chemical properties of the insulation, voltage variation, environment temperature, humidity and mechanical stress can contribute to this phenomenon.
Fig. 4. Two step continuous arcing current and corresponding voltage waveforms for sample 17
experimental measurements”, Proceeding of the IEEE Transmission & Distribution Conference, New Orleans, LA, April 1999, pp. 882-887. [2] Y. Wang, X. Han, R. J. Van Brunt, T. Las, H. Slowikowska, J. C. Horwath, D. L. Schweickart, “Digital recording and analysis of partial discharges in point dielectric gaps”, IEEE International Symposium on Electrical Insulation, USA, June 1998, pp. 440-443. [3] D. P. Zhao, E. Kuffel, “ Experimental investigation of aging effect on the dielectric performance of the FRP sticks”, IEEE International Symposium on Electrical Insulation, Canada, June 1996, pp. 304-307. [4] T.R.Blackburn, Z. Liu, R. Morrow and B.T.Phung, “Partial discharge development in a void and its effect on the material surface”, Proceeding of the 6th International Conference on Properties and Application of Dielectric Materials, China, June 2000.pp. 280-285. [5] M. Fujii, K. Tohyama, T. Tokoro, Y. Mizuno, M. Nagao, M. Kosaki, “ Development of new electrode system for measurement of high field dielectric properties near breakdown field”, Proceeding of 1998 International Symposium on Electrical Insulating Materials, Japan, 1998, pp. 313-316. [6] F. Komori, A. Kojima, M. Hikita, Y. Suzuoki, T. Mizutani, “ Phase resolved study on partial discharge for degradation diagnosis in polymeric insulating material using model electrode system”, IEEE International Conference on Conduction and Breakdown in Solid Dielectric, Sweden, June 1998, pp. 153-156. [7] T. Okamoto, N. Hozumi, T. Imajo, “Partial discharge pattern recognition for four kinds of electrode systems”, IEEE International Symposium on Electrical Insulation, USA, June 1992, pp. 375-378. [8] ASTM standard D150-98, “Standard test methods for AC loss characteristics and permittivity of solid electrical insulation”, March 1999. [9] ASTM standard D149-97a, “Standard test method for dielectric breakdown voltage and dielectric strength of solid electrical insulating materials at commercial power frequencies”, January 1998. [10] ANSI/IEEE standard C57.12.56, “IEEE standard test procedure for thermal evaluation of insulation system for ventilated dry-type power and distribution transformers”, January 1994. [11] K. L. Butler, A. Kuforiji, "Experimental results from short circuit faults on distribution transformers," Proceedings of 2001 IEEE Transmission and Distribution Conference, Atlanta, GA, Oct. 2001, pp. 299-306. [12] H. Wang, K. L. Butler, “Finite element analysis of internal winding faults in distribution transformers”, IEEE transactions on power delivery, Vol. 16, No. 3, July 2001.
VI. BIOGRAPHIES Fig. 5. Continuous evolving arcing current and corresponding voltage for sample 17
IV. CONCLUSIONS An experimental setup developed to study solid insulation behavior of the distribution transformer was introduced. Test results address distinct phenomena that might happen as an indication of the incipient fault initiation stage. Characterization of such faults can only be done by identifying these relevant behaviors and then utilizing it in a decision making process. This process can be used to obtain an indication of severe aging or probable incipient fault initiation in the solid insulation of the transformer. V. REFEFENCES [1]
P. Palmer-Buckle, K. L. Butler, N. D. R. Sarma, “Characteristics of transformer parameters during internal winding faults based on
Mirrasoul Jaafari Mousavi was born in Shabestar, Tabriz, Iran in 1974. He received the B.Sc. degree from the Isfahan University of Technology, Isfahan, Iran in 1996 and the M.Sc. degree from Sharif University of Technology, Tehran, Iran in 1999. He worked for Niroo Research Institute (NRI) from 1999 to 2001 in Transmission and Distribution Research Center. He taught electrical machine laboratory in the Sharif University for five semesters. His research interests are related to fault detection, anticipation and diagnosis, transient studies, protection and distribution automation. He is a student member of IEEE and currently pursuing his PhD degree in the Electrical Department of Texas A&M University since 2001. Karen Butler-Purry is an associate professor in the department of electrical engineering at Texas A&M University. She received the B.S. degree from Southern University—Baton Rouge in 1985, the M.S. degree from the University of Texas at Austin in 1987, and the Ph.D. degree from Howard University in 1994, all in electrical engineering. In 1988-1989, Dr. Butler was a Member of Technical Staff at Hughes Aircraft Co. in Culver City, California. She received an NSF Early Career Award in 1996 and an Office of Naval Research Young Investigator Award in 1999. Her research focuses on the areas of computer and intelligent systems applications in power, power distribution automation, and modeling and simulation of power systems and vehicles. Dr. Butler is a senior member of IEEE and IEEE Power Engineering Society (PES), and the Louisiana Engineering Society. She is a registered professional engineer in the states of Louisiana, Texas and Mississippi.