Int. J. Experimental Design and Process Optimisation, Vol. 4, No. 1, 2014
71
Experimental process design for sorption capacity of Kogi and Ibusa clay activated with HNO3 and H2SO4 acids in palm oil bleaching Chigozie Francolins Uzoh*, Okey D. Onukwuli, Joseph Tagbo Nwabanne and Philo P.K. Igbokwe Chemical Engineering Department, NnamdiAzikiwe University, P.M.B. 5025 Awka, Anambra State, Nigeria E-mail:
[email protected] E-mail:
[email protected] E-mail:
[email protected] E-mail:
[email protected] Abstract: The palm oil bleaching process was optimised through characteristic study of the sorption capacity of Ibusa and Kogi clay activated with nitric and sulphuric acids. The raw clays were characterised for structure elucidation via FTIR and X-ray fluorescence spectroscopic techniques and the result indicates that Kogi clay is predominantly kaolinite while Ibusa sample is montmorillonite. The response surface methodology based on 42-full factorial design was applied for the process analysis. Effects of process variables such as acid concentration, bleaching temperature, contact time, clay-oil ratio and particle size distribution was analysed employing the characterisation-control-optimisation paradigm necessary for detailed process design for optimum bleaching efficiency. A sequence of experiments was carried out at different settings of the process variables and their interactive sorption effects were calculated in terms of adsorption efficiency. Acid concentration and bleaching time were found to be the most significant process parameter. Predictive equations describing the optimum bleaching efficiency in terms of the process variables were derived from regression analysis of the experimental data. A maximum mean adsorption strength of 40 units was predicted for both specimens through activation wit HNO3 acid at mean acid concentration of 6.12 mol/l and mean bleaching time of 48.88 mins, while H2SO4 acid recorded relatively low adsorption strength of 24 units with Kogi clay and negligible strength of 8 units with Ibusa sample at the same experimental condition. Overall, HNO3 acid activated Kogi clay shows robustness to expanded variable effects and could be recommended for general application in lieu of bentonite. Keywords: sorption; experimental design; characterisation; bleaching; response surface methodology; RSM; optimisation. Reference to this paper should be made as follows: Uzoh, C.F., Onukwuli, O.D., Nwabanne, J.T. and Igbokwe, P.P.K. (2014) ‘Experimental process design for sorption capacity of Kogi and Ibusa clay activated with HNO3 and H2SO4 acids in palm oil bleaching’, Int. J. Experimental Design and Process Optimisation, Vol. 4, No. 1, pp.71–89.
Copyright © 2014 Inderscience Enterprises Ltd.
72
C.F. Uzoh et al. Biographical notes: Chigozie Francolins Uzoh is a Lecturer in Chemical Engineering Department, NnamdiAzikiwe University, Awka. He is the Principal Partner, Research Gallery and Engineering Consults, Awka, Anambra state. He is on the register of Council for the Regulation of Engineering in Nigeria (COREN). He is a corporate member of the Nigerian Society of Chemical Engineers (NSChE), the Nigerian Society of Engineers (NSE) and International Association of Engineers (IAENG). His research and teaching interests are alkyd resins, experimental process design, response surface methods and process dynamics, control and optimisation. Okey D. Onukwuli is a Professor of Chemical Engineering at NnamdiAzikiwe University, Awka. He is a Fellow of the Nigerian Society of Chemical Engineers (NSChE) and the Nigerian Society of Engineers (NSE). He is on the register of Council for the Regulation of Engineering in Nigeria (COREN). He was the immediate former Dean, Faculty of Engineering, NnamdiAzikiwe University, Awka. Joseph Tagbo Nwabanne is a Senior Lecturer in Chemical Engineering Department, NnamdiAzikiwe University Awka. Currently, he is the Head of Department (HOD) of the same department. He is on the register of Council for the Regulation of Engineering in Nigeria (COREN). He is a corporate member of the Nigerian Society of Chemical Engineers (NSChE) and the Nigerian Society of Engineers (NSE). Philo P.K. Igbokwe is a Professor of Chemical Engineering at NnamdiAzikiwe University Awka. She is the current Dean, Faculty of Engineering in the same University. She is a Fellow of the Nigerian Society of Chemical Engineers (NSChE). She is registered with the Council for the Regulation of Engineers in Nigeria (COREN).
1
Introduction
Palm oil is the most important vegetable oil in terms of production, and finds use mainly in the food industry. Also, natural clay is acquiring prominence as adsorbent over the last decades due to their local availability, capability to undergo modification to enhance their surface area, adsorption capacity and range of applicability (Monvisade and Siriphannon, 2009). The use of bentonite as adsorbent is adversely affecting the economy due to heavy importation especially in the third world nations. The recent ban on bentonite importation in Nigeria and the excess demand for adsorbents especially in edible oil processing industries are generating a lot of research concerns for the alternative. Moreover, existing methods of palm oil bleaching seem to be very costly. The application of locally sourced natural clay as adsorbent and design of process experimentally for palm oil bleaching is commercially an important factor for Nigeria’s sustainable development; the positive economic effects and increase in the overall process efficiency would be achieved. The application of palm oil or vegetable oils at large for kitchen and industrial processes are generally stalled by the presence of colour pigments such as carotene, chlorophyll, gossypol and other impurities like phosphotides, oxidation metals, trace metals and traces of soaps in the crude sample (Bockisch, 1997). Vegetable oils extracted from palm nut or kernel, soybeans, castor, coconut, cotton seed, etcetera are reported to be the principal raw materials for the commercial production of biodiesel fuel, glycerol and alkyd resin
Experimental process design for sorption capacity of Kogi and Ibusa clay
73
for binders used in surface coating, soaps, detergents and margarines (Uzoh et al., 2013; Silva et al., 2010; Hlaing and Oo, 2008). Achieving good grade oil with appropriate physiochemical properties such as specific gravity, refractive index, photometric colour, viscosity, moisture content, free fatty acid (FFA) and iodine value for these processes usually involve implementation of the established refining protocol on the crude sample. Bleaching is an important stage in the oil refining process which must be monitored properly to ensure that good grade oil with desired properties is achieved at the end of the process. Standard bleaching of oil may be accomplished via particulate adsorption which occurs when dissolved molecules diffusing in the fluid phase are held to an adsorbent for a period of time by Vander Waal forces emanating from the adjacent surfaces. Adsorptive bleaching is usually imposed on the crude palm oil (CPO) (with distinctive deep orange-red colour due to high carotene content) using acid or thermally activated adsorbents (such as carbon, charcoal, clay etcetera). Adsorbents are basically solid substances manufactured into highly porous forms to create large internal surfaces to allow for effective percolation of diffusing molecules in the fluid phase. Through this process dissociated colour pigments and other impurities are essentially removed from the oil sample without affecting the vital chemical make-up leaving the specimen refined and fit for storage. The two popular oil refining methods that are widely applied in palm oil bleaching are the physical and chemical (alkaline) process. Physical process is essentially a distillation process accomplished in three basic unit operations; degumming, bleaching and deodorisation, which incorporates alkaline neutralisation unit between the degumming process and bleaching process (Egbuna et al., 2009). Current reports show that although the later obviously guarantees fuel savings on steam distillation and other advantages associated with the moderate temperature required, to preserve the antioxidants, sterol and tocopherol present in the oil, yet the former seems to hold wider popularity in recent time especially in commercial processing. This is because physical refining offers more attractive advantages of improved deodoriser efficiency, reduced number of operation units, low water consumption, reduced oil loss, savings on chemical, high stability etcetera and is thus chosen for this study. Kogi kaolinite and Ibusa montmorillonite have been assessed to be commercially available in Northern and Niger delta region of Nigeria respectively. There is no published data dealing with these clay samples as adsorbents in edible oil industry. Moreover, previous studies on palm oil bleaching seem to rely mostly on one factor at a time (OFAT) approach. Such method has been proven by research to be deficient, unsatisfactory and time consuming. Response surface methodology (RSM) has been widely adopted in industries such as drug and food, chemical and biological processes, for the purpose of either producing high quality products or operating the process in a more economical manner and ensuring the process operates in a more stable and reliable way (Otto, 1999). It has also been successfully applied to different processes for achieving its optimisation using experimental designs (Sudamalla et al., 2012; Gunawan and Suhendra, 2008; Alam et al., 2007; Abali et al., 1997; Narayana et al., 2011; Umesh and Sud, 2005; Li et al., 2010). The study therefore, is intended to; explore the most significant factors and their possible interactions which influence the overall efficiency of the palm oil bleaching process; characterise their effects and predict the possible route(s) to the desired optimal; evaluate and compare the bleaching efficiency of the clay specimens activated with different mineral acids. An optimisation problem which can be conveniently solved
74
C.F. Uzoh et al.
through the well-known RSM is thus formulated. Such method often requires fitting a predictive model to the data obtained from few experiments through regression analysis. It enables easy approximation to a desired surface by analysing the associated response surface diagrams (or contours) derived from such models; hence obviating the need for experimenting in an ad hoc manner in search of the desired response(s). Overall, this new palm oil bleaching design will guarantee increased overall process efficiency through; 1
lower investment costs (more efficient and easy to execute)
2
lower operating costs (use of local source clays whose sorption capacities have been enhanced by the degree of activation).
1.1 Theoretical background Thermal activation involves dumping an already pulverised sample of the adsorbent such as clay in a high temperature enclosure (oven), maintaining its temperature within the range 400–600°C for about three hours before cooling to room temperature. Dehydration of clay sample at such elevated temperature causes a drastic alteration in the clay structure, its plastic properties are lost and the clay is said to be dead. Activation of bleaching earth can equally be achieved through chemical treatment with mineral acid to enhance its ion exchange capability through formation of Bronsted acid sites as well as creation of charge deficiency on the clay structure caused by the leaching of the metallic ions. In the process highly electropositive ions such as K+, Na+ or Ca2+ is replaced with H+ from the acid and some Al3+, Fe3+ or Mg2+ are removed from the lattice thus rendering the clay physically porous and electrochemically active. This is illustrated by the following ionic displacement process. 2M + + H + + SO 4 2 − → M 2SO 4 + H +
(1)
+
where M is a highly electropositive ions. In view of the advantage related to energy savings, the chemical activation with nitric and sulphuric acid which requires moderate temperature was considered in this study. The adsorption of gases to solids follows a model suggested by Irving Langmuir, modified by BET which is a semi-empiricalisotherm derived from proposed kinetic mechanism while adsorption from liquid phase is accounted for by the empirical Freundlich isotherm (Vicente et al., 1996) which relates the specific adsorption (q = x/m) or the amount of substance adsorbed per unit of adsorbent weight, to residual solute concentration C at the equilibrium for a given temperature i.e., q = KC n
(2)
expressed in logarithmic form as log q = log K + n log C
(3)
where x is the quantity of substance adsorbed, m is the quantity of absorbent, K and n are empirical constants which depends on the nature of the adsorbent, oil and the prevailing bleaching condition. A plot of logq against logC gives a straight line whose slope and intercept correspond to the value of the unknown n and logK respectively.
Experimental process design for sorption capacity of Kogi and Ibusa clay
2
75
Materials and method
2.1 Materials A fresh mechanically expressed CPO was obtained from a commercial oil mill located at Nise in Anambra state, Nigeria. The clay samples were excavated from Ibusa (Delta state) and Anyingba (Kogi state) in the southern and northern regions of Nigeria respectively. Other materials, reagents and apparatus needed for clay activation, oil degumming and the actual bleaching processes were provided in the chemical engineering laboratory of Nnamdi Azikiwe University, Awka in the South-Eastern Nigeria. All the chemicals were of analytical grade and were used without further purification.
2.2 Clay characterisation The clay samples were characterised for structural establishment using Shimadzu FTIR-8400S Fourier transform infrared spectrophotometer and X-ray fluorescence spectrometer.
2.3 Clay preparation and activation Chemical activation of the clay mass was carried out using a method similar to the one described by Vicente et al. (1996). 100 g of the clay specimen was introduced into a beaker containing 500 ml of boiling sulphuric acid and the mixture homogenised (i.e., stirred) from time to time using a glass rod stirrer for one hour. Thereafter, the resulting slurry is poured in a Buchner funnel and thoroughly washed several times with distilled water to reduce the acidity to a pH value of between five and seven, and this was achieved by testing with a pH meter. The activation process was repeated using varied concentration of the acid. The different activated clay samples were dried at oven temperature of 105°C after which they were ground to fineness and were sieved into different particle sizes using a standard Taylor sieve. The same procedure was repeated for nitric acid solution.
2.4 Oil degumming process The main objective of degumming is to remove the unwanted gums, which will interfere with the stability of the oil products in the later stage of the refining process. In this unit operation, the incoming CPO was first heated up to a temperature of between 90–110°C before treatment with a food grade phosphoric acid of about 0.1% of oil weight with acid concentration approximately 85%. The intention was to decompose the non-hydratable phosphatides present in the CPO as well as to coagulate the phosphatides making them insoluble and thus easily removed during bleaching. Excessive amount of phosphoric acid is not necessary as it may cause rise in phosphoric acid value which may contribute to further refining problems.
C.F. Uzoh et al.
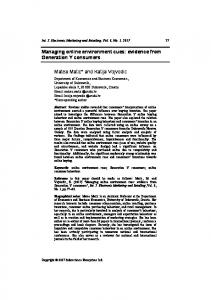
76 Figure 1
Simplified flowsheet of oil bleaching
2.5 Bleaching process The bleaching of palm oil in the refinery follows a method suggested by Morad et al. (2006) in which degummed oil treated with acid activated bleaching earth (adsorbent) is first heated up to a temperature of about 100°C and is subsequently channelled into the vacuum bleacher as shown in Figure 1. In the process colour pigments (carotene), phosphatides, trace metal complexes such as iron and copper or oxidation products are removed by the interactive sorption effects of the bleaching earth. Any residual phosphoric acid is equally removed during this stage. The clay-to-oil ratio given as the adsorbent dosage was maintained within the range of 1.0–2.0% of the oil weight. The bleaching process was monitored for varying contact time within 20–60 minutes ensuring continuous agitation. The bleached oil was then filtered and stored. The adsorption spectra of the CPO and the bleached samples obtained at each experimental run were observed with spectrophotometer set at an adsorption band (wavelength) of 445 nm. The absorbance recorded at every level is used to compute the corresponding percentage adsorption efficiency of the adsorbent at the various experimental conditions applying the relation,
Yi = 100 ( Ao − Ai ) / Ao i = 1, 2… 30
(4)
where Ao is the absorbance of the CPO. Ai is the resulting absorbance of the bleached oil measured at the end of each experimental run and Yi is the percentage absorption efficiency evaluated at various levels.
2.6 Experimental design Critical observation of palm oil refining system and prior review of classical oil bleaching records reveal that adsorption efficiency of activated clay in a bleaching process is affected by some system parameters like; bleaching temperature, clay-oil ratio
Experimental process design for sorption capacity of Kogi and Ibusa clay
77
and contact time. Also, particle size distribution (PSD) and acid concentration which determine the number of adsorption sites, the surface area of the adsorbent and the degree of activation of the bleaching earth respectively may as well influence the process response (Ajemba and Onukwuli, 2012). The main linear and possible quadratic effects of these parameters coupled with their various interaction effects on the response were investigated systematically and the conditions for achieving optimal bleaching on the oil sample were equally established following the characterisation-control-optimisation algorithm advocated by Montgomery (1999, 2001). The characterisation, control and optimisation of the clay sample in terms in of its adsorption capacity influenced by the above mentioned factors were accomplished with the basic principle of response surface modelling (RSM). An experimental design was conducted applying a four level at four centrepoints considering only two controllable variables (x1, x2) at any step for convenience. This conforms to the standard 42-full factorial design. Table 2 presents a standard 42-full factorial design template in coded variables leading to 16 distinct experimental runs for each investigation.
2.7 Process analysis/optimisation The process analysis and optimisation of sorption capacity of the activated clay specimen were carried out within a predetermined space of controllable factors which include; acid concentration, bleaching temperature, contact time, PSD and clay-oil ratio known to have considerable effect on the system response. The whole factor screening exercise was achieved through design-of-experiment was aided with an approximating linear model of the form y = β 0 + β1 x1 + β 2 x2 + β12 x1 x2
(5)
with the significance of any factor estimated from the main effects denoted by βi. Also, the optimisation tasks were accomplished using the well-known RSM. Subsequently, a generalised multivariate reduced order quadratic model (ROQM) of the form y = β 0 + β1 x1 + β 2 x2 + β12 x1 x2 + δ11 x12 + δ 22 x2 2 + ε
(6)
where βi represent the main effects of the control variables βij designates the interaction effects δii determine emergent of curvature and ε designate random error is fitted accordingly for studying the optimised response of the system. Further analyses of the responses were based on explicit deductions from response surface plots executed in the design spaces. The determination of unknown coefficients of equation (6) for a specific experiment applies the design matrix obtained by judicious transformation of the natural units of the resulting four-level (from two steps investigation in low and high level) upon which the experiment would be executed to a corresponding coded variable using –1s and –2s to designate the low and lowest setting of the variables, while 1s and 2s correspond to the equivalent steps in the high and highest value as shown in Table 2. The coded values of the independent variable for the design of the experiment for palm oil bleaching are given in Table 1. Such manipulation is elegant since it allows the design matrix to be generalised for all the investigations conducted with similar factorial design. The method of multiple regression analysis for multivariate problem gives the generalised matrix of equation (7) from which the coefficients are readily evaluated.
C.F. Uzoh et al.
78 ⎡1 ⎢1 ⎢ ⎢1 ⎢ ⎢1 ⎢1 ⎢ ⎢1 ⎢1 ⎢ ⎢1 ⎢ ⎢1 ⎢1 ⎢ ⎢1 ⎢1 ⎢ ⎢1 ⎢1 ⎢ ⎢1 ⎢ ⎣1 Table 1
−2 −2 4 −2 −1 2 −2 1 −2 2
−2 −4
−1 −2 2 −1 −1 1 −1 1
−1
−1 2 −2 −2 −2 1 −1 −1 1 1
1
1 2
2 2 −2 −4 −1 −2
2
1
2
2
2
4
2
1
4 4⎤ ⎡ y (−2, − 2) ⎤ ⎢ y (−2, − 1) ⎥ ⎥ 4 1⎥ ⎢ ⎥ ⎢ y (−2, 1) ⎥ 4 1⎥ ⎢ ⎥ ⎥ 4 4⎥ ⎢ y (−2, 2) ⎥ ⎢ y (−1, − 2) ⎥ 1 4⎥ ⎢ ⎥ ⎥ 1 1 ⎥ ⎧ β 0 ⎫ ⎢ y (−1, − 1) ⎥ 1 1 ⎥ ⎪⎪ β1 ⎪⎪ ⎢ y (−1, 1) ⎥ ⎢ ⎥ ⎥ 1 4 ⎥ ⎪⎪ β 2 ⎪⎪ ⎢ y (−1, 2) ⎥ ⎥⎨ ⎬ = ⎢ ⎥ 1 4 ⎥ ⎪ β12 ⎪ ⎢ y (1, − 2) ⎥ 1 1 ⎥ ⎪δ11 ⎪ ⎢ y (1, − 1) ⎥ ⎥⎪ ⎪ ⎢ ⎥ 1 1 ⎥ ⎪⎩δ 22 ⎪⎭ ⎢ y (1, 1) ⎥ ⎢ y (1, 2) ⎥ 1 4⎥ ⎥ ⎢ ⎥ 4 4⎥ ⎢ y (2, − 2) ⎥ ⎢ y (2, − 1) ⎥ 4 1⎥ ⎥ ⎢ ⎥ ⎢ y (2, 1) ⎥ 4 1⎥ ⎢ ⎥ ⎥ 4 4⎦ ⎣ y (2, 2) ⎦
(7)
Formation of coded variables for experimental analysis
Independent variable Bleaching temperature (°C)
Range and level –2
–1
1
2
30
60
90
120
Contact time (min)
20
35
45
60
Particle size (µm)
75
150
250
375
Adsorbent dosage (wt.%)
1.0
1.3
1.6
2.0
Acid concentration (mol/l)
3.0
4.0
6.0
7.0
The estimated coefficients for all the investigations derived from the application of equation (7) are presented in Table 2. The responses in the right side are substituted accordingly from the table of result recorded at the end of each investigation. Substitution of the corresponding coefficients from the table in the generalised multivariate model of equation (6) gives the associated model from which the optimum yield of each investigation may be studied. A standard approach to the determination of optimal response in multiple dimensional variable space involves overlaying several contours of constant mean response in the parameter space from which all the possible combinations of the control variables leading to any desired optimal may be captured. The contour plot is executed with the aid of a MATLAB program for the observed 16 investigations. The results are presented and analysed to justify the effort of the RSM.
Experimental process design for sorption capacity of Kogi and Ibusa clay
Generalised design matrix
Variables
3
Standard 42-full factorial design template X1
X2
X1X2
X12
X22
–2
–2
4
4
4
–2
–1
2
4
1
–2
1
–2
4
1
–2
2
–4
4
4
–1
–2
2
1
4
–1
–1
1
1
1
–1
1
–1
1
1
–1
2
–2
1
4
1
–2
–2
1
4
1
–1
–1
1
1
1
1
1
1
1
1
2
2
1
4
2
–2
–4
4
4
2
–1
–2
4
1
2
1
2
4
1
2
2
4
4
4
Y
Response
Table 2
79
Results and discussion
The spectral analyses of the clay sample were presented in Figures 2 and 3. The IR spectra of Ibusa located near 1,076.32 cm–1 belongs to the Si-O stretching vibrations. The next intensive band at 556.48 cm–1and 454.25 cm–1 are due to the bending vibration of Al-O-Si and Si-O-Si bonds, respectively. The peak at 3,417.01 is typical of OH stretching vibration of water molecules while the OH stretching modes of structural hydroxyl group lie in the spectral region between 3,000–3,800 cm–1. The IR spectra of Kogi clay show similar characteristics (Figure 3). The result of chemical analysis using X-ray fluorescence showed that the Kogi clay contain 19.1% by weight of Al2O3 and 51.0% by weight SiO2 while Ibusa clay contain 20.6% by weight of Al2O3 and 46.4% by weight of SiO2 as shown in Table 2 and 3. According to Bar (1963), it could be concluded that Kogi clay is mainly kaolinite while Ibusa sample is montmorillonite. The study of the effects of the various combinations of factors which include effects of; acid concentration, clay oil ratio, bleaching temperature and particle size within the actual observed time present some important results described in the contour diagrams shown in Figures 4–11.
80 Figure 2
C.F. Uzoh et al. (a) FTIR analysis of Ibusa clay (b) Chemical analysis of Ibusa clay using X-ray fluorescence
(a)
(b)
Experimental process design for sorption capacity of Kogi and Ibusa clay Figure 3
(a) FTIR analysis of Kogi clay (b) Chemical analysis of Kogi clay using X-ray fluorescence
(a)
(b)
81
C.F. Uzoh et al.
82 Table 3
Estimated coefficients of the fitted linear and quadratic model
Linear model Quad. model 2 3 4 5 6 7 8 9 10 11 12 13 14 15 16
β0
β1
β2
β12
δ11
δ22
Errormax
18.9109 19.9917 25.1575 26.2283 11.1423 10.1656 23.6799 23.9109 35.7442 34.1871 37.2386 32.6181 28.6525 29.3236 30.8809 33.0841 4.1803 3.0461 25.6118 28.1961 16.9764 17.1023 18.7122 17.9734 25.1009 27.0436 24.4549 21.6092 27.4536 26.7864 32.6794 32.4095
1.5349 1.5349 1.3080 1.3080 2.7696 2.7696 2.2517 2.2517 0.0953 0.0953 0.4852 0.4852 –0.2166 –0.2329 –1.6310 –2.1422 0.7131 –0.7131 1.9606 1.9606 3.5534 3.5534 3.6616 3.6616 1.1152 1.1152 0.3025 0.3025 –0.3834 0.0127 0.0711 0.0945
2.6763 2.6763 7.4420 7.4420 3.7878 3.7878 7.0892 7.0892 3.6382 3.6382 3.5888 3.5888 –0.6373 –0.6373 0.0603 0.0603 0.7850 0.7850 7.1247 7.1247 3.0028 3.0028 2.9244 2.9244 4.5968 4.5968 3.6947 3.6947 –0.1792 –0.1792 0.2706 0.2706
–0.0702 –0.0702 0.0494 0.0494 0.4274 0.4274 –0.1734 –0.1734 –0.3980 –0.3980 0.0247 0.0247 –0.3409 –0.3409 –0.4234 –0.4234 0.1845 0.1845 0.3640 0.3640 –0.0253 –0.0253 –0.0148 –0.0148 –0.0081 –0.0081 0.0312 0.0312 –0.1177 –0.1177 0.0835 0.0835
–0.3296 –0.0882 –0.0567 –0.1617 0.3934 0.1660 –0.0190 –0.5965 0.4096 –0.5179 –0.0903 0.3652 –0.1470 –0.0608 0.4622 0.0272
–0.1027 –0.3402 0.4473 0.0693 0.2295 1.6822 –0.2576 –0.5404 –0.0441 –0.4925 0.0400 –0.0673 –0.6301 1.1991 0.0028 0.0924
2.8371 2.4968 3.6031 2.9607 4.6646 3.9086 5.6294 5.7680 7.6429 7.3970 4.6873 2.0490 2.0784 1.700 7.4840 6.9289 1.8434 0.9574 4.6031 3.3644 1.7516 1.7586 3.3655 2.7167 1.7524 1.0382 2.4599 1.0701 8.5686 7.2169 3.6087 3.4934
These results of the response surface analyses accomplished by fitting appropriate ROQM in the experimental designs and overlaying two-dimensional contour lines of constant mean over the design parameter space X1–X2 are presented in the sections of Figures 4–11. The various combinations of these control (design) variables that would lead to a certain desirable optimal can now be easily compared for the analysed: a
H2SO4
b
HNO3 acid activated clay samples.
Experimental process design for sorption capacity of Kogi and Ibusa clay Figure 4
(a) H2SO4 (b) HNO3 concentration surface contour for acid activated Kogi clay (see online version for colours)
(a) Figure 5
(b)
Effect of clay oil ratio on (a) H2SO4 (b) HNO3 activated Kogi clay (see online version for colours)
(a) Figure 6
83
(b)
Effect of bleaching temperature and time on (a) H2SO4 (b) HNO3 activated Kogi clay (see online version for colours)
(a)
(b)
84 Figure 7
C.F. Uzoh et al. Effect of particle size and bleaching time on (a) H2SO4 (b) HNO3 activated Kogi clay (see online version for colours)
(a) Figure 8
(a) H2SO4 (b) HNO3 concentration surface contour for acid activated Ibusa clay (see online version for colours)
(a) Figure 9
(b)
(b)
Effect of clay oil ratio on (a) H2SO4 (b) HNO3 activated Ibusa clay (see online version for colours)
(a)
(b)
Experimental process design for sorption capacity of Kogi and Ibusa clay
85
Figure 10 Effect of bleaching temperature and time on (a) H2SO4 (b) HNO3 activated Ibusa clay (see online version for colours)
(a)
(b)
Figure 11 Effect of particle size and bleaching time on (a) H2SO4 (b) HNO3 activated Ibusa clay (see online version for colours)
(a)
(b)
The detailed process analysis conducted is utilised as a standard approach to expose the possible routes to certain desirable targets from which the one that provides certain obvious advantage(s) (either in terms availability, cost effectiveness or reduced observation time) may be selected via a logical compromise between the interaction variables. Such justification is evident in what is described as effect of acid concentration seen in the early generated contour of Figures 4(a) and 4(b) and Figures 8(a) and 8(b) where maximum mean adsorption strength of 40 units is attainable with both specimen through activation with HNO3 acid recorded at the upper boundaries of the design space (mean acid concentration of 6.12 mol/l and mean bleaching time of 48.88 mins). Conversely, activation with H2SO4 acid recorded relatively low adsorption strength (24 units) with Kogi clay and almost negligible strength (8 units) with the Ibusa sample. The results of these early investigations may not be sufficient to predict the actual sample with required adsorption capacity in the presence of multiple optimisation objectives which the system presents, yet it can be inferred overtly that maximum effect of acid concentration is associated with HNO3 acid activated sample. From Figure 4s (a) and 4(b) and Figures 8 (a) and 8(b), it was observed that adsorption efficiency is improved when
86
C.F. Uzoh et al.
the acid concentration of the activating mineral acids (H2SO4 and HNO3) and bleaching time were adjusted simultaneously to some values somewhat > the actual central values. The response however, decreases as bleaching time increases beyond 48.88 mins in the upper boundary while acid concentration tends toward 7.0 mol/l. This observation has been explained by Berbesl (2006) where it was stated clearly that chlorophyll, bleached colour and anisidine value removal improves as the acidity of the clay increases. In absence of acid concentration as a factor, Ajemba et al. (2013) recorded an optimum efficiency of 82.25% at bleaching time of 3hrs with H2SO4 activated Ukpor clay. Given the long operational time, the reported optimal may not be economically advantageous. Further study conducted shows that clay oil ratio at distributed temperatures has no substantial effect on the response of the acid activated Kogi sample. This observation is not however consistent with Ibusa clay which recorded improved and depreciated adsorption strengths with H2SO4 and HNO3 acid activated samples respectively. This observation is evident in the identical contours seen in Figures 9(a) and 9(b). Of particular interest may be the appreciable increases in the observable low response of H2SO4 acid activated samples while the bleaching temperature is raise progressively beyond room temperature. An opposing trend is seen with HNO3 acid activated Ibusa clay. Kogi clay is however more resistant to this undesirable trend posed by upwards adjustment of temperature. Temperature is known to affect oil viscosity and adsorption kinetics. Oil viscosity decreases with increasing temperature resulting in better dispersion of particles, improved clay oil interactions and flowability. However, the ability to maintain particles in slurry is inversely related to the viscosity of the oil. In the same vein, much higher temperature increases the speed of oxidation reaction leading to less colour removal. A possible transition to optimum sorption capacity is through a contact time of 48.88 mins and bleaching temperature of 116.42°C while other parameters remain in their zero level. In view of energy savings therefore, operating at moderate temperature could be found to be more economical. The particle size analysis shows a slightly complicated behaviour with regions of optimal adsorption strength appearing in certain localised space in the Kogi sample. However, HNO3 acid activated sample predicts maximum adsorption capacity of 32 units at the lower level particle size and upper level in the mean time. Comparable value of adsorption strength is however realisable with H2SO4 acid activated sample at the high levels of the particle size. The Ibusa clay shows more expanded space of particle size upon which peak responses are attainable. Maximum sorption capacity of 32 units at lower level of particle size suggests an inverse relationship between bleaching efficiency and PSD. This is due to practical increase in the number of adsorption sites achieved with small PSDs. The observed complicated behaviour of the system returning optimal adsorption strength in the upper level of the process variable could be as a result of increased acid concentration; where the relatively few number of adsorption units associated with large particle size were essentially compensated by increased artificial porosity due to improved chemical activation to enhance percolation of diffusing molecules in fluid phase. Evidently, the choice of a clay sample with desired optimal performance characteristics and an effective route is relaxed completely on achieving a proper balance of trade-off in favour of the desired target response (Janardhanan, 2012; Berbesl, 2006).
Experimental process design for sorption capacity of Kogi and Ibusa clay
4
87
Conclusions
The study of the multivariate problem with suspected multiple desirable optimal yield in terms of adsorption strength of the specimen Kogi and Ibusa clay in varied conditions of the influential factors is accomplished with the expediency of the well-known RSM. The detailed survey of the practical problem presented in this work leads to the following obvious or implicit deductions; •
the transition to the optimal or near optimal domain depends to a very large extent on the type of catalyst used
•
increasing bleaching temperature invariably leads to increased adsorption strength in H2SO4 activated sample while the reverse is the case with the comparable sample. However, HNO3 activated Kogi sample show a significant stability to temperature adjustment
•
the peak yield of Kogi clay is not affected by oil ratio while the Ibusa sample expose the acid activated samples to a comparable moderate mean responses
•
the peak adsorption strength is localised in the low and high particle size for HNO3 and H2SO4 activated Kogi samples respectively while it is more expanded in the comparable sample.
Hence, the HNO3 acid activated Kogi clay sample is recommended for general application owing to its robustness to expanded variable effects.
Reference Abali, Y., Colak, S. and Yapici, S. (1997) ‘The optimization of the dissolution of phosphate rock with Cl2-SO2 gas mixture in aqueous medium’, Hydrometallurgy, Vol. 46, Nos. 1–2, pp.27–35. Ajemba, R.O. and Onukwuli, O.D. (2012) ‘Response surface optimization of palm oil bleaching using hydrochloric acid activated Ukpor clay’, European Journal of Scientific Research, Vol. 82, No. 3, pp.325–335. Ajemba, R.O., Igbokwe, P.K. and Onukwuli, O.D. (2013) ‘Optimization of color pigments removal from palm oil by activated Ukpor clay using response surface methodology’, Research Journal of Applied Sciences, Engineering and Technology, Vol. 6, No. 3, pp.423–432. Alam, M.Z., Muyibi, S.A. and Toramae, J. (2007) ‘Statistical optimization of adsorption processes for removal of 2, 4-dichlorophenol by activated carbon derived from oil palm empty fruit bunches’, J. Environ. Sci. China, Vol. 19, No. 6, pp.674–677. Bar, M. (1963) ‘General characteristics and application of the montmorillonite hydrocolloids’, Am. Perfumer Cosmet., Vol. 78, pp.2–37. Berbesl, R. (2006) ‘Achieving optimal bleaching performance’, Oil Mill Gazzeteer, Vol. 112, pp.1–5. Bockish, M. (1997) Fats and Oil Handbook, pp.613–615, AOCS Press, Champaign, Illinois, USA. Egbuna, S.O., Aneke, N.A.G. and Chime, T.O. (2009) ‘Investigation of bleaching clay particle on quality and satiability of physically refined palm oil’, Journal of Engineering and Applied Sciences, Vol.5, Nos. 1 and 2, pp.8–14, ISSN: 1119-8109. Gunawan, E.R. and Suhendra, D. (2008) ‘Four-factor response surface optimization of the enzymatic synthesis of wax ester from palm kernel oil’, Indonesian J. Chem., Vol. 8, No. 1, pp.83–90.
88
C.F. Uzoh et al.
Hlaing, N.N. and Oo, M.M. (2008) ‘Manufacture of alkyd resin from castor oil’, World Academy of Science, Engineering and Technology, Vol. 48. Janardhanan, K.R. (2012) Soaps and Detergent [online] http://www.vgyanprasar.gov.in/Radio serials/soaps and detergent.pdf (accessed 06 November 2012). Li, D., Park, K., Wu, Z. and Guo, X. (2010) ‘Response surface design for nickel recovery from laterite by sulfation-roasting-leaching process’, Trans. Nonferrous Met. Soc. China, Vol. 20, pp.92–96. Montgomery, D.C. (1999) ‘Experimental design for products and processes’, The Statistician, Vol. 48, Part 2, pp.159–177. Montgomery, D.C. (2001) Design and Analysis of Experiments, 5th ed., Wiley, New York. Monvisade, P. and Siriphannon, P. (2009) ‘Chitosan intercalate montmorillonite: preparation, characterization and cationic dye adsorption’, Applied Clay Science, Vol. 42, Nos. 3–4, pp.427–431. Morad, N.A., Aziz, M.K.A. and Zin, R.B.M. (2006) Process Design in Degumming and Bleaching of Palm Oil, Center of Lipid Engineering and Applied Research, University Technology Malaysia. Narayana, S.K.V., King, P., Gopinadh, R. and Sreelakshmi, V. (2011) ‘Response surface optimization of dye removal by using waste prawn shells’, Int. J. Chem. Sci. Appl., Vol. 2, No. 3, pp.186–193. Otto, M. (1999) Chemometrics: Statistics and Computer Applications in Analytical Chemistry, Wiley-VCH, New York. Silva, G.F., Camargo, F.L. and Ferreira, A.L.O. (2010) ‘Application of response surface methodology for optimization of biodiesel production by transesterification of soybean oil with ethanol’, Fuel Process. Technol. Sudamalla, P., Saravanan, P. and Matheswaran, M. (2012) ‘Optimization of operating parameters using response surface methodology for adsorption of crystal violet by activated carbon prepared from mango kernel’, Sustain. Environ. Res., Vol. 22, No. 1, pp.1–7. Umesh, G. and Sud, D. (2005) ‘Optimization of process parameters for removal of Cr (VI) from aqueous solutions using modified sugarcane bagasse’, E-J. Environ. Agric. Food. Chem., Vol. 4, No. 6, pp.1150–160. Uzoh, C.F., Onukwuli, O.D., Odera, R.S. and Ofochebe, S. (2013) ‘Optimization of polyesterification process for production of palm oil modified alkyd resin using response surface methodology’, Journal of Environmental Chemical Engineering, No. 1, pp.777–785. Vicente, M.A., Suárez, M., de Dios López-González, J. and Bañares-Muñoz, M.A. (1996) ‘Characterization, surface area, and porosity analyses of the solids obtained by acid leaching of a saponite’, Langmuir, Vol. 12, pp.566–572.
Nomenclature AOCS American Oil Chemists Society Ao
absorbance of CPO
Ai
observed absorbance of bleached palm oil CPO
HCl
hydrochloric acid or hydrogen chloride acid
HNO3
nitric acid or hydrogen nitrate acid
H2SO4 sulphuric acid or tetraoxosulphate(VI) acid PSD
particle size distribution
Experimental process design for sorption capacity of Kogi and Ibusa clay RSM
response surface methodology
X
coded independent system variables
Y
dependent variable, predicted response
β
constant coefficients of mathematical model
ε
random error of mathematical model
89