Robert L. Grossman, Yunhong Gu and Xinwei Hong. National Center ..... SACK, Westwood, and more recently, Scalable TCP, HighSpeed TCP, and. FAST TCP.
Experimental Studies Using Application Layer Protocols Based Upon UDP to Support Applications Requiring Requiring Very High Volume Data Flows Robert L. Grossman, Yunhong Gu and Xinwei Hong National Center for Data Mining University of Illinois at Chicago Antony Antony, Johan Blom, Freek Dijkstra, and Cees de Laat University of Amsterdam April 2, 2004 (Version 14)
Abstract We describe a UDP based application level transport protocol, named UDT (UDP based Data Transfer) that is designed for high performance networking and computing. It is fast, fair, and friendly. UDT can utilize high bandwidth efficiently over wide area networks, where the TCP protocol has been found to be inefficient. Unlike TCP, UDT is fair to flows independently of their RTTs. In addition, UDT is friendly to concurrent TCP flows, which means it can be deployed not only on experimental research networks but also on production networks. To ensure these properties, UDT employs a novel congestion control approach that combines rate based and window based control mechanisms. In this paper, we describe the congestion control algorithms used by UDT and provide some experimental results demonstrating that UDT is fast, fair and friendly. Keywords: UDT, Bandwidth Delay Product (BDP), Grid Computing, Transport Protocol
1
1
Introduction
Data intensive distributed and grid applications often involve transporting, integrating, analyzing, or mining one or more very high volume data flows or, what we call in this paper, teraflows. Computing with teraflows was impractical until recently when network infrastructures supporting 1 Gb/s and 10 Gb/s links began emerging. As networks with these bandwidths begin to connect computing and data resources distributed around the world, the limitations of current network protocols are becoming apparent. Currently deployed network transport protocols face several difficulties in effectively utilizing high bandwidth, especially over networks with high propagation times. These difficulties grow commensurately with the bandwidth delay product (BDP), which is the product of the bandwidth and the round trip time (RTT) of the path. In particular, it is an open problem to design network protocols for mixed traffic of teraflows and commodity traffic which are fast, fair and friendly in the following senses: 1. By fast, we mean the protocol should be able to transfer data with very high speed. The throughput obtained by the protocol should only be limited by the physical characteristics of the network and some reasonable overhead of the lower level protocols. For example, a single flow of the protocol with no competing traffic should be able to use all of the available bandwidth B, even for B = 1 Gb/s and B = 10 Gb/s links. 2. By fair, we mean that the protocol has the ability to share bandwidth resources with other flows using the same protocol in the sense that m high speed flows on a high bandwidth delay product link with no competing commodity traffic will all share roughly B/m of the bandwidth. 3. By friendly, we mean that the protocol can coexist with commodity TCP flows. The protocol should not use up all the available bandwidth so that concurrent TCP flows unable to get a fair allocation of bandwidth. More specifically, the average TCP flows should have approximately the same throughput in two situations: 1) only m + n TCP flows exist, 2) m TCP flows and n high speed flows exist. TCP is a protocol that becomes less than optimal as network bandwidth and delay increase, although it is still dominant on today’s Internet. During 2
its congestion avoidance phase, TCP is designed to increase its sending rate by one segment per RTT when there is no congestion event as indicated by three consecutive packet losses or out of order packets; each time there is a congestion event, the sending rate is decreased by half. This approach, called additive increase multiplicative decrease (AIMD), is very inefficient for networks with high BDPs. The recovery time for a single lost packet can be very high. It is also unfair to competing flows in the sense that flows with shorter RTTs can obtain more bandwidth. In this paper, we concentrate on the congestion avoidance behavior of TCP. TCP Slow Start, TCP fast retransmit, and fast recovery are out of the scope of this paper. In this paper, we show that a new protocol called UDT (for UDP based Data Transfer) can be used to support teraflows for distributed and grid computing applications. We also show experimentally that UDT is fast, fair and friendly in the senses above, even over networks with high BDPs. In addition, since UDT is implemented at the application level, it can be deployed today without any changes to the current network infrastructure. Of course, UDT can also be deployed more efficiently by modifying the operating system kernel. UDT uses UDP packets to transfer data and retransmits the lost packets to guarantee reliability. It has a congestion control algorithm combining both rate based and window based approaches that tune both inter-packet time and the congestion window, respectively. It is not a goal of UDT to replace TCP in the Internet. Instead, protocols like UDT can be used to supplement TCP in networks with large BDPs where some applications require one or several teraflows and these must co-exist with commodity flows. The control mechanism of UDT will be described in section 2. In section 3 we will introduce experimental results. Section 4 will briefly look at related work. Section 5 contains a summary and conclusion.
2 2.1
Description of UDT Protocol Overview
UDT originates from the SABUL algorithm [12], [13], [6], but introduces a new congestion control algorithm that satisfies fairness while achieving similar throughput to SABUL. SABUL uses a MIMD control algorithm to tune the sending rate based on the current sending rate. UDT uses the AIMD control algorithm, but the parameters are updated dynamically by a bandwidth estimation technique. In addition, UDT removes the TCP 3
Seq. No. Flag Array
Application/Protocol Buffer DATA Seq. No | User Data
Application/ Protocol Buffer Overlapped I/O Control ACK2 | ACK Seq
Control ACK/NAK | RTT | BW | Speed | etc. UDP Connection Loss seq. no. List
Loss seq. no. List
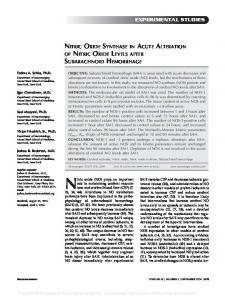
Figure 1: The architecture of the UDT protocol. control channel of SABUL by sending control information in the same UDP data channel. UDT transfers data between a pair of UDP ports. All UDT data packets have the same size, which is set to be the MTU of the path. Each data packet is assigned an increasing sequence number. This sequence number is used by UDT’s reliability mechanism. The first bit of the UDT header is used to distinguish a data packet from a control packet. The data transfer mechanism of UDT is presented in Figure 1.
2.2
Reliability Control
UDT uses two kinds of acknowledgements to guarantee reliability. Selective positive acknowledgments (ACK) are sent back at constant intervals as long as new packets continue to arrive in sequence. So, an ACK usually can acknowledge the successful receiving of a block of packets. An ACK provides the sender with the largest sequence number of packets that have been received in order. Negative acknowledgement (NAK) is generated as soon as a packet loss is detected by the receiver. Information about lost packets may be resent if the receiver has not received the retransmission in a certain amount of time, which is increased each time the same packet loss information is sent. The sender will retransmit the lost packets once it receives the NAK packet. With selective acknowledgement, UDT has only a very small portion of control packets. More importantly, this also significantly reduces the computation overhead of the end systems, compared to TCP for example, which acknowledges every single packet. 4
2.3
Congestion Control
The congestion control of UDT has two independent parts: flow (window) control and rate control. The flow window is a threshold to limit the number of unacknowledged packets. It is dynamically set AS ∗ (RT T + SY N ). Here, SYN is a constant interval for rate control. In practice, SYN is set to 10 ms. AS is the current packet arrival speed. The receiver records the packet arrival intervals. Once an ACK is to be sent, it calculates the median of the packet arrival intervals (M) since the last ACK, calculates the packet arrival speed (AS = 1/M), and attaches it to the current ACK packet. We use median instead of mean value because the packet sending may not be continuous and the packet arrival interval may be unnecessarily large due to the interruption in packet sending. Once the UDT sender receives this ACK, it updates the flow window size with the product of the estimated RTT and AS. To calculate RTT, the UDT sender will send an ACK2 packet immediately after it receives an ACK packet. The UDT receiver can then estimate RTT value according to the timestamps when the ACK leaves and when the ACK2 arrives. UDT uses ACK sub-sequencing (i.e., each ACK is assigned a unique ACK sequence number) to match the ACK-ACK2 pair accurately. We used ACK2 because both sides of UDT need to know the RTT value. Flow control is used to reduce the number of packets sent during congestion, helping to clear the congestion. At the same time, UDT also uses rate control to limit the packet sending speed. Rate control updates the inter-packet time according to a modified AIMD principle. The decrease factor, usually initiated by a NAK, is 1/9. The increase parameter is proportional to the end-to-end link capacity, estimated by a packet pair using UDT’s own data traffic. Once a NAK is received, the inter packet time will be increased by 1/8, which is equivalent to decreasing the sending rate by 1/9 (= 1−1/(1+1/8)). This is the MD part of the AIMD algorithm. The rate increase is triggered every 0.01 seconds if no NAK was received during the last 0.01 seconds. This constant rate control interval is to eliminate the fairness bias caused when different flows have different RTTs. First, an increase parameter of the number of additional packets to be sent during the next 0.01 seconds is calculated. Based on this information, the inter-packet time is calculated. This is the AI part of the AIMD. If the estimated end-to-end capacity is B (in number of packets per second), the current sending rate is C (in number of packets per second), 5
and the fixed UDT packet size is S (including all packet headers, in bytes), then the number of packets to be increased is: 1 1500 where β = 1500/S. Note that in practice, the value of C can be equal to or greater than the value of B; in this case, the value of Ninc is 1/S. The optimal UDT packet size is MTU. In this paper, we consider 1500 bytes as the typical value of MTU. When the packet size is 1500 bytes, we hope to increase the number of packets to send per SYN according to predefined values as shown in Table 2.3. But if the packet size is not 1500 bytes, we need to correct the increment by 1500/S, which is the functionality of β. Ninc = β max
�
10 (dlog 10 (S (B −C)∗8)e−9) ,
�
Table 1: The relationship between available bandwidth and rate increment. Available Bandwidth (B − C) 100 - 1000 Mb/s 10 - 100 Mb/s 1 - 10 Mb/s
Ninc 1 packet (= 1500 bytes) 0.1 packets (= 150 bytes) 0.01 packets (= 15 bytes)
To estimate the end-to-end bandwidth, UDT sends a back to back packet pair every 16 data packets by omitting the inter-packet waiting between every 16th packet and its successor. The receiver then calculates the estimated bandwidth and sends it back through an ACK packet. With this approach, flows with higher sending rates do not get larger increase parameters and all flows sharing a common bottleneck converge to an appropriate fairness equilibrium. This fairness is independent of RTT due to the constant rate control interval.
3
Experimental Studies
In this section we describe the testbed and the experimental studies we performed.
3.1
Testbeds
The tests for this paper used two testbeds. The first is called the Tera Wide Data Mining (TWDM) Grid Testbed and the second is called the DataTAG 6
Testbed. The TWDM Grid testbed is an application testbed operated by the National Center for Data Mining at the University of Illinois at Chicago and built on top of three high speed networks: NetherLight [19], constructed and operated by SURFnet [21], OMNInet [16], and Abilene [1]. The three networks are connected at StarLight [20] in Chicago. Several of the experiments below were conducted during the SC 03 Conference. During SC 03 in Phoenix, AZ, our research booth was connected through the conference SCInet network to StarLight via four 1G links. The testbed used at SC 03 is described in Figure 2. NetherLight is located in Amsterdam, Netherlands. It has three 10 Gb/s connections to North America. Two of them are used in the testbed. One of the 10 Gb/s connections is connected to Abilene in New York, and from there all regular traffic is routed to StarLight through the Abilene 10 Gb/s backbone. The other 10 Gb/s connection was used to set up an optical path directly between NetherLight and StarLight. Both StarLight and OMNInet are located in Chicago. Our lab, the National Center for Data Mining (NCDM) at UIC, is connected to StarLight via a 4 Gb/s path over OMNInet. For the tests described below, clusters of workstations in Amsterdam, StarLight, NCDM/UIC, and Phoenix were used. The Amsterdam cluster consisted of ten Dell PowerEdge 2650 with 350 GB of disk space each. This cluster is attached to NetherLight. The StarLight cluster consisted of seven similarly configured nodes. The NCDM/UIC cluster consisted of five similar servers. During SC 03, our research booth contained an 8 node cluster, each having 100 GB to 250 GB of disk space and dual Xeon processors. The nodes in the cluster ran either Redhat Linux 7.3 (kernel 2.4.184smp) or Debian Linux. Each node has either copper or fiber GbE NICs installed. Either hardware RAID or software RAID is configured on all of the servers used. In summary, the testbed has about 30 servers with 6 TB of disk space. At the same time, two Itanium systems were used, one attached to StarLight and the other attached to NetherLight. Both of them had an Intel Pro/10GbE LR network interface card installed. A dedicated 10 Gb/s optical path was used to connect these two nodes. Redhat Linux was installed on these machines. We next describe the DataTAG testbed [8]. The DataTAG testbed is a large-scale intercontinental Grid testbed that focuses upon advanced networking issues and interoperability between these intercontinental Grid domains [8]. The DataTAG testbed consists of a high speed network as well 7
Figure 2: The network architecture of the TWDM Grid testbed is described in this figure. as dozens of high performance servers. A 10 Gb/s transatlantic optical path was established between Geneva (CERN) and Chicago (Starlight). Highend servers were attached to the network on both sides. All servers have 2.4 GHz Intel dual Xeon processors. These servers also have optical Gigabit Ethernet cards. During our tests, we had access to six servers on each side. All tests were between these servers.
3.2
Fairness and Friendliness Experiments on the TWDM Grid Testbed
During SC 03, we did two fundamental experimental studies. One was designed to demonstrate the fairness and friendliness of UDT. The other was designed to demonstrate UDT’s efficient use of available bandwidth over networks with high BDPs, i.e., to demonstrate that UDT is fast. In this section, we describe experiments using the TWDM Grid Testbed to measure the fairness and friendliness of UDT. For these experiemnts, the traffic goes through a 10 Gb/s connection to Abilene in New York. The
8
traffic then passes through Abilene’s 10 Gb/s backbone and arrives at the show floor of SC 03. The round trip time between these two sites is about 190 ms. For this test we connected four nodes in the NetherLight cluster with four nodes in our research booth in Phoenix. Each node was limited to 1 Gb/s by its 1 Gigabit NIC. Table 2: Throughput statistics for fairness and friendlienss tests on the link between NetherLight and SC 03. The mean µ and the standard deviation σ is measured across flows. This test was run for 30 minutes. (unit: Mb/s)
U DT1 667 311 209 172
UDT flows (Mb/s) U DT2 U DT3 U DT4 320 218 156
239 180
169
µ 667 316 222 169
σ/µ 0 2.0% 7.0% 5.0%
50 TCP flows (Mb/s) µ Min. Max. σ/µ 4.23 3.40 8.75 18% 4.19 3.31 7.96 15% 4.05 3.17 7.85 22% 3.81 2.92 6.44 14%
Table 3: Summary of average and aggregated throughput of TCP and UDT for the fairness and friendliness tests on the link between NetherLight and SC 03. (unit: Mb/s)
# Flows 1 2 3 4
UDT Average 667 315.5 222 169.3
Aggregate 667 631 666 677
# Flows 50 50 50 50
TCP Average 4.23 4.19 4.05 3.81
Aggregate 212 210 203 191
Overall Throughput 878 841 869 868
One node in Amsterdam sent 1 teraflow to a corresponding node in Phoenix and 50 TCP flows. The second node in Amsterdam sent two teraflows to the corresponding node in Phoenix and 50 TCP flows. The third node in Amsterdam sent three teraflows to the corresponding node in Phoenix and 50 TCP flows, while the fourth node in Amsterdam sent four teraflows to the corresponding node in Phoenix and 50 TCP flows. So in 9
total, there were 10 teraflows and 200 TCP flows between the two four node clusters. Our goal was to demonstrate that UDT was fast, fair and friendly, as defined in Section 1. This experiment is summarized in Tables 2 and 3. In these tables, first, the throughput of each flow is computed by averaging the throughput of the flow during the tests, with a sampling time of 1 second. Then, second, the mean µ, standard deviation σ, and ratio σ/µ is computed across the 50 TCP flows and then, separately, across the 1-4 UDT flows. For the TCP flows, we also report the minimum and maximum throughput. Note the following from these two tables. 1. First, UDT is fair in the sense that σ/µ is relatively low, indicating that the available bandwith left for the teraflows is shared relatively equally between the teraflows. For example, in the case of 4 UDT flows σ/µ is only 5.0%. In fact, in this experiment, the ratio σ/µ is lower for the teraflows than for the commodity TCP flows. 2. Second, UDT is friendly in the sense that the aggregate bandwidth used by 50 TCP flows is relatively constant, varying between 191 and 212 Mb/s, as the number of UDT teraflows varies. Similarly, the average TCP throughput for the 50 TCP flows is relatively constant, varying between 3.91 and 4.24, as the number of UDT teraflow varies. 3. Third, we note that UDT makes relatively efficient use of the available bandwidth in the sense that the aggregate throughput varies between 841 and 878 Mb/s.
10
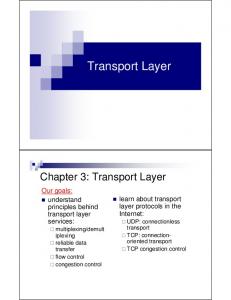
Figure 3 shows the results visually. This figure is a screen snapshot taken during the demonstration at SC 03. There are four windows in the figure, each represents a demo between a pair of machines. Each demo runs 50 commodity TCP flows and 1 to 4 UDT teraflows. The TCP throughput is represented by the small squares on the top of the windows. The UDT performance is represented by the large squares in the middle of the windows. The size of the blue squares represents the maximum throughput of a flow. In our demos, we set the TCP congestion windows to be 256KB. So, the theoretical maximum throughput of a TCP flow is about 11 Mb/s (i.e., 256KB/190ms). The maximum throughput of a UDT flow is 1 Gb/s divided by the number of UDT flows between the pair of machines. The size of the green squares represents the realtime throughput obtained by a flow. The higher the throughput, the larger the square. The size of the green squares varies dynamically. The bottom part of the window shows a trace over time over the total UDT througput. Although the units cannot be easily read, the total UDT throughput is approximately 670 Mb/s over the 120 seconds shown in the Figure. Fig. 4 is an enlargement of the left bottom graph in Fig. 3. During SC 03, we ran the demo at least 6 hours each day for 4 days. We obtained consistent performance throughout this entire period.
11
Figure 3: This visualization summarizes the performance of 10 UDT teraflows and 200 commodity TCP flows and visually shows that UDT is fair to other teraflows and friendly to commodity TCP flows. The large boxes at the bottom of the graph represent UDT teraflows. The small boxes at the top of the graph represent TCP flows. The percentage of green in a given box represents the percentage of actual bandwidth utilization for that flow.
12
Figure 4: Enlarged picture of the left bottom window in Fig. 3
13
3.3
Fairness and Friendliness Experiments on the DataTAG Testbed
In this section, we summarize fairness and friendliness experiments using the DataTAG Testbed. We performed a number of experiments using the link between CERN and StarLight. The results are presented in Tables 4 and 5. The round trip time between CERN and StarLight is 116ms, while the round trip time between NetherLight and SC 03 is 190ms. Note that: • The throughputs were computed as described above: First, by averaging over samples obtained at 1 second intervals. Second by computing the average and standard deviations across the UDT flows, and separately, across the 50 TCP flows. • Due to the shorter RTT, the mean TCP throughput is higher on the DataTAG testbed than on the SC 03 TWDM Grid Testbed. For example, for four UDT teraflows, the average TCP throughput on the DataTAG testbed is 6.04 Mb/s, while on the SC 03 TWDM testbed it is 3.81 Mb/s. • In contrast, the UDT throughput is essentially the same on the two testbeds, demonstrating that UDT’s throughput is independent of RTT. For example, for four UDT teraflows, the average throughput is 169 Mb/s on the SC 03 TWDM testbed and 160 Mb/s on the DataTAG testbed. • The ratio σ/µ for the UDT flows is relatively small, demonstrating that UDT is fair in the sense defined above. In fact, these ratios are smaller for the DataTAG tests than for the SC 03 TWDM tests. For the DataTAG tests, the ratio σ/µ is modestly smaller for TCP flows compared to the UDT flows. This was not the case for the SC 03 TWDM tests. • As before, the aggregate TCP bandwidth is relatively constant, as the number of UDT flows varies from 1 to 4. In fact the aggregate bandwidth only varies beteen 302 Mb/s and 317 Mb/s. This demonstrates that UDT is friendly in the sense defined above. • As before, the overall throughput is relatively high, indicating that UDT can efficiently use the available bandwidth. Indeed, the bandwidth utilization is modestly higher on the DataTAG testbed com14
pared to the SC 03 TWDM testbed (945 Mb/s compared to 878 Mb/s for a single UDT flow, for example).
Table 4: Throughput statistics for fairness and friendliness tests using the DataTAG testbed. The mean µ and standard deviation σ were computed over the several UDT flows, and, separately, over the 50 TCP flows. This test was run for 1000 seconds, i.e., 16.7 minutes.
U DT1 628 318 218 162
UDT flows (Mb/s) U DT2 U DT3 U DT4 311 206 157
202 159
160
µ 628 315 209 160
σ/µ 0 1.6% 4.0% 1.3%
50 µ 6.34 6.18 6.09 6.04
TCP flows (Mb/s) Min. Max. σ/µ 6.22 6.32 0.3% 5.64 6.29 0.6% 6.96 6.23 0.8% 5.94 6.14 0.7%
Table 5: Summary of average and aggregated throughput of TCP and UDT flows for the fairness and friendliness tests using the DataTAG testbed. (unit: Mb/s)
# Flows 1 2 3 4
UDT Average 628 314.5 208.7 159.5
Aggregate 628 629 626 638
# Flows 50 50 50 50
15
TCP Average 6.34 6.18 6.09 6.04
Aggregate 317 309 305 302
Overall Throughput 945 938 931 940
3.4
Bandwidth Utilization Experiments using the TWDM Grid Testbed
For the next experiment, we transported Sloan Digital Sky Survey data [10] across the Atlantic from Amsterdam to Chicago. For this experiment, we sent data from NetherLight to StarLight via two different paths simultaneously: one is the 10 Gb/s routed Abilene link and the other is the 10 Gb/s dedicated optical path between NetherLight and StarLight. Up to 10 UDT flows ran over the routed link. Since every server has a bottleneck of 1 Gb/s throughput, we expected to get 10 Gb/s on this path. At the same time, we ran several flows over the 10 Gb/s optical path. We hoped to get up to 10 Gb/s throughput on this path also. With this setup, the maximum bandwidth is 20 Gb/s. To test the bandwidth available in practice we used Iperf in UDP mode and obtained a bandwidth of about 12.5 Gb/s. The difference between the 12.5 Gb/s measured by Iperf and the theoretical 20 Gb/s upper limit can be explained by limitations in the routers and other network infrastructure along the routes and is discussed in more detail below. It is important to recall that Iperf uses a simple transport mechanism and doesn’t guarantee packet delivery. The 10G NIC card we used appears to place limitations on the maximum overall throughput possible. The tests used an Intel 10G NIC card with a PCI-X (64 bit, 133 MHz) processor. The bus speed of the PCI-X is about 8.5 Gb/s. With the communication overhead, the card can only provide about 5 to 6 Gb/s. The new generation PCI-X 2.0 may relieve this problem in the future. When two UDT teraflows are sent over the 10 Gb/s optical path, each gets about 2.5 Gb/s throughput, so the aggregated throughput is about 5.0 Gb/s. A single UDT teraflow running on the 10 Gb/s optical path gets about 4.5 Gb/s throughput. These were the first experiments using 10 Gb/s optical paths and it appears that further work and tuning is required in order for UDT to use more of the available bandwidth. On the routed 10 Gb/s path, we ran 8 UDT flows and got about 6.6 Gb/s throughput. The major bottleneck resides in the switch. The backplane of the switch (CISCO 6059) has a limitation of 8 Gb/s. The overhead of the communication on the bus and the overhead of the UDT/UDP/IP stack also makes the throughput a little bit lower than expected. Table 6 includes statistics on the throughput of these UDT flows, including mean, standard deviation and maximum. The results in the table are based on a sampling rate of 1 second. From the table, we can see that the standard deviation of the two flows on Itanium systems is very low, less than 16
Table 6: Throughput statistics on the 10 Gb/s optical paths and routed links between NetherLight and StarLight using the TWDM Grid Testbed. The mean µ and the standard deviation σ for each flow over time. This test ran for 20 minutes. Mean σ Maximum (Mb/s) (Mb/s) (Mb/s) Flows on 10 Gb/s optical paths Flow 1 2485 7.38 2726 Flow 2 2485 2.40 2492 Routed Flows Flow 3 797 137 953 Flow 4 449 80 713 Flow 5 761 145 949 Flow 6 759 142 920 Flow 7 794 130 953 Flow 8 505 189 925 Flow 9 766 144 926 Flow 10 582 196 938 Aggregated Throughput for 10 flows Overall 10386 565 11647
10. This also indicates that the performance between the Itanium systems is very stable. We observed that competition exists on the routed link, and that is probably the reason that the standard deviations of the 8 routed flows are much higher. We noticed that, on the 10 Gb/s optical path, the bottleneck is on the end systems. However, the bottleneck on the routed links resides in the switches. The results are also summarized in Figure 5. The figure shows the throughput of UDT flows in a demonstration that runs for 20 minutes, with a sampling rate of 10 seconds. In the figure, the upper green line represents the overall throughput during the demonstration. The individual throughputs are represented by the lower lines. Two streams on the Itanium system have very smooth values around 2.5 Gb/s and they share the bandwidth equally. In the graph, these two lines are overlapped. The throughputs of these 8 UDT flows are presented on the bottom of the figure. Eight UDT flows compete for the 6.8 Gb/s available bandwidth. This is the reason that 17
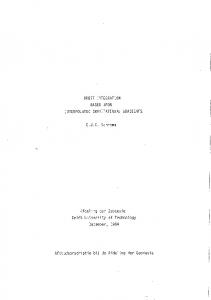
Figure 5: This graph details the throughput of individual UDT teraflows, as well as the aggregated throughput between Amsterdam (NetherLight) and Chicago (StarLight). The top green line represents aggregated throughput. The middle flat lines represents 2 UDT flows between two Itanium systems (Note: they are overlapped). The lower eight lines represent eight routed UDT flows. the throughputs of these 8 UDT flows fluctuate greatly. In summary, we got up to 11.6 Gb/s throughput transporting astronomical data across the Atlantic from Amsterdam to Chicago. Compared to the 12.5 Gb/s bandwidth obtained by Iperf, this represents an effective utilization of about 94% of the available bandwidth.
18
3.5
Bandwidth Utilization Experiments using the DataTAG Testbed
In another experiment, we also transferred the astronomical data through the DataTAG testbed between Geneva (CERN) and Chicago (StarLight). The results are summarized in Table 7. From these results, we can see that UDT can get as high as 5.67 Gb/s on DataTAG. Considering the maximum throughput between 6 pairs of machines is 6 Gb/s, UDT achieves 94.5% utilization. The results are also shown in Figure 6. These tests were also run during SC 03. The figure shows results for more than 30 minutes. The aggregated throughput is shown in the figure as the top line. Six individual throughputs are represented by the lower lines. Table 7: Throughput statistics on DataTAG connection between CERN and StarLight. The mean µ and standard deviation σ are computed over time for each flow. This test run lasted 32 minutes. (unit: Mb/s)
Flow 1 Flow 2 Flow 3 Flow 4 Flow 5 Flow 6 Overall
4
Mean µ (Mb/s) 881 785 930 810 803 768 4977
σ (Mb/s) 160 209 122 183 174 186 175
Maximum (Mb/s) 958 958 958 965 972 891 5666
Related Work
Currently, there are four approaches being investigated for high performance data transport: employing parallel TCP connections, modifying standard TCP, creating new protocols based upon UDP, and developing entirely new network transport layer protocols. Using parallel TCP connections to achieve higher performance is intuitive [11], and also widely available since the current version of GridFTP employs this approach [4]. There are several problems with this approach however. For example, careful tuning is required to determine both the window size and the number of flows required. In addition, there is current 19
Figure 6: This graph details the throughput of individual UDT teraflows, as well as the aggregated throughput between Geneva (CERN) and Chicago (StarLight). The top red line represents aggregated throughput. The lower six lines represent individual UDT flows. research to understand how to dynamically adapt the number of concurrent flows as the network changes and how to overcome the RTT bias problem of current implementations of TCP [14]. Another problem is that large oscillations can arise when multiple TCP flows coexist, causing imbalances among the parallel connections. A second approach is to modify TCP. One of the first places to start is to modify the additive increase multiplicative decrease (AIMD) congestion control algorithm in standard TCP. There is a great deal of work in this area, resulting in a series of TCP variants, including TCP Reno, New Reno, SACK, Westwood, and more recently, Scalable TCP, HighSpeed TCP, and FAST TCP. Scalable TCP and HighSpeed TCP use more aggressive congestion control algorithms to replace the standard AIMD algorithm. As the congestion window becomes larger, they both increase faster; in addition, HighSpeed TCP also decreases slower, whereas Scalable TCP has a constant decrease
20
factor of 1/8. When the window size is below a threshold window size, Scalable TCP and HighSpeed TCP handle congestion using the same mechanism as standard TCP does. In this way, they are friendly to standard TCP flows for traditional low BDP networks, whereas they are more aggressive over high BDP networks (cwnd > threshold window size). Beyond this threshold, Scalable TCP takes a multiplicative increase, whereas HighSpeed TCP calculates the increase parameter according to the current congestion window size. The MIMD algorithm used in Scalable TCP is not fair according to [7]. Meanwhile, the control algorithm in HighSpeed TCP, although less aggressive than that of Scalable TCP, can also lead to unfairness since flows with higher congestion windows have a greater increase parameter [9]. FAST TCP extends TCP Vegas [5] by defining a new function to calculate the congestion window using the packet delay information, rather than increasing or decreasing by predefined values. Using packet delay as an indication of congestion can predict the congestion earlier so that packet loss may be avoided, or at least reduced. However, packet delay may not actually indicate congestion [18], and it can be severely affected by the traffic on the reverse route. A third approach is to employ entirely new network transport protocols, such as open loop control. XCP [17] generalizes Explicit Congestion Notification (ECN) by using precise congestion signaling, where the routers expressly tell the sender the state of congestion and how to react to it. In XCP, routers monitor the input traffic rates of each of their output queues and tell each of the flows sharing that link to increase or decrease their congestion windows by annotating the congestion headers of data packets, which are then returned to the sender in an acknowledgment packet from the receiver. XCP has a MIMD efficiency controller and an AIMD fairness controller. Improvements to TCP (Approach 2) require changes to the network stack in operating systems. New network protocols (Approach 3) require, in addition, changes to the network infrastructure itself, such as new code in routers. For this reason, significant time and significant investment will be required for both the standardization and for the deployment of new protocols such as the ones described above. In contrast, the fourth approach in which new algorithms are deployed at the application layer will have arguably the greatest impact in the near term and intermediate term. It is important to note that new flow control and congestion control algorithms that are developed for application layer 21
deployment can always be implemented in the network stack in the long term after a standard approach has emerged. There have been several independent implementations of application layer protocols (Approach 4), including SABUL [12], RBUDP [15], Tsunami [3] and FOBS [2]. The basic idea is to use a UDP based data channel and a separate control channel to provide reliability and/or congestion control. RBUDP, Tsunami, and FOBS are approaches that use simple rate based UDP with reliability control. These three protocols employ a simple rate control mechanism based upon packet loss. These protocols use a constant sending rate, which is determined by the application. This enables efficient use of the bandwidth but requires that the appropriate constant sending rate be determined externally. Fairness and friendliness issues are not addressed since these three protocols are designed to be used in private or QoS enabled networks. SABUL is a more complex protocol that also uses UDP but has a fully functional congestion control algorithm to address the efficiency, fairness, and friendliness issues. UDT extends SABUL by introducing bandwidth estimation and flow control into SABUL’s congestion control algorithm. In addition, UDT employs a UDP-based control channel while SABUL uses a TCP-based control channel. Both SABUL and UDT employ a UDP-based data channel.
5
Summary and Discussion
In this paper we described a new application level protocol called UDT. UDT is built over UDP. UDT employs a new congestion control algorithm that is designed to achieve intraprotocol fairness in the presence of multiple high volume flows. UDT is designed to be fast, fair and friendly in the senses defined in Section 1. We showed in various experimental studies that UDT can effectively utilize the high bandwidth of networks with high BDPs in situations where currently deployed versions of TCP are not effective. We also showed in our experimental studies that UDT is fair to other UDT teraflows. Finally, we showed in our experimental studies that UDT is still friendly to concurrent TCP commodity flows. Since UDT is built over UDP and is implemented at the application layer, it can be deployed at low cost as it does not require any modifications to the network infrastructure or changes to any operating systems. We have started the process of standardizing UDT through the IETF community.
22
References [1] Abilene network. retrieved from abilene.internet2.edu, December 5, 2003. [2] Fobs. omega.cs.iit.edu/ ondrej/research/fobs, retrieved on April 16, 2003. [3] Tsunami. www.anml.iu.edu/anmlresearch.html, retrieved on April 4, 2003. [4] B. Allcock, J. Bester, J. Bresnahan, A. L. Chervenak, I. Foster, C. Kesselman, S. Meder, V. Nefedova, D. Quesnal, and S. Tuecke. Data management and transfer in high performance computational grid environments. Parallel Computing Journal, 28:749–771, 2002. [5] Lawrence S. Brakmo and Larry L. Peterson. TCP vegas: End to end congestion avoidance on a global internet. IEEE Journal on Selected Areas in Communications, 13(8):1465–1480, 1995. [6] A. Chien, T. Faber, A. Falk, J. Bannister, R. Grossman, and J. Leigh. Transport protocols for high performance: Whither tcp? Communications of the ACM, 2003. [7] D. Chiu and R. Jain. Analysis of increase/decrease algorithms for congestion avoidance in computer networks. Computer Networks and ISDN Systems, 17:1 – 14, 1989. [8] Datatag: Research and technological development for a data transatlantic grid. http://datatag.web.cern.ch/datatag/, retrieved on Mar 2, 2004. [9] Sally Floyd. Highspeed tcp for large congestion windows. http://www.icir.org/floyd/hstcp.html, 2002. [10] Jim Gray and Alexander S. Szalay. The world-wide telescope. Science, 293:2037–2040, 2001. [11] R. L. Grossman, S. Bailey, A. Ramu, B. Malhi, H. Sivakumar, and A. Turinsky. Papyrus: A system for data mining over local and wide area clusters and super-clusters. In Proceedings of Supercomputing. IEEE, 1999.
23
[12] R. L. Grossman, M. Mazzucco, H. Sivakumar, Y. Pan, and Q. Zhang. Simple available bandwidth utilization library for high-speed wide area networks. Journal of Supercomputing, to appear. [13] Robert L. Grossman, Yunhong Gu, Dave Hanley, Xinwei Hong, Dave Lillethun, Jorge Levera, Joe Mambretti, Marco Mazzucco, and Jeremy Weinberger. Experimental studes using photonic data services at igrid 2002. FGCS, 2003, to appear. [14] T. Hacker, B. Athey, and B. Noble. The end-to-end performance effects of parallel tcp sockets on a lossy wide-area network. In Proc. 16th IEEECS/ACM International Parallel and Distributed Processing Symposium (IPDPS), 2002. [15] E. He, J. Leigh, O. Yu, and T. DeFanti. Reliable blast udp: Predictable high performance bulk data transfer. In IEEE Cluster Computing, 2002. [16] Optical Metro Network Initiative. http://www.icair.org/omninet/, retrieved on September 4, 2003. [17] Dina Katabi, Mark Handley, and Charlie Rohrs. Congestion control for high bandwidth-delay product networks. Proceedings of the ACM Sigcomm, 2002. [18] J. Martin, A. Nilsson, and I. Rhee. Delay-based congestion avoidance for tcp. IEEE/ACM Transactions on networking, pages 356–369, 2003. [19] Netherlight: Proving ground for optical networking, constructed and operated by SURFnet. http://www.netherlight.net, retrieved on September 4, 2003. [20] About StarLight. http://www.startap.net/starlight/ABOUT/, 2003. [21] SURFnet: High-quality internet for education and research. http://www.surfnet.nl/en/, retreived on September 4, 2003.
24