Available online at www.sciencedirect.com
ScienceDirect Procedia CIRP 47 (2016) 370 – 375
Product-Service Systems across Life Cycle
Experimenting the use of value models as boundary objects in conceptual PSS design Massimo Panarottoa*, Marco Bertonia, Alessandro Bertonia a
Department of Mechanical Engineering, Blekinge Institute of Technology, Campus Gräsvik, Karlskrona 37179, Sweden
* Corresponding author. Tel.: +46-455-385527; fax: +46-38-50-57. E-mail address:
[email protected]
Abstract The paper presents the results of experimental activities aiming at investigating the role of ‘value models’ as ‘boundary objects’ that facilitate cross-functional discussions in the PSS conceptual design phase. The experiment featured 6 separate sessions involving a total of 22 students in the final year of three different Master Programmes. In the sessions participants were asked to redesign an asphalt compactor and to use different types of design decision support for this task, namely value models vs. requirements checklists. The recordings from the experiment were analysed using protocol analysis to compare the behaviour of teams. The results confirm the hypothesis that, compared to traditional requirement checklists, value models emphasizes activities related to the clarification (1) of the problem domain and needs and (2) of the lifecycle aspects of a solution concept. Both results suggest that value models have the ability to facilitate cross-boundary discussion in the early phases of the PSS design process, and to act as boundary objects that provide a common platform for knowledge sharing within the crossfunctional team. © Authors. Published by Elsevier B.V This is an open access article under the CC BY-NC-ND license ©2016 2016The The Authors. Published by Elsevier B.V. (http://creativecommons.org/licenses/by-nc-nd/4.0/). Peer-review under responsibility of the scientific committee of the 8th Product-Service Systems across Life Cycle. Peer-review under responsibility of the scientific committee of the 8th Product-Service Systems across Life Cycle Keywords: protocol analysis; value model; experiment; boundary object; conceptual design.
1. Introduction The underlying strategic principle of PSS is to shift from business based on the value of exchange of product ownership and responsibility, to business based on the value of utility of the product and services [1]. Hence, compared to traditional product development [2], a PSS project is dependent on a much broader set of knowledge and skills in the design activity, from logistics to IT, from economics to law and marketing [3]. Research spotlights the importance of enhancing collaboration, communication and coordination among these cross-functional specialists since the earliest phases of design, proposing methods and tools to orchestrate this complex network of internal and external stakeholders [4,5,6]. Developing and delivering a successful solution becomes then a matter of maintaining a shared understanding of data, information and knowledge from all parts of the value chain
already from the early design stages [7]. Previous contributions [1] identified ‘perception of value’ as one of the 6 boundary conditions for PSS design, pointing to the need for the development task to emphasize the understanding of value perception compared to a traditional product development context. The underlying logic is that, instead of focusing on requirements fulfilment and cost analysis, design decisions should be based on the value generated along the entire lifecycle of a product or service [7]. At the 7th IPSS Conference the authors [8] elaborated on the creation of an overarching cross-system value-based metrics, and on the benefits and opportunities of using ‘value models’ to guide design choices in the early phases. Recent work [9] emphasizes the opportunity of using these models as ‘boundary objects’ [10] that “sit in the middle” and serve as a basis for conversation and knowledge sharing within the cross-functional design team. Their ability to work as “good communicative device across” [10] resides in the opportunity to use them to cope with the progressive opacity of intent and
2212-8271 © 2016 The Authors. Published by Elsevier B.V. This is an open access article under the CC BY-NC-ND license (http://creativecommons.org/licenses/by-nc-nd/4.0/). Peer-review under responsibility of the scientific committee of the 8th Product-Service Systems across Life Cycle doi:10.1016/j.procir.2016.03.235
371
Massimo Panarotto et al. / Procedia CIRP 47 (2016) 370 – 375
rationale behind the requirements description. This phenomenon manifests as far as the system is detailed in its sub-systems and components [11]. In this way, value models provide a meaningful common denominator for all the crossfunctional specialists involved in the design process to guide early stage design decisions. A main limitation in current value modelling research [28] is the lack of factual evidence showing the ability of value-based constructs to facilitate cross-boundary discussion in the early phases of the PSS design process. 2. Objectives and hypotheses The objective of this paper is to cover the above gap by proposing an experimental approach (composed of experimental setup, metrics for assessment and coding scheme for evaluation) to quantitatively measure the effect of using value models in the analysis and synthesis phase of conceptual PSS development. Furthermore, it collects and presents the results from the experimental activities, with regards to the following hypotheses: • H1: The use of value models emphasizes activities related to the clarification of the problem domain and needs compared to traditional requirement checklists. • H2: The use of value models emphasizes activities related to the clarification of the lifecycle aspects of a solution concept compared to traditional requirements checklists. 3. Research method Experimental activities featured 6 separate sessions (design episodes) that involved a total of 22 students from the second year’s master course in mechanical engineering, industrial economy and sustainable product-service system innovation at authors’ university institution. This mix of competencies and backgrounds allowed the authors to replicate in a scaled down version those conditions faced by cross-functional teams. Students were randomly divided into teams (composed either of 3 or 4 individuals) and asked to redesign the front frame and drum of a small asphalt compactor. The challenge had a PSS orientation, with the business scenario considering a shift in ownership structure from a ‘one-sale’ model to a functional offering. In the latter customers pay proportionally for the provided functionality (i.e. compacted square metres), while the manufacturer retains ownership of the equipment and ensures availability of the function by taking care of maintenance and repair operations. In the experiment, the usage of a value model was compared against that of a requirements checklist. The value model chosen for the experiment was adapted from the COncept Design Analysis (CODA) method proposed by Eres et al. [12] and from the EVOKE approach described by Bertoni et al. [13]. These methods build on Quality Function Deployment [14], one of the most widely used tools for value modelling [15]. Design sessions were video and audio recorded. They were later analysed using protocol analysis (PA) [16], which extends the ‘think aloud’ method [17] through the use of a coding scheme based on generic models of design. Using PA it was possible for the authors to capture the designers’
behaviour as a sequence of activities, and quantify their recurrence on a temporal basis [16]. 3.1. Coding scheme Literature describes several coding schemes for PA (e.g. [16]). The authors chose an adapted version of what proposed by Sakao and others [18], which is one of the first examples of coding schemes dedicated to the analysis of a PSS design episode. The protocol is based on the PSS layer method proposed by Müller and Sakao [19], which defines nine dimensions, namely: Lifecycle activities, Customer Needs, Customer Values, Deliverables, Actors, Core Products, Periphery, Contract and Finance. In the study, five of the original dimensions were reworked to avoid inconsistency and mitigate risk of misinterpretation (see Table 1). Table 1. Final protocol adopted for the study. Dimension
Definition
Needs
Captures discussions related to the definition or clarification of customers’ and stakeholders’ needs.
Knowledge Reuse
Captures discussions related to the personal knowledge of the designers that was recalled during the experiment in order to fulfil the design task.
Design Rationale
Refers to documentation, discussions, argumentations or reasons behind decisions made when designing a system or artefact.
Engineering characteristics
Captures discussions related to structure, mechanical characteristics, technical features or materials related to the PSS hardware.
Usage Phase
Includes statements related to the operating phase of the product when the customer is physically using the artefact.
Service
Includes statements related to activities triggered by a customer’s request to benefit of the product, but that are not directly visible by the customers.
Lifecycle activities
Contains statements related to the lifecycle of the product (e.g., production, assembly, storage, transportation, dismissal), except those phases related to service and usage.
Periphery
Captures statements about support equipment, technical periphery, tools and infrastructures related to the PSS execution system.
Finance
Includes discussions about cost related aspects, either related to production, maintenance or service activities linked to the PSS.
Documentation
Captures statements related to the conceptualization, depiction and evaluation of the final sketch.
Design strategy
Captures the discussion related to how the design process goes forward, or assesses own design strategies.
Not applicable
Includes those elements not captured by the protocols above.
Customer Needs and Customer Value were grouped into Needs, as their definition was considered to be very similar by the encoders. Needs is also intended to include the discussion about the information provided to the groups, which is regarded as a behaviour aiming at clarifying the underlying needs of the forthcoming solution. Deliverables, which in the
372
Massimo Panarotto et al. / Procedia CIRP 47 (2016) 370 – 375
PSS layer method considers all activities that the PSS provider offers to the customer, were divided in Usage Phase and Service. Separating those statements referring to the customer operational process from those referring to service activities created room for a more detailed analysis of how the design team intends to ‘deliver’ value through a solution. The Lifecycle activities protocol contains statements that refer to all the remaining stages in the product lifecycle (e.g., production, assembly, storage, transportation, dismissal) apart from Usage and Service. Core Products was rephrased into Engineering Characteristics, to capture statements referring to the physical product technical aspects. Knowledge Reuse and Design Rationale were added, to analyse the impact of the different types of supports (value model vs. requirements checklist) on the design activity. Actors and Contract were neglected, mainly because they were not considered a priority in a conceptual PSS design stage, as explained by Bertoni in the protocol analysis of PSS design sessions [20]. The authors added also a Design Strategy protocol, to capture statements related to how the design team discusses methodological and procedural issues during the session. Eventually, given that students were asked to sketch and present a final concept on a standard template at the end of the experiment, the Documentation protocol was added to capture statements related to the conceptualization, depiction and evaluation of the final sketch. 4. Experiment set-up The experiment featured a 20-minute introduction, followed by a 25-minute design session where the teams were asked to reason on the given design problem and generate ideas and solution strategies. This activity was followed up by an additional 20-minute session, where the teams had the opportunity to transform their ideas into a PSS concept, and document their final design. The overall problem context was common for all teams. In order to redesign the asphalt compactor sub-systems in the new PSS business scenario, the students received during the introduction information about two previous designs for the frame and drum: the “old frame and drum” (the old, out-dated design) and an improved version, the “current frame and drum” (the As-Is design). The purpose was to stimulate students in discussing strengths and weaknesses of these two options, and from these reflections to develop and document a third concept for both sub-systems. While the overall machine architecture remained the same for both options, detailed in five main components (drum, frame, engine hood, scrapers, lights). The current design differed from the old one in terms of six engineering characteristics (such as material, geometry or lighting power) and because of the addition of new components (two video cameras directed towards the drum edge). As additional input, all teams received simplified CAD representations of the frame and drum, for both the old and the current design.
4.1. Models/supports compared Participants received further information, representing the “knowledge baseline” for the redesign activity. This information was given in the form of an assessment report (Table 2), which differed among the teams. These aimed to clarify directions for the improvement of the frame and drum. Both reports featured the same set of eight customer statements, but they differed in terms of how these needs were translated into decision criteria for the two sub-systems and how the assessment was made. Table 2. Excerpts of requirements checklist (2-a) and value model (2-b). (a) Machine requirement The machine shall be able to compact 4 square meters in one pass. The machine shall be able to compact asphalt with quality according to XYZ standard. (b) Value dimension
Component target requirement The front frame shall weight more than 800 kg
Front Frame current value 700 kg
The drum width shall be of 1000 mm The front frame shall weight less than 400 kg.
Drum current value
1000 mm
700 kg
The weight of the Drum shall be less than 200 kg.
100 kg
Value Driver
Front Frame current score
Drum current score
Compaction capacity
Square meters compacted.
8
5
Compaction quality
Quality of compacted asphalt.
3
9
Intangible value
Environmental impact
3
3
Three teams received as input information a requirement checklist (Table 2-a) following a traditional representation to guide design choices in product development [2] and PSS design [21]. The eight initial customer statements were translated into machine target requirements, which were further cascaded down to 51 target requirements for the subsystems. These included technical considerations (weight, geometry, light power) costs (manufacturing, maintenance) and new functionalities (e.g. cameras). Eventually, Table 2-a displays the value of such requirements for the “current frame and drum” components. In this way, the team could assess how close the As-Is design was from the target requirements. The remaining three groups received input information in the form of a value model (Table 2-b). While different approaches for value modelling exist, most models liken a scoring table that ranks a design along a set of attributes [15]. One of the differences of a value model compared to a requirements checklist is argued to lie in the attributes used to guide the decision process [22]. In the value model the assessment criteria shall balance technical aspects, cost as well as business and lifecycle-related aspects, such as upgradeability, recycling opportunities and timeliness.
373
Massimo Panarotto et al. / Procedia CIRP 47 (2016) 370 – 375 Table 3. Percentage of total time spent on each PSS dimension. Groups Average Dimension
Value Model
Requirements checklist
Needs
29.02%
Knowledge Reuse
2.01%
Value Model Teams
Requirements checklist Teams
Difference
Group 1
Group 2
Group 3
Group 4
Group 5
Group 6
22.59%
6.44%
17.45%
35.08%
34.54%
36.76%
15.55%
15.46%
4.13%
-2.12%
2.98%
0.10%
2.95%
1.60%
7.88%
2.90%
Design Rationale
2.43%
2.59%
-0.16%
0.76%
3.17%
3.37%
3.02%
3.74%
1.02%
Engineering characteristics
23.26%
32.62%
-9.35%
26.66%
24.98%
18.15%
21.62%
36.33%
39.90%
Usage Phase
8.20%
9.13%
-0.93%
12.57%
1.77%
10.27%
4.66%
14.09%
8.64%
Service
1.74%
0.55%
1.20%
1.42%
1.27%
2.53%
0.00%
0.32%
1.31%
Lifecycle activities
1.30%
1.15%
0.16%
0.00%
1.66%
2.26%
1.15%
0.00%
2.30% 0.42%
Periphery
0.95%
0.37%
0.58%
1.34%
0.00%
1.51%
0.00%
0.69%
Finance
3.70%
1.44%
2.26%
0.86%
3.67%
6.58%
3.83%
0.49%
0.00%
Documentation
11.06%
13.95%
-2.89%
19.92%
7.26%
6.00%
18.46%
13.61%
9.80%
Design strategy
6.48%
3.61%
2.86%
5.10%
9.51%
4.82%
3.04%
0.48%
7.32%
Not applicable
9.84%
7.87%
1.97%
10.94%
11.53%
7.04%
5.86%
6.82%
10.94%
In the report, the initial customer statements where translated into machine-level ‘value dimensions’ following a 1:1 correlation. These dimensions were cascaded down to 16 ‘value drivers’, following the definition described by Isaksson et al. [11]. These ‘value drivers’ balanced aspects related to operational performances (e.g. square meter compacted) operational efficiency (e.g. manoeuvrability, visibility during day and night), changes in infrastructure (e.g. adaptability to future developments) and intangible values (e.g. brand acknowledgement, environmental impact). The value contribution of the ‘current frame and drum’ was assessed by the authors taking the ‘old frame and drum’ as baseline, using a one to nine scale. A score between six and nine meant that the current design was found to be more value adding than the baseline. A score between one and four meant it was less value adding. A score of five meant that no difference was found between the two. Notably, both assessment reports gave information about design trade-offs. This means that the improvement of one design property (e.g. the weight of the frame) would lead to worsening other properties in the model. 5. Evaluation metrics The shift toward PSS requires design teams to look for more innovative designs by emphasizing activities related to the clarification of the problem domain and needs in the early stages of design. Being able to clarify the boundaries and conditions of the problem is advocated to reduce rework in the later phases of the process [23] because this improves understanding of design trade-offs and mitigate the risk for engineers to focus on local sub-optimal solutions [24]. Under these premises, an effective boundary object should mitigate the tendency of ‘jumping into’ solutions too early. Rather, it should stimulate a more thoughtful working mode among the cross-functional team, where needs and expectations are
clarified, objectives negotiated and ‘softer’ aspects of value balanced with more tangible dimensions. Caring about the problem domain has consequences in the way PSS design concepts are later defined. Rather than focusing on aspects familiar to their domain (e.g. technical performances), PSS designers are expected then to become more open towards considering in their work aspects outside their disciplinary horizon, which is touching on all the different lifecycle aspects of the product. [7,25]. In order to observe such a behaviour, each session was divided into quarters. The percentage of time spent on the different protocols was used as proxy to verify both hypothesis H1 and H2. An increase in total time spent discussing needs in the first half of the experiment was identified as success criterion for H1. Furthermore, an increase in total time spent discussing lifecycle dimension aspects (rather than the engineering characteristics of a solution) during the second half of the experiment was identified as success criterion for H2. 6. Data analysis The experiments were transcribed and coded separately by two encoders. The agreement in the first round of coding was 58.8%. This result suggested a redefinition of the PSS dimensions adopted in the coding scheme. The results and the PSS dimensions presented in the paper (see Table 1) represent the output of the second coding iteration. 6.1. Averages and deviations for the entire experiment Firstly, the analysis focused on the total time spent on each dimension during the experiment. Table 3 displays the averages for the value model and requirements teams, as well as the results for all the groups, highlighting the difference in behaviour between teams. The teams using the value model spent on average around 6.5% more of the total time in
374
Massimo Panarotto et al. / Procedia CIRP 47 (2016) 370 – 375
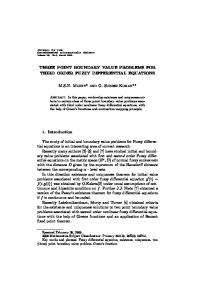
discussing the problem context and related needs. At the same time, the teams spent on average 9.35% less time on elaborating on the engineering characteristics related to the PSS hardware. At the same time, teams using the value model have been observed to spend more time in discussing service (+1.20%) and financial (+2.26%) aspects of the solution. The maximum standard deviation between the value model teams was 10.2%, while for the requirements teams was 12.28%. The maximum standard deviation between the value model teams was 0.83%, while for the requirements teams was 0.69%. 6.2. Designers’ behaviour along the timeline The analysis along the 4 quarters of the experiment details the differences in behaviour generated by the two assessment reports, in terms of time spent in the different protocols (Figure 1).
Notably, Figure 1 does not include the Documentation and Design Strategy codes, mainly because they are not considered relevant to answer H1 and H2. Also, for visualization purposes Service, Lifecycle Activities and Periphery are grouped into Service system. Overall, teams using the value model spent on average more time discussing Needs and Service system during the design episode. Teams using the requirements checklist have shown instead a stronger focus on the Engineering Characteristics of the solution in all stages of the experiment. In the first quarter, the analysis reveals that teams using the value model spent more time on the analysis of the problem domain than the teams using the requirements list (+6.30%). On the contrary, teams using requirement checklists initiated the session by focusing more on the engineering characteristics of potential solutions, as well as on hardware usage. No significant difference is observed for Service system, while aspects related to Finance were more discussed by the teams using the value model. A similar pattern is observed in the second quarter. The value model teams maintained a stronger orientation towards discussing Needs, and addressed with more emphasis aspects related to Service system compared with the counterpart. The latter is observed to switch the focus even more from problem to solutions: the requirement checklist seems to have pushed the teams towards elaborating on the hardware aspects (+ 19.20%). In the third quarter, teams using the value model show an increased attention towards the Engineering Characteristics and Usage phase of their solutions. On the other end, detailing the features of the physical hardware becomes a dominant activity for the requirements checklist teams, covering more than 40% of the total time in the discussion. No substantial differences along other dimensions are observed. In the last quarter, teams using the requirements checklist reduced their focus on Engineering Characteristics and rather discuss Needs with more intensity. Also teams using the value model faded slightly away from discussing hardware matters. Notably, in these subjects a more varied discussion is observed, encompassing Usage phase, Service system and Finance in similar proportions. 7. Discussion about the method
Fig. 1. Time (in percentage) spent on each PSS dimension along the timeline.
The experiments were conducted in an artificial setting (students in a university environment) and not with practitioners in a real industrial environment. Although the latter would have been a preferable scenario, the sample – designers in the last year of Master in three different engineering programs – is still considered relevant for the purpose of the study. Literature shows that a large fraction of research experiments testing new tools and methods are conducted in artificial settings [26]. Furthermore, research shows that Master students are advanced beginners [27], who understand how to design and take situational factors into account. In addition, they are educated to meet similar boundary conditions (intensity of teamwork, limitations in the knowledge base, deadlines) and problem statements near to
Massimo Panarotto et al. / Procedia CIRP 47 (2016) 370 – 375
those met by practitioners [20]. These considerations mitigate drawbacks related to the generalization of the results. 8. Conclusions The experimental results indicate that teams using the value model had a more intense discussion about needs and expectations in the first half of the experiment, while keeping the discussion on detailed engineering characteristics to a moderately low level. On the contrary, the requirements checklist makes designers to ‘jump into’ technical concerns early in the design activity, and only marginally stimulates discussions concerning the problem domain. These observations support hypothesis H1. Furthermore, during the second half of the experiment, teams using the value model have spent more time (compared to the team using the checklist) on discussing aspects related to overall systems performance and economics, rather than only focusing on the engineering characteristics and on the usage of the hardware. Such observations support hypothesis H2. Both results indicate that value models have the ability to facilitate crossboundary discussion in the early phases of the PSS design process, and to act as boundary object that provides a common platform for knowledge sharing in the crossfunctional team. Future work will continue with the experimental verification of the use of value models in the early phases of PSS design. The analysis will focus on what types of conversations would be triggered if the teams would have the opportunity to interact with the value model, visualizing in real time the impact of their design proposals on the entire spectrum of value drivers. Quantitative analysis of the protocols will also be complemented with ethnographic studies to better understand the nature and the underlying reasons for extreme behaviours in the design episode. Acknowledgements The research leading to these results has received financial support by the Swedish Knowledge and Competence Development Foundation (Stiftelsen för kunskaps- och kompetensutveckling) through the Model Driven Development and Decision Support research profile at Blekinge Institute of Technology.
References [1] McAloone TC. Boundary conditions for a new type of design task: understanding product/service-systems. In: Birkhofer H, editor. The future of design methodology. London: Springer; 2011. p.113-124. [2] Ulrich K, Eppinger S. Product design and development. 5th ed. Irwin: McGraw-Hill; 2011. [3] Morelli N. Developing new product service systems (PSS): methodologies and operational tools. J Clean Prod 2006;14(17): 1495-1501. [4] Voigt BF. Coping with the Challenges of a Heterogeneous Working Context–A Configuration of Individual Competencies for PSS Workers. Procedia CIRP 2015;30:402-7. [5] Cedergren S I, Elfving S W, Eriksson J, Parida V. A road map for future research on industrial product-service systems (IPS2): a systematic review. In: Shimomura Y, Kimita K, editors. The Philosopher's Stone for Sustainability; 2013. Springer Berlin Heidelberg. p. 185-190. [6] Chirumalla K, Bertoni A, Ericson A, Isaksson O. Knowledge-sharing network for product-service system development: Is it atypical?. In:
375
Shimomura Y, Kimita K, editors. The Philosopher's Stone for Sustainability; 2013. Springer Berlin Heidelberg. p. 109-114. [7] Isaksson O, Larsson TC, Rönnbäck AÖ. Development of product-service systems: challenges and opportunities for the manufacturing firm. J Eng Design 2009;20(4):329-348. [8] Bertoni A, Bertoni M, Panarotto M, Johansson C, Larsson T. Expanding Value Driven Design to meet Lean Product Service Development. Procedia CIRP 2015;31;30: p.197-202. [9] Bertoni M, Panarotto M, Larsson T. Boundary objects for PSS design. Procedia CIRP; 2016. [10] Star SL, Griesemer JR. Institutional ecology,translations' and boundary objects: Amateurs and professionals in Berkeley's Museum of Vertebrate Zoology, 1907-39. Soc Stud Sci 1989;19(3):387-420. [11] Isaksson O, Kossmann K, Bertoni M, Eres H, Monceaux A, Bertoni A, Wiseall S, Zhang X (2013) Value Driven Design: A methodology To Link Expectations To Technical Requirements in the extended enterprise. In: INCOSE Symposium 2013, 23;1: p. 803-819. [12] Eres MH, Bertoni M, Kossmann M, Scanlan J. Mapping customer needs to engineering characteristics: an aerospace perspective for conceptual design. J Eng Design 2014;25(1-3):64-87. [13] Bertoni M, Bertoni A, Isaksson O, Amnell H, Johansson C. Valueoriented concept selection in aero-engine sub-systems design: the EVOKE approach. In: INCOSE International Symposium 2013; 23; 1: p. 770-784. [14] Akao Y. Quality Function Deployment: Integrating Customer Requirements into Product Design. Cambridge: Productivity Press; 1990. [15] Collopy PD. Aerospace system value models: A survey and observations. AIAA Paper 2009; 6560: 2009. [16] Gero JS, Mc Neill T. An approach to the analysis of design protocols. Des Stud 1998;19(1):21-61. [17] Ericsson KA, Simon HA. Protocol Analysis Verbal Reports as Data. Cambridge: MIT Press; 1993. [18] Sakao T, Paulsson S, Mizuyama H. Inside a PSS design process: insights through protocol analysis. In: Proc. of 18th International Conference on Engineering Design. Lyngby/Copenhagen, Denmark: 2011. [19] Müller P, Kebir N, Stark R, Blessing L. PSS layer method–application to microenergy systems. In: Sakao T, Lindhal M, editors. Introduction to product/service-system design. London: Springer; 2009. p. 3-30. [20] Bertoni A. Analyzing Product-Service Systems conceptual design: The effect of color-coded 3D representation. Des Stud 2013;34(6): 763-793. [21] Müller P, Schulz F, Stark R. Guideline to elicit requirements on industrial product-service systems. In: Proc. of 2nd CIRP International Conference on Industrial Product/Service Systems, Linkoping, Sweden. 2010. p. 109-116. [22] Bertoni M, Eres H, Isaksson O. Criteria for assessing the value of Product Service System design alternatives: an aerospace investigation. In: Hesselbach J, Hermann C, editors. Functional thinking for value creation; 2011. Springer Berlin Heidelberg. p. 141-146. [23] Maussang N, Zwolinski P, Brissaud D. Product-service system design methodology: from the PSS architecture design to the products specifications. J Eng Design 2009; 20(4): 349-366. [24] Monceaux A, Kossman M, Wiseall S, Bertoni M, Isaksson O, Bertoni A, Ndrianarilala R. Overview of Value Driven Design Research: Methods, Applications and Relevance for Conceptual Design. INCOSE INSIGHT 2014; 17;4: p. 37-39. [25] Isaksson O, Larsson TC, Johansson P. Towards a framework for developing product/service systems. In: Hesselbach J, Hermann C, editors. Functional thinking for value creation; 2011. Springer Berlin Heidelberg. p. 44-49. [26] Ellis G, Dix A. An explorative analysis of user evaluation studies in information visualisation. In: Proc. of 2006 AVI workshop on BEyond time and errors: novel evaluation methods for information visualization; 2006. p. 1-7. [27] Kleinsmann M, Deken F, Dong A, Lauche K. Development of design collaboration skills. J Eng Design 2012;23(7):485-506. [28] Soban D, Hollingsworth P, Price M. Defining a research agenda in Value Driven Design: Questions that need to be asked. In: Proc. of 2nd International Air Transport and Operations Symposium 2011;29:372382.