Experiments in Evaluating. Interactive Spoken Language Systems 1. Joseph Polifroni, Lynette Hirschman, Stephanie Seneff, and Victor Zue. Spoken Language ...
Experiments in Evaluating Interactive Spoken Language Systems 1 Joseph Polifroni, Lynette Hirschman, Stephanie Seneff, and Victor Zue Spoken LanguageSystems Group Laboratory for Computer Science M a s s a c h u s e t t s I n s t i t u t e of T e c h n o l o g y Cambridge, Massachusetts 02139
ABSTRACT As the DARPA spoken language community moves towards developing useful systems for interactive problem solving, we must explore alternative evaluation procedures that measure whether these systems aid people in solving problems within the task domain. In this paper, we describe several experiments exploring new evaluation procedures. To look at end-to-end evaluation, we modified our data collection procedure slightly in order to experiment with several objective task completion measures. We found that the task completion time is well correlated with the number of queries used. We also explored log file evaluation, where evaluators were asked to judge the clarity of the query and the correctness of the response based on examination of the log file. Our results show that seven evaluators were unanimous on more than 80% of the queries, and that at least 6 out of 7 evaluators agreed over 90% of the time. Finally, we applied these new procedures to compare two systems, one system requiring a complete parse and the other using the more flexible robust parsing mechanism. We found that these metrics could distinguish between these systems: there were significant differences in ability to complete the task, number of queries required to complete the task, and score (as computed through a log file evaluation) between the robust and the non-robust modes.
INTRODUCTION For the first two years of the DARPA Spoken Language Program, common evaluation in the ATIS d o m a i n has been performed solely with the C o m m o n Answer Specification (CAS) protocol [4], whereby a system's performance is determined by comparing its output, expressed as a set of database tuples, with one or more predetermined reference answers [1]. The CAS protocol has the advantage that system evaluation can be carried out automatically, once the principles for generating the reference answers have been established and a corpus has been annotated accordingly. Since direct comparison across systems can be performed relatively easily with this procedure, we have been able to achieve cross fertilization of research ideas, leading to rapid research progress. 1This research was s u p p o r t e d by D A R P A u n d e r Contract N000] 4-89-J-1332, monitored t h r o u g h the Office of Naval Research.
28
QUERY 1:
PLEASE LIST THE FLIGHT FROM PITTSBURGH TO BALTIMORE THAT WILL HE MADE BY SIX SEAT AIRPLANE ON JUNE TWENTIETH RESPONSE I: There are no flights from pittsburgh to Baltimore leaving before 6:00 a.m. on Saturday June 20. QUERY 2:
LIST THE NUMBER OF FIRST CLASS FLIGHTS AVAILABLE ON DELTA AIRLINES RESPONSE 2: 279
Table 1: Two examples of queries from the February '92 Evaluation for which the CAS evaluation gives a misleading assessment of the system's ability to understand. However, CAS evaluation is not without its share of shortcomings. One unfortunate outcome of evaluating systems based on answers retrieved from the flight database is t h a t we cannot separately assess the system's understanding of the query from its ability to retrieve the correct information and to conform to the prescribed output format. In the best case, researchers may end up spending a considerable amount of time worrying about the form and substance of the answer, which has little to do with language understanding. In the worst case, the results of the evaluation m a y be down right misleading. Consider the two examples from the February 1992 test-set shown in Figure 1. For Query 1, the system misunderstood the phrase "by six" as meaning "before 6:00 a.m." Nonetheless, the answer is judged correct, because b o t h the hypothesized and reference answers are the NULL set, i.e., no flights satisfy the set of constraints. For Query 2, the system found 279 flights, but the correct answer is 278. The erroneous extra flight is the one connecting flight in the database shared by two airlines, Delta and USAIR. Another shortcoming of the present evaluation procedure is t h a t it has no place for interactive dialogue. In a realistic application, the user and the computer are often partners in problem solving, in which the final solution may be best obtained by allowing b o t h sides to take the initiative in the conversation. Since the hu-
m a n / c o m p u t e r dialogue can vary widely from system to system, it is impossible to use the data collected from one system to evaluate another system without making available the computer's half of the conversation. Even then, the system being tested becomes an observer analyzing two sides of a conversation rather than a participant. To be sure, the current evaluation protocol has served the community well. The refinements made during the last year have significantly improved its ability to provide an objective benchmark. However, as we continue to press forward in developing useful spoken language systems that can help us solve problems, we must correspondingly expand the battery of evaluation protocols to measure the effectiveness of these systems in accomplishing specific tasks. At the March 1991 meeting of the SLS Coordinating Committee, a working group was formed with the specific goal of exploring methodologies that will help us evaluate if, and how welt, a spoken language system accomplishes its task in the ATIS domain. The consensus of the working group was that, while we may not have a clear idea about how to evaluate overall system performance, it is appropriate to conduct experiments in order to gain experience. The purpose of this paper is to describe three experiments conducted at MIT over the past few months related to this issue. These experiments explored a number of objective and subjective evaluation metrics, and found some of them to be potentially helpful in determining overall system performance and usefulness.
END-TO-END
EVALUATION
In order to carry out end-to-end evaluation, i.e., evaluation of overall task completion effectiveness, we must be able to determine precisely the task being solved, the correct answer(s), and when t h e s u b j e c t is done. Once these factors have been specified, we can then compute some candidate measures and see if any of them are appropriate for characterizing end-to-end system performance. While true measures of system performance will require a (near) real-time spoken language system, we felt that some preliminary experiments could be conducted within the context of our ATIS data collection effort [3,2]. In our data collection paradigm, a typist types in the subject's queries verbatim, after removing disfluencies. All subsequent processing is done automatically by the system. To collect data for end-to-end evaluation, we modified our standard data collection procedure slightly, by adding a specific scenario which has a unique answer. For this scenario, the subjects were asked to report the answer explicitly. As a preliminary experiment, we used two simple scenarios. In one of them, subjects were asked to determine 29
II Measurements
I[ Mean [Std. Dev. I[ Total ~ of Queries Used 4.8 1.6 # of Queries with Error Messages 1.0 1.4 Time to Completion (S.) 166.1 66.0 Table 2: Objective end-to-end measures.
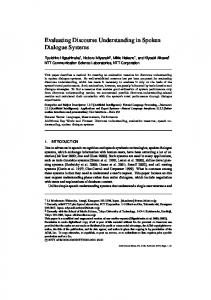
the type of aircraft used on a flight from Philadelphia to Denver that makes a stop in Atlanta and serves breakfast. Subjects were asked to end the scenario by saying "End scenario. The answer is" followed by a statement of the answer, e.g., "End scenario. The answer is Boeing 727." From the log files associated with the session scenario, we computed a number of objective measures, including the success of task completion, task completion time, the number of successful and the number of unsuccessful queries (producing a "no answer" message) 2. We collected data from 29 subjects and analyzed the data from 24 subjects 3. All subjects were able to complete the task, and statistics on some of the objective measures are shown in Table 2. Figure 1 displays scatter plots of the number of queries used by each subject as a function of the task completion time. A least-square fit of the data is superimposed. The number of queries used is well correlated with the task completion time (R = 0.84), suggesting that this measure may be appropriate for quantifying the usefulness of systems, at least within the context of our experiment. Also plotted are the number of queries that generated a "no answer" message. The correlation of this measure with task completion time is not as good (R = 0.66), possibly due to subjects' different problem solving strategies and abilities.
LOG FILE EVALUATION We also conducted a different set of experiments to explore subject-based evaluation metrics. Specifically, we extracted from the log files pairs of subject queries and system responses in sequence, and asked evaluators to judge the clarity of the query (i.e., clear, unclear, or unintelligible) and the correctness of the response (correct, partially correct, incorrect, or "system generated an error message"). A program was written to enable evaluators to enter their answers on-line, and the results were tabulated automatically. We used seven evaluators for this experiment, all people from within our group. Four people had detailed knowledge of the system and the desig2The s y s t e m generates a range of diagnostic messages, r e p o r t i n g t h a t it cannot parse, or t h a t it c a n n o t formulate a retrieval query, etc. 3 D a t a f r o m the remaining s u b j e c t s were n o t analyzed, since they have b e e n designated by N I S T as test material.
Experimental
10'
• # of q u e r i e s n # of e r r o r m e s s a g e s
• lid
•
••
@11
[]
2, •
f ' . : 200
i00
. 300
. 400
Time to Completion
Figure 1: Relationship beween task completion time and the total number of queries used, and the number of queries that generated a "no answer" message. nated correct reference answers. Three of the evaluators were familiar with the ATIS system capabilities, but did not have a detailed knowledge of what constituted a correct reference answer for the comparator. Our anedyses, based on data from 7 evaluators, indicate that 82% of the time there was unanimous agreement among the evaluators, and there were 1 or fewer disagreements 92% of the time.
ii! A2°: 0
I
2
3
4
Number of Evaluators Who Disagree
Figure 2: Consistency of the 7 evaluators' answers during log file evaluation. The data are based on 115 query/answer pairs. These results suggest that reasonable agreement is possible using humans to evaluate log files. Such on-line evaluation is also quite cost effective; the evaluators were each able to check the 115 query/answer pairs in 30-45 minutes.
SYSTEM COMPARISON EXPERIMENT Building on the results of the pilot experiments on end-to-end and log file evaluation, we designed an experiment to test whether these metrics would be useful in distinguishing the performance of two systems on a more complex set of tasks. 30
Design
We decided to compare the performance of two MIT systems: the "full parse" system and the "robust parse" system [5]. These two systems contrast a conservative approach that only answers when it is confident (the full parse system) against a more aggressive approach that is willing to make mistakes by answering much more often, based on partial understanding (the robust parse system). These systems had very measurably different performance in terms of the CAS metric, and our hypothesis was that the metrics would show that the robust-parsing system outperformed the full-parsing system. To try to capture a broader range of user behavior, we decided to vary the difficulty of the scenarios; we used two pairs of scenarios, where each pair consist of an "easy" scenario followed by a "hard" scenario. The scenarios were chosen to have a single correct answer. The easy scenarios were scenarios adapted from our previous data collection and could be solved with around three queries. The more difficult scenarios were constructed to require more queries (10-15) to solve them. The four scenarios are shown in Table 3. The experiment used a within-subject design, with each subject using both systems. In order to neutralize the effects of the individual scenarios and the order of scenarios, all subjects were presented with the same scenarios, in the same order. We alternated sessions in which the robust parser was used for scenarios one and two with sessions in which the robust parser was used for scenarios three and four. Subjects were given no prior training or warm-up exercises. As of this writing, we have collected data from fifteen subjects. Eight of these subjects used a version of the system with the robust parser turned on for the first two scenarios and turned off for the second two; seven used the opposite configuration of full-parsing followed by robust parsing. All but two of the subjects had not used the system before. We used our standard subject instructions, slightly modified to inform the subject that s/he would be using two distinct systems. The subjects were drawn from the same pool as in our previous data collection efforts, namely MIT students and Staff. Each subject was given a $10 gift certificate for a local store. The subjects were not given any special incentive for getting correct answers, nor were they told that they would be timed. Each subject was asked to fill out a version of our debriefing questionnaire, slightly modified to include a specific question asking the subject which system s/he had preferred. We found that writing the scenarios was tricky, and we had to iterate several times on the wording of the scenario descriptions; in particular, we found that it was difficult to elicit the desired answer. Even when we altered the instructions to remind the subjects of what
1. Find a flight from Philadelphia to Dallas that makes a stop in Atlanta. The flight should serve breakfast. Identify the type of aircraft that is used on the flight to Dallas. (Information requested: aircraft type) 2. You want to fly from Boston to San Francisco on the last weekend in April (Saturday, April 25 or Sunday, April 26). You'd like to return to Boston on the following Wednesday in the evening, if possible. Your main concern is that all flights be on Continental since you are trying to maximize your frequent flyer miles. Identify one flight in each direction (by number) that you can take. (Information requested: flight number) 3. Find a flight from Atlanta to Baltimore. The flight should be on a Boeing 757 and arrive around 7:00 P.M. Identify the flight (by number) and what meal is served on this flight. (Information requested: flight number, meal type) 4. You live in Pittsburgh. You want to combine a vacation trip to Atlanta with business and take a friend along. You will receive a fixed travel allowance, based on a first-class ticket. Identify a coach class fare (dollar amount) that comes closest to allowing you to cover the expenses of both you and your friend based on the regular first class fare. Choose a date within the next seven days and make sure the fare does not have a restriction that disallows this. (Information requested: fare amount (in dollars) for coach class fare) Table 3: The four scenarios used by subjects in the second MIT end-to-end experiment.
kind of answer they should provide, subjects did not always read or follow the scenarios carefully. We wanted to avoid prompting the subjects with phrases that we knew the system understood. We therefore tried to word the scenarios in such a way that subjects would not be able to read from their instructions verbatim and obtain a response from the system. We also wanted to see what problem-solving strategies subjects would use when various options were presented to them, only one of which could solve their scenario. In Scenario 2, for example, there are no Continental flights on the Saturday or Wednesday evening in question. There are, however, Continental flights on Sunday and on Wednesday during the day. Results
and
Analyses
From the collected data, we made a number of measurements for each scenario, and examined how the two systems differed in terms of these measures. The measurements that we computed are: • Scenario completion time; • Existence of a reported solution; • Correctness of the reported solution; • Number of queries; • Number of queries answered; number resulting in a "no answer" message from the system; • Logfile evaluation metrics, including queries judged to be correctly answered, incorrectly answered, partially correct, and out of domain(class X); also score, defined as % Correct - % Incorrect; • User satisfaction from debriefing questionnaire.
Table 4 summarizes some of the results comparing the two systems across all scenarios. For the remainder of this section, we will try to analyze these results and reach some tentative conclusions. 31
Task Completion The first column of Table 4 shows that the subjects were able to provide an answer in allthe scenarios when the system was in robust mode, whereas only 83% of the scenarios were completed in non-robust mode. Interestingly, a detailed examination of the data shows that, for the 5 cases in the non-robust mode when users gave up, there was never an incorrectly answered query, but the number of unanswered queries was extremely high. From a problem-solving standpoint, we can tentatively conclude that a system that takes chances and answers more queries seems to be more successful than a more conservative one. Finding the Correct Solution Our experimental paradigm allowed us to determine automatically, by processing the log files, whether the subject solved the scenario correctly, incorrectly, or not at all. A much larger percentage of the scenarios were correctly answered with the robust system than with the non-robust system (90% vs. 70%). Measured in terms of the percent of scenarios correctly solved, the robust system outperformed the non-robust system in all scenarios. Task Completion Time The task completion time is summarized in the third column of Table 4. The results are somewhat inconclusive, due to a number of factors. Although we were interested in assessing how long it took to solve a scenario, we did not inform our subjects of this. In part, this was because we didn't want to add more stress to the situation. More than one subject inexplicably cleared the history after having nearly solved the scenario, and then essentially repeated, sometimes verbatim, the same series of questions. Had they thought there was a time constraint, they probably would not have done this. We suspect that because subjects were not encouraged to proceed quickly, it is difficult to draw any conclusions from the results on time-to-completion. Another insidious factor was background network traffic and machine load, factors that would contribute to variations in time-to-completion which we did not control for
[
Scenario Number 1 1 2 2 3 3
4 4 All ALl
System Robust Full Robust Full Robust Full Robust Full Robust FuU
% of Scenarios Solution [ Completion Number of % of Queries % of Queries Incorrect Queries Correct w/Solution Correct [ Time(s) 215 4.4 94 0 100 100 215 4.7 70 0 86 71 478 8.6 66 25 100 88 483 10.6 39 4 86 86 199 4.4 82 15 100 100 376 8.0 42 0 88 88 719 11.7 71 22 100 71 643 9.8 51 0 75 38 75 18 100 90 399 7.2 48 1 83 70 434 8.3
% of Queries ] DARPA No Answer ] Score 6 94 30 70 8 41 56 35 3 68 58 42 6 49 49 51 6 57 51 47
Table 4: Mean metrics for robust and full parse systems, shown by scenario
in these experiments. The next column of the same table shows the average number of queries for each scenario. Since these numbers appear to be well correlated with task completion time, they suffer from some of the same deficiencies. Log File Score In order to measure the number of queries correctly answered by the system, two system developers independently examined each query/answer pair and judged the answer as correct, partially correct, incorrect, or unanswered, based on the evaluation program developed for the logfile evaluation. The system developers were in complete agreement 92% of the time. T h e cases of disagreement were examined to reach a compromise rating. This provided a quick and reasonably accurate way to assess whether the subjects received the information they asked for. The percentages of queries correctly answered, incorrectly answered, and unanswered, and the resulting DARPA score (i.e., % correct - % incorrect) are shown in the last four columns of Table 4. Although not shown in Table 4, the overall ratio of correctly answered queries to those producing no answer was an order of magnitude higher for the robust parser (148:13) than for the non-robust parser (118:125). This was associated with an order-of-magnitude increase in the number of incorrect answers: 32 vs. 3 for the non-robust parser. However, the percentage of "no answer" queries seemed to be more critical in determining whether a subject succeeded with a scenario than the percentage of incorrect queries. Debriefing Questionnaire Each subject received a debriefing questionnaire, which included a question asking for a comparison of the two systems used. Unfortunately, data were not obtained from the first five subjects. Of the ten subjects that responded, five preferred the robust system, one preferred the non-robust system, and the remaining ones expressed no preference. Difficulty of Scenarios There was considerable variability among the scenarios in terms of difficulty. Scenario 4 turned out to be by far the most difficult one to 32
solve, with only a little over half of the sessions being successfully completed 4. Subjects were asked to "choose a date within the next week" and to be sure t h a t the restrictions on their fare were acceptable. We intentionally did not expand the system to understand the phrase "within the next week" to mean "no seven-day advance purchase requirement," but instead required the user to determine t h a t information through some other means. Also in Scenario 4, there were no available first class fares that would exactly cover two coach class fares. Scenarios 2 and 4 were intended to be more difficult than 1 and 3, and indeed they collectively had a substantially lower percentage of correct query answers t h a n the other two scenarios, reflecting the fact t h a t subjects were groping for ways to ask for information that the system would be able to interpret. There was a wide variation across subjects in their ability to solve a given scenario, and in fact, subjects deviated substantially from our expectations. Several subjects did not read the instructions carefully and ignored or misinterpreted key restrictions in the scenario. For instance, one subject thought the "within the next week" requirement in Scenario 4 meant t h a t he should return within a week of his departure. Some subjects had a weak knowledge of air travel; one subject assumed that the return trip would be on the same flight as the forward leg, an assumption which caused considerable confusion for the system. The full parser and robust parser showed different strengths and weaknesses in specific scenarios. For example, in Scenario 3, the full parser often could not parse the expression "Boeing 757", but the robust parser had no trouble. This accounts in part for the large "win" of the robust parser in this scenario. Conversely, in Scenario 4, the robust parser misinterpreted expressions of the type "about two hundred dollars", treating "about two" as a time expression. This led the conversation badly astray in these cases, and perhaps accounts for the 4The other three scenarios were solved successfully on average nearly 90% of the time.
fact that subjects took more time solving the scenario in robust mode. The lesson here is that different scenarios may find different holes in the systems under comparison, thus making the comparison extremely sensitive to the exact choice and wording of the scenarios.
designated task in most cases, and that we can define objective metrics, including time to task completion, number of queries, and number of system non-responses. In addition, these metrics appear to be correlated. To assess correctness of system response, we have shown that evaluators can produce better than 90% agreement evalPerformance Comparison The robust parser performed uating the correctness of response based on examination better than the non-robust parser on all measures for all of query/answer pairs from the log file. We have imscenarios except in Scenario 4. In Scenario 4, the perplemented an interactive tool to support this evaluation, centage of sessions resulting in a correct solution favored and have used it in two separate experiments. Finally, robust parsing by a large margin (71% vs. 38%), but we demonstrated the utility of these metrics in characthe robust parser had a longer time to completion and terizing two systems. There was good correspondence more queries to completion than the non-robust system, between how effective the system was in helping the user as well as a worse DARPA score (51% to 49%). The roarrive at a correct answer for a given task, and metrics bust parser gave a greater percentage of correct answers such as time to task completion, number of queries, and (71% vs. 51%), but its incorrect answers were signifpercent of correctly answered queries (based on log file icant enough (22% to 0%) to reverse the outcome for evaluation). These metrics also indicated that system the DARPA score. Thus DARPA score seems to be corbehavior may not be uniform over a range of scenarios related with time to completion, but percent of correct - the robust parsing system performed better on three answers seems to be correlated with getting a correct soscenarios, but had a worse DARPA score on the fourth lution. (and probably most difficult) scenario. Based on these experiments, we believe that these metrics provide the We feel that the data for Scenario 4, when used t o basis for evaluating spoken language systems in a realismake comparisons between the robust and non-robust tic interactive problem solving context. parser, are anomalous for several reasons. The scenario itself confused subjects, some of whom incorrectly assumed that the correct fare was one which was exactly ACKNOWLEDGEMENTS one-half of the first class fare. Furthermore, fare restric.~Ve would like to thank several people who made sigtions are not as familiar to subjects as we previously asnificant contributions to this work. David Goodine desumed, leading to lengthy interactions with the system. signed and implemented the interactive log file evaluaThese difficulties led to differences in performance across tion interface which greatly facilitated running the log systems that we feel are not necessarily linked directly to file evaluation experiments. Christie Winterton recruited the systems themselves but rather to the nature of the the subjects for the various data collection experiments scenario being solved. In summary, our data show the and served as the wizard/transcriber for many of the subfollowing salient trends: jects in our end-to-end evaluation experiment. We would 1. Subjects were always able to complete the scenario for the robust system. 2. Successful task completion distinguished the two systems: full parse system succeeded 70% of the time, compared with 90% for the robust system. 3. Percent of correctly answered queries followed the same trend as completion time and number of overall queries; these may provide a rough measure of task difficulty. 4. Scores for the performance on individual queries were not necessarily consistent with overall success in solving the problem. 5. Users expressed a preference for the robust system.
CONCLUSIONS The results of these experiments are very encouraging. We believe that it is possible to define metrics that measure the performance of interactive systems in the context of interactive problem solving. We have had considerable success in designing end-to-end task completion tests. We have shown that it is possible to design such scenarios, that the subjects can successfullyperform the 33
also like to thank Nancy Daly, James Glass, Rob Kassel and Victoria Palay for serving as evaluators in the log file evaluation.
REFERENCES [1] Bates, M., Boisen, S., and Makhoul, J., "Developing an Evaluation Methodology for Spoken Language Systems," Proc. DARPA Speech and Natural Language Workshop, pp. 102-108, June, 1990. [2] MADCOW, "Multi-Site Data Collection for a Spoken Language Corpus," MADCOW, These Proceedings. [3] Polifroni, J. Seneff, S., and Zue, V., "Collection of Spontaneous Speech for the sc Atis Domain and Comparative Analyses of Data Collected at MIT and TI," Proc. DARPA Speech and Natural Language Workshop, pp.360-365, February 1991. [4] Ramshaw, L. A. and S. Boisen, "An SLS Answer Comparator," SLS Note 7, BBN Systems and Technologies Corporation, Cambridge, MA, May 1990. [5] Seneff, S., "A Relaxation Method for Understanding Spontaneous Speech Utterances," These Proceedings.