Explanatory Modeling in Science through Text-based Investigation: Testing the Efficacy of the Project READI Intervention Approach
Susan R. Goldman1, Cynthia Greenleaf 2, Mariya Yukhymenko-Lescroart1,4 with Willard Brown2, Mon – Lin Monica Ko1, Julia M. Emig1,5, MariAnne George1, Patricia Wallace3, Dylan Blaum3, M. Anne Britt3, and Project READI.
Project READI: Kimberly Lawless1, James Pellegrino1, Gayle Cribb2, Thomas Hanson2, Katie James1, Candice Burkett1, Angela Fortune1, Cindy Litman2, Stacy Marple2, and Ashley Ballard1. We are indebted to the teachers, students, and administrators of the participating schools and districts without whose willing participation this work would not have been possible. Finally, we thank additional Project READI staff for assisting with data collection and scoring: Michael Bolz1, Allison Hall1, Karina Perez3, Jacqueline Popp1, Francis Reade2, and Kathryn Rupp3. 1 University of Illinois at Chicago (UIC) 2 WestEd, Strategic Literacy Initiative 3 Northern Illinois University (NIU) 4 Now at California State University, Fresno, CA 5 Now at Illinois State University, Normal, IL
Funding Acknowledgment Project READI was supported by the Reading for Understanding (RFU) initiative of the Institute for Education Sciences, U. S. Department of Education through Grant R305F100007 to the University of Illinois at Chicago from July 1, 2010 – June 30, 2016. The opinions expressed are those of the authors and do not represent views of the Institute or the U. S. Department of Education.
Corresponding Author: Susan R. Goldman
[email protected] Phone: 312-413-1566 Cell: 312-659-0321
Accepted for publication in the American Educational Research Journal, October 16, 2018.
Text-based Explanatory Modeling in Science
2
Abstract This paper reports the results of a randomized control trial of a semester-long intervention designed to promote ninth grade science students’ use of text-based investigations to create explanatory models of biological phenomena. The main research question was whether student participants in the intervention outperformed students in control classes, as assessed by several measures of comprehension and application of information to modeling biological phenomena not covered in instruction. A second research question examined the impact on the instructional practices of teachers who implemented the intervention. Multilevel modeling of outcome measures, controlling for pre-existing differences at individual and school levels, indicated significant effects on intervention students and teachers relative to the controls. Implications for classroom instruction and teacher professional development are discussed. Keywords: Disciplinary literacy for science Multi-level modeling Science modeling practices Teacher professional development
Text-based Explanatory Modeling in Science
3
Explanatory Modeling in Science through Text-based Investigation: Testing the Efficacy of the Project READI Intervention Approach National and international trends indicate that current reading comprehension instruction is not preparing citizens for full participation in 21st century societies (National Assessment of Educational Progress 2009a, b; Organization of Economic & Cultural Development, 2013). The accessibility of unprecedented amounts of information, much of it unfiltered and often contradictory, means that readers need to analyze, synthesize, and evaluate information within and across sources (e.g., print-based texts, audio and video, images). The need is particularly acute for science because of public participation in decision making about quality of life issues (e.g., global climate change, genetically modified foods). Yet the evidence suggests that the public is ill-equipped to deal with the science underlying such issues (National Center for Educational Statistics, 2012). The Common Core State Standards (CCSS) (Council of Chief State School Officers, 2010) and the Next Generation Science Standards (NGSS) (National Research Council, 2012; Next Generation Science Standards Lead States, 2013) speak to these needs. For the diverse students in our nation’s middle and high schools many of whom are profoundly ill prepared for the CCSS and NGSS standards, educators must simultaneously support literacy and science learning (e.g., see Schwarz, Passmore, & Reiser, 2017). A critical aspect of the challenge for adolescents is that they are expected to read to build knowledge in multiple content areas. They are presented with discipline-specific texts and are expected to perform disciplinary tasks that require specialized ways of reading, thinking, and conveying information to others (Alvermann & Moore, 1991; Bazerman, 1985; Bromme & Goldman, 2014; Lee & Spratley, 2010; Moje, 2015; Moje & O’Brien, 2001; Shanahan & Shanahan, 2008; Snow & Biancarosa, 2003). Yet, the
Text-based Explanatory Modeling in Science
4
disciplinary literacies - the oral and written communication practices of disciplines (Moje, 2008) are rarely the focus of instruction, either in content area classes or in reading or English language arts classes. The NGSS address the practices of science, foregrounding necessary literacies in these practices most explicitly in practice eight labeled as “organizing, selecting, and communicating information” (NGSS Lead States, 2013). Motivated in part by the gaps between the literacies citizens need in the 21st century and those they have upon high school graduation, various countries have undertaken different initiatives to redress the gap. One such effort undertaken in the United States, Project READI, is the context for the study reported in this paper. Overview of Project READI Project READI was a multi-institution collaboration of researchers, professional development designers and facilitators, and practitioners. It was funded from 2010 to 2016 under the “Reading for Understanding” initiative of the federal government of the United States. The Project READI team engaged in researching and developing interventions to enhance adolescents’ reading for understanding in three academic disciplinary content areas – literature/literary reading, history, and science. The team defined reading for understanding as engaging adolescents’ in the practices of evidence-based argumentation from multiple sources of information in ways that reflected developmentally appropriate forms of authentic disciplinary practices. In evidence-based argumentation, claims are asserted and supported by evidence that has principled connections to the claim, but the nature of claims, evidence, and principles differ depending on the discipline (Goldman et al., 2016a; Graff & Birkenstein, 2016; Herrenkohl & Cornelius, 2013; Hillocks, 2011; Langer, 2011; Lee & Sprately, 2010). In the Project READI work, multiple sources of information referred to the multitude of media, representational modes
Text-based Explanatory Modeling in Science
5
and genres/forms accessible in the 21st century, including online and offline sources, spoken and written, verbal and visual (graphs, diagrams, schematics, video), static and dynamic (Kress, 1989; Kress & Van Leeuwen, 2001; New London Group, 1996; Unsworth, 2002). Competent reading comprehension and learning in the 21st century involves fluency with all of these forms. The Project READI team undertook four strands of work. Two strands pursued a set of overarching questions about forms and types of tasks, information sources, instructional strategies and tools that would enable students to engage in evidence-based argumentation from multiple sources. Strand One employed quasi–experimental studies. Strand Two engaged in iterative design–based research (DBR) (Cobb, Confey, diSessa, Lehrer & Schauble, 2003; Reinking & Bradley, 2008). The DBR was conducted through design teams for each disciplinary area. Each team included researchers, teacher educators, classroom teachers, and professional development and subject matter specialists who collaboratively developed, implemented, and revised instructional designs for evidence-based argument instructional modules. Strand Three focused on developing assessments of evidence-based argument that would support claims about student learning relative to the learning objectives of the instructional modules. Strand Four focused on teachers’ opportunities to learn and followed directly from the Project READI theory of action. Simply put, teachers mediate students’ opportunities to learn. However, many teachers have themselves had little opportunity to engage in inquiry-based approaches to literary reading, history, or science. Throughout the project, the team convened teachers who worked in groups within their own disciplines to explore a variety of constructs and rethink their instructional practices. Constructs explored included argumentation, close reading, and disciplinary reasoning principles. Instructional practices included tasks they were assigning, information sources they were using, opportunities they were providing for students to interact
Text-based Explanatory Modeling in Science
6
and engage in collaborative as well as individual sense-making, and how they orchestrated small group but especially whole class discussions. Explorations within disciplines were shared across disciplines and provided opportunities for teachers to hear perspectives and learn how colleagues outside their own discipline thought about the same set of constructs, challenges, and practices. Overall, there was a strong emphasis on teachers learning how to move the intellectual work, including reading various information sources, from themselves to the students. A major culminating activity of Project READI, and a requirement of the funding agreement, was a randomized control trial (RCT) efficacy study of the instructional approach that emerged from the design and research activities. During academic year 2014 – 2015, we conducted the efficacy study in ninth grade biological sciences classes.1 This paper examines the impact of the Project READI instructional intervention compared to ninth grade biological sciences instruction in classes not participating in the intervention. The main research question for this study was whether student participants in classes implementing the Project READI intervention outperformed students in the control classes. Performance was compared on multiple measures of comprehension and application of information for purposes of explaining models of biological phenomena. A second research question that is addressed in this paper derives from the Project READI theory of action and relates to potential impacts on the attitudes, beliefs, and practices of those biology teachers who participated in the efficacy study as intervention teachers. The reminder of this introduction provides the theoretical and empirical rationales for the overall Project READI approach to reading for understanding, its instantiation in science as textbased explanatory modeling, and the professional development model. We wish to emphasize that text-based investigations should be understood in contrast to hands-on investigations where students collect data and work from these data to construct explanations or test hypotheses. In the
Text-based Explanatory Modeling in Science
7
Project READI context, text is used broadly to refer to the multiple forms in which science information may be represented, including verbal text, static and dynamic visual displays (e.g., tables, graphs), diagrams, and schematics. The specifics of the student intervention and the professional development employed with teachers in the efficacy study reported in this paper are provided in the Methods section. Theoretical Framework Project READI Approach to Reading for Understanding The Project READI team developed a conceptualization of reading to understand that built on conceptions of reading comprehension as involving the construction of mental representations of text in a sociocultural context (e.g., Rand, 2002). These mental representations capture the surface input, the presented information, and inferences that integrate information within and across texts and with prior knowledge (e.g., Goldman, 2004; Graesser & McNamara, 2010; Kintsch, 1994; Rouet, 2006; Rouet & Britt, 2011; Tabak, 2016; van den Broek, Young, Tzeng, & Linderholm, 1999). Processes involved in generating these representations are close, careful reading of what the text says, along with analytic and synthetic reasoning within and across texts to determine what the text means (Goldman, 2018). We joined this perspective on comprehension with a disciplinary literacies perspective on argumentation from multiple sources, thus integrating disciplinary reasoning practices with literacy practices that support them. As a general construct or discourse scheme, argumentation refers to the assertion of claims that are supported by evidence that has principled connections to the claim (Toulmin, 1958; Toulmin, Rieke, & Janik, 1984). Generally speaking, close reading, analysis and synthesis enable learners to identify elements and construct arguments from text(s). These arguments are subject to justification, evaluation, and critique.
Text-based Explanatory Modeling in Science
8
However, these reading, reasoning, and argumentation processes operate differently in different disciplinary content areas. This is so because what claims are about, criteria that define what counts as evidence relative to some claim, and the principles that warrant or legitimize why particular evidence does indeed support a particular claim differ from discipline to discipline. In traditional academic disciplines, what constitutes valid argument depends on the epistemology of a discipline (Goldman et al., 2016aa) in conjunction with the discourse norms that the members of the disciplinary community have negotiated and agreed upon (Gee, 1992; Lave & Wenger, 1991). That is, members of a discipline constitute a discourse community and share a set of conventions and norms regarding valid forms of argument and communication among members of the community. These norms reflect the epistemology of the discipline – the nature of disciplinary knowledge and how new knowledge claims in that discipline are legitimized and established (Andriessen, 2006; Bricker & Bell, 2008; Goldman & Bisanz, 2002; Moje, 2015; Norris & Phillips, 2003; Osborne, 2002; Sandoval & Millwood, 2008; Wineburg, 2001). Thus in addition to knowing the concepts and principles of their discipline, members of a disciplinary community have knowledge about their discipline that supports engaging in the reading, reasoning and argumentation practices in their disciplinary area (Goldman et al., 2016a). To capture what students needed to know about a discipline to support comprehension and production of argumentation in that discipline, each of three Project READI disciplinary teams (one for literary reading, one for history, and one for science) undertook an extensive examination of theoretical and empirical literature on the reading and argumentation practices of disciplinary experts, empirical reports of adolescents’ disciplinary reasoning, and the types of representations and discourse used by members of the disciplinary community. Cross-talk among the disciplinary teams produced agreement about five categories of knowledge about a discipline that we labeled
Text-based Explanatory Modeling in Science
9
core constructs: epistemology; inquiry practices, reasoning strategies; overarching concepts, themes, principles, frameworks; forms of information representation/types of texts; and discourse and language structures (Goldman et al., 2016a). The general definitions of these five are provided in the first column of Table 1 and the specification in science in column two. (For specification in literature and history, see Goldman, 2018; Goldman et al., 2016a). Table 1 about here By combining the core construct specification in each discipline with the general processes of reading and reasoning to argue, the Project READI team formulated learning goals for each disciplinary content area. As shown in the leftmost column of Table 2 for science, the learning goals include processes of close reading, synthesizing across multiple information sources, constructing explanation, justifying/evaluating, and critiquing, along with an awareness and understanding of the epistemology of the discipline. In contrast to the science learning goals that capture what it means to engage these processes in science, the learning goals as specified in literature or history reflect the epistemic orientations of each of those disciplines; the claims, evidence, and reasoning principles appropriate to each discipline; and the kinds of information representations that are read and produced by members of the disciplinary community (Goldman et al., 2016a; Lee, Goldman, Levine, & Magliano, 2016). Thus, what students are closely reading, what they are trying to bring together – the patterns they are attempting to discern, the kinds of explanations they are seeking to construct, justify, and critique - are specific to each discipline and embody the epistemic orientation of it (Goldman, Ko, Greenleaf, & Brown, 2018). Supporting the central role of epistemic orientation are data that indicate that participants’ thinking about the epistemology of the topic their reading is a significant predictor of
Text-based Explanatory Modeling in Science
10
comprehension (e.g., Bråten, Strømsø, & Samuelstuen, 2008; Strømsø, Bråten, & Samuelstuen, 2008). Table 2 about here Engaging students in the active inquiry and knowledge construction practices that are essential to evidence-based argumentation departs from traditional knowledge telling pedagogy (e.g., Goldman & Scardamalia, 2013). Project READI pedagogy included instructional routines and participation structures that were intended to provide social and affective support for persistence and resilience in the face of the challenges posed by evidence based argument tasks. For example, instructional routines included teacher modeling to make visible disciplinary knowledge construction processes as well as metacognitive conversations to build awareness of how learning happens, and strategies and heuristics involved in sense making, including struggling. Participation structures involved a cycle of independent work followed by sharing in dyad or small group work, that then culminated in whole class discussion. This cycle enabled students to share their thinking and struggling with peers and then compare, discuss, and engage in further sense making, prior to sharing publicly with the whole group. Project READI Approach to Science: Text-Based Investigations to Support Explanation of Phenomena The reasoning practices of science foreground evidence-based argumentation around the development of models that explain phenomena of the natural world 2 (Cavagnetto, 2010; Osborne & Patterson, 2011; Windschitl, Thompson, & Braaten, 2008). Prior work that has focused on supporting students to develop explanatory models have engaged students in hands-on investigations or provided them with datasets that serve as the basis of modeling, explanation, and argument construction (Berland & Reiser, 2009; Chin & Osborne, 2010; McNeill & Krajcik,
Text-based Explanatory Modeling in Science
11
2011; Passmore & Svoboda, 2012). These efforts tend to downplay the literacy practices called upon in working with representations of science information (e.g., Linn & Eylon, 2011). The focus of the Project READI science work on text-based investigations centrally involved the use of authentic science texts to construct knowledge, draw on information and evidence, and develop explanations and arguments that fit the data. As noted above, science information is represented in a wide range of representations, including verbal texts but also in static and dynamic visual displays. Data are tabulated, displayed, summarized, and reported in graphs, tables, and schematics, and there are conventional linguistic frames that constitute the rhetoric of argument in science (Lemke, 1998; Norris & Phillips, 2003; Osborne, 2002; Park, Anderson, & Yoon, 2017; Pearson, Moje, & Greenleaf, 2010). Indeed, for some science subdisciplines, the data are extant and often longitudinal data sets, such as huge databases on global climate measurements collected over centuries, ice core sampling, and similar types of data that present-day analysts did not collect themselves. To learn to practice science, students need to build the literacies required in such an enterprise yet they are not typically instructed or engaged in activities that do so (Litman et al., 2017; Osborne, 2002; Vaughan, et al., 2013; Yore, 2004; Yore, Bisanz & Hand, 2003). The absence of science text reading in classroom instruction is attributable in part to the kinds of texts typically found in those classrooms, namely textbooks that portray science as a set of known facts. This portrayal of science stands in stark contrast to the collaborative yet argumentative knowledge building processes that have been observed in scientists at work (e.g., Chiappetta & Fillman, 2007; Penney, Norris, Phillip & Clark, 2003). Moreover, science information is necessarily communicated in complex sentences that contain technical terminology and mathematical expressions, as well as everyday vocabulary used in highly specific ways.
Text-based Explanatory Modeling in Science
12
Visual texts of varied kinds including diagrams, graphs, data tables and models are used to communicate science information but students are rarely taught how to comprehend these texts (Fang & Schleppegrel, 2010; Lee & Sprately 2010.) In the face of such seemingly intractable texts that portray science as a known body of facts, teachers transmit orally and “power point” what they are responsible for teaching students (e.g., Litman et al., 2017; Vaughan, et al., 2013). The result is that students have neither opportunities to engage in the reading practices of science nor use information found in texts to construct, justify, or critique explanations and models of science phenomena. Thus the Project READI approach to science instruction encompassed pedagogies and curricular materials to support students engaging in investigations of science phenomena using authentic science texts. The Project READI approach in science was realized in instructional modules that reflected design principles related to (1) selecting and sequencing science texts that reflect a range of complexity (van den Broek, 2010); (2) instructional supports to foster reading for inquiry purposes (Moje & Speyer, 2014; Schoenbach, Greenleaf, & Murphy, 2012; Tabak, 2016) and to develop and evaluate causal explanations for phenomena (Chin & Osborne, 2010; Passmore & Svoboda, 2012); and (3) discourse rich participation structures (e.g., individual reading, peer to peer text discussion, whole class discussion) to support grappling with difficult texts and ideas, knowledge building and evidence-based argumentation (Ford, 2012; Osborne, 2010; von Aufschnaiter, Erduran, Osborne & Simon, 2008). The Strand Two iterative DBR informed successive refinement of the instructional supports, sequencing, framing of inquiry questions, and selection of texts to reflect the range and variety of representational forms that characterize science information representations. Sequencing was particularly important. It was informed by observations and revisions to designs
Text-based Explanatory Modeling in Science
13
over the life of the Strand Two work as well as research literature regarding development of the various kinds of knowledge and skills identified in the core constructs and areas of challenge for students (Garcia & Andersen, 2008; Greenleaf, Brown, Goldman & Ko, 2014; Greenleaf et al., 2016; Zohar, 2008). Refinements worked toward improving upon a progressive sequence of activities to build reading, reasoning, and modeling practices specified in the Project READI Science Learning Goals (Table 2). For example, one consistent observation in the design work was that students needed to learn discourse norms and routines for text- based, metacognitive conversations that could support sense-making, building knowledge of science, and building meta-knowledge for science reading and modeling. As well, students needed to learn about the warrants for argument in science. The instructional progression built in these threads as aspects of science literacy practice that would build over time. One outcome of the Strand Two work was the learning phase progression depicted in columns 2 – 5 in Table 2. The progression reflected the Project READI science design team’s collective understanding of productive staging of the introduction of specific learning goals and their progressive deepening over time and in relation to the other learning goals. The descriptive labels for each phase indicate the overarching instructional and intellectual focus. Reading across the columns for a particular goal illustrates the increased deepening of each goal over the four phases. Reading “down” a specific learning phase shows the foci for specific learning goals in relation to the others during that phase. Goals that were focal in earlier phases (e.g., close reading, synthesis) support focal goals for later phases (e.g., construct explanatory model, justify and critique models). Further discussion of these four phases in the context of the specific progression for the efficacy study is provided in the Methods section.
Text-based Explanatory Modeling in Science
14
In brief, the Project READI science progression is a framework for ‘on-boarding’ novice science readers into science reading practices, culminating in reading multiple science texts for purposes of generating explanatory models of science phenomena. The instructional progression attempts to reflect an iterative instructional cycle for practices of reading, reasoning, and argumentation during text-based investigations. Practices are introduced, often through modeling and explicit instruction, followed by student use of the modeled practices. Student use is scaffolded through various templates that provide language stems for reading, reasoning, and talking science and follow the participation structure cycle of individual – pair/small group – whole class discussion. Throughout, there are opportunities for feedback that support fluent grasp of the concepts and practices that reflect core constructs in the discipline. A long-term goal of Project READI is that students come to view themselves as competent and confident science readers and learners who persist at tasks and with texts that challenge them, consistent with Bandura’s (1997) definition of self-efficacy. Project READI Approach to Professional Development The Project READI instructional approach asks teachers to make significant shifts in their current instructional practices. Although some pedagogical shifts are amenable to highly structured, scripted materials and practices, the Project READI approach is not. When the goal is the type of deep instructional change called for by the Project READI approach, past research on professional learning indicates that teachers need several types of experiences and support, including inquiry into teaching and learning, learning in ways that model targeted pedagogical approaches (Davis & Krajcik, 2005; Loucks-Horsley, Hewson, Love & Stiles, 1998; Schoenbach, Greenleaf, & Murphy, 2016), ongoing reflection on their practice and their own learning (Moon, 2013), working with colleagues to translate ideas into their specific contexts, and ongoing support
Text-based Explanatory Modeling in Science
15
for their learning (Bill et al., 2017; Cognition & Technology Group at Vanderbilt, 1997; Goldman, 2005; Greenleaf & Schoenbach, 2004; Greenleaf, Schoenbach, Cziko, & Mueller, 2001; Kennedy, 2016; Kyza & Georgiou, 2014; Liberman & Mace, 2010; Raphael, Au, & Goldman, 2009; Yoon et al., 2017; Yoon, Koehler-Yom, & Yang, 2017; Zech, Gause-Vega, Bray, Secules, & Goldman, 2000). Accordingly, Project READI’s Strand Four work was devoted to developing, studying, and refining inquiry designs for engaging teachers as practitioners in evidence-based argumentation in their discipline. From the beginning of Project READI and up through year four, we convened ongoing meetings of teachers in what we labeled Teacher Inquiry Networks. Participants in these networks were not eligible to participate in the RCT efficacy study. Network participants engaged in three types of activities. The first group of activities was intended to surface teachers’ thinking and build their understanding of argumentation including the nature of claims, evidence, and reasoning, in their discipline (e.g., science, history, or literature). The second group of activities provided opportunities for teachers to explore their disciplinary reading and reasoning processes especially across different types of representations they might encounter across a range of information sources in their discipline. In science this included different types of authentic forms of traditional texts, graphs, data tables, diagrams, and schematics. Teachers annotated these representations individually, then shared and reflected on them with colleagues within their discipline. These within-discipline discussions were shared across the three disciplinary teams participating in Project READI, an activity that highlighted key similarities and differences across the three and between pairs of disciplines. These opportunities for teacher learning built on the professional learning model previously developed by the authors (Greenleaf et al., 2011) but
Text-based Explanatory Modeling in Science
16
adapted to reflect Project READI’s focus on evidence-based argument from multiple information sources. In their second year, the Teacher Inquiry Networks turned to a third type of activity, namely the iterative design of instructional sequences, in collaboration with Project READI science staff. Designs were implemented, reflected on, revised, and implemented over years two through four. This process resulted in inquiry learning modules that extended over multiple weeks. By the third year of involvement, the Inquiry Network science teachers were active contributors to the Strand Two science design team. The work in the first four years of Project READI confirmed two important principles regarding professional learning to prepare teachers to engage in the kind of complex instruction called for in Project READI. First, repositioning the role of the teacher as envisioned in Project READI is a gradual process. It took several iterations of implementation and reflection before teachers’ adaptations to suggested Project READI protocols and materials reflected the deep structure of the approach. Typically, the first time teachers tried many of the instructional processes they were tentative and unsure of their success. Many initial adaptations retained the form but not the substance of the principles. Debriefing with colleagues in the design team and teacher network meetings provided a crucial opportunity for feedback and reflection by individual teachers on their own experiences as well as on that of their colleagues. Reflections led to revisions in designs and successive iterative cycles. With each cycle, teachers and the rest of the design team members had new insights that informed the next iterations. For most teachers by the third or fourth cycle they had become quite adept at analyzing candidate texts and tasks that would accomplish content goals and afford students opportunities to engage in the reading, reasoning, and argumentation learning goals. Second, teachers took up the approach in different
Text-based Explanatory Modeling in Science
17
ways, over different time frames, and to different degrees. However, we saw evidence of change toward the envisioned Project READI approach in approximately 90% of the almost 100 teachers with whom we worked over the first 4 years of the project. These two lessons posed a dilemma for the design of the science efficacy study reported in this paper due to two constraints on the design of randomized control trials. First is the design requirement that participants have no prior history with the intervention prior to random assignment to either intervention or control group. This meant that participants in the efficacy study would be “first time” implementors of the Project READI intervention, making an inquiry network approach to teacher professional development infeasible for the efficacy study. A second design requirement of RCT’s is clear definition of the “it” of the intervention. Yet, the work with teachers in the inquiry network over the first four years of Project READI had indicated that even when teachers collaborated on the design of a module, enactments with their students varied depending on the constitution of the class with which they were working. These variations reflected adaptive integration (Bryk, Gomez, Grunow, & LeMahieu, 2016) but also reflected fidelity to the underlying principles of the Project READI approach (e.g., Brown & Campione, 1994). Given the need for an identifiable intervention and the reality that we would be testing the efficacy of it with teachers who were implementing for the first time, we opted to provide the intervention teachers with instructional modules that had been developed in the Strands Two and Four rather than have them create their own modules. This decision was intended to produce consistency across intervention teachers and their students in the materials (i.e., tasks, information resources and tools) that constituted the content of the intervention. The professional development (PD), described in detail in the Methods section, engaged teachers in the
Text-based Explanatory Modeling in Science
18
instructional routines and practices that constitute the Project READI approach to enacting the curriculum materials. Thus, the PD design was intended to prepare teachers to understand the deep structure of the Project READI science approach sufficiently to achieve reasonable progress on the science learning goals, especially close reading, synthesis across multiple information sources, and construction of explanatory arguments. In summary, the Project READI intervention for students and the professional learning experiences for teachers reflected the empirical evidence regarding high quality science instruction and high quality professional development models. The main research question concerned the impact on students of participating in the intervention as compared to a control group of students who participated in typical ninth grade biological sciences instruction. A second research question examined the impact of the professional learning experiences on teachers’ attitudes and practices by comparing intervention to control teachers. Methods The methods section begins with the overall research design and description of the participants. The next section details the design of the instructional intervention for students and is followed by the design of the professional development for teachers. The instruments used to collect data from teachers and from students are then described. The last two sections detail the data collection procedures and the data analysis approaches employed in the present study. Research Design The design was a stratified random control trial with schools as the unit of assignment. To take into account pre-existing variations in demographics and achievement levels among the schools, these characteristics were used to sort schools into six strata; randomization of schools to treatment condition (Intervention or Control) was applied within each strata. Definitions of the
Text-based Explanatory Modeling in Science
19
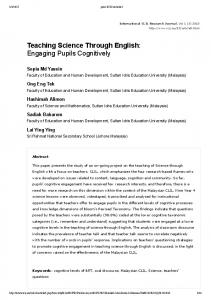
strata and the demographics for the schools, teachers, and students assigned to each condition are provided in the Participants section. As depicted in Figure 1, the student intervention component of the study was conducted over a five to six month period (20 to 22 weeks of instruction), beginning with the 2014 academic year. Professional development for teachers assigned to the Intervention condition began nine months prior to the start of the student intervention. Professional development for teachers assigned to the Control group occurred after the conclusion of all data collection from students and teachers. Figure 1 about here Dependent measures of student performance were derived from instruments that assessed evidence-based argument from multiple texts for biology phenomena not covered during instruction, basic reading comprehension skills, complex comprehension from multiple texts, and self-report surveys of epistemology and self-efficacy. Dependent measures for teachers were derived from self-report surveys of attitudes and practices and from observations of classroom practices. The characteristics of the various instruments are provided in that section below. Figure 1 shows the timing of data collection from teachers and students relative to the onset of the professional development for teachers in the Intervention condition, the implementation of the instructional intervention, and the professional development for the Control teachers. In addition to basic descriptive analyses (e.g., means, standard deviations) and statistical tests of within and between group differences for the dependent measures, multilevel modeling was used to test for treatment effects at the student level as is appropriate for the nesting present in the design (students within classrooms; classrooms within teachers; teachers within schools). The multilevel modeling took into account variation in performance levels prior to the start of the
Text-based Explanatory Modeling in Science
20
intervention (pre). The same strategy of descriptive statistics and tests of group mean differences followed by multilevel modeling was employed to examine differences between Intervention and Control teachers. Participants High schools were recruited from six districts in and around a large urban area. Working with district administrators, schools were contacted and faculty teaching ninth-grade biological sciences were recruited. During recruitment teachers and principals were informed of the requirement of random assignment to condition and that schools that agreed to participate had a 50/50 chance of being assigned to the Intervention condition. However, we indicated that those assigned to the Control condition would be provided with professional development after the research study was concluded. This process yielded an initial pool of 35 schools that reflected a broad range of achievement and socioeconomic levels. There were three dominant demographic patterns among these school populations: Largely (defined as greater than 80%) African American with a mix of Latinx, White, Asian, or Multi-racial; largely Latinx, with a mix of African American, White, Asian, or Multiracial; Mixed defined as no single group constituting more than 60% of the student body. Between the time of recruitment and random assignment to conditions, 11 of the 35 schools were no longer willing to participate in the study.3 To achieve the goal of equating Intervention and Control condition samples with respect to achievement levels and demographic characteristics existing prior to intervention, six stratified groups were created based on publicly available data on achievement, socioeconomic status, and populations served. Achievement level was indexed by the percentage of students meeting or exceeding expectations for the eleventh grade based on the state’s learning standards. These percentages were those reported for the Spring, 2013 administration of the Prairie State
Text-based Explanatory Modeling in Science
21
Achievement Exam (PSAE), the most recent administration at the time of recruitment and randomization. The PSAE was the only assessment common to all the high schools in the sample; there was no other assessment that all schools administered at a consistent grade level. The PSAE is a two-day standardized test taken by all eleventh graders in the state where the study was conducted. On day one, students take the ACT assessment of college and career readiness (https://www.act.org/). On day two they take a WorkKeys job skills assessment of foundational skills for success in the workplace (https://www.act.org/) and a science exam designed by the state’s Board of Education. Students’ individual scores are benchmarked against the state’s eleventh grade learning standards; the percentage of students that meet or exceed at the school level is publicly available for each school in the state. Socioeconomic status was indexed by the percentage of students qualifying for free or reduced lunch. Population served reflected the three types of schools indicated above. Half of the schools within each strata were randomly assigned to the Intervention condition and the other half constituted the Control. The results of the stratification and randomization process are shown in Table 3 for the 24 participating schools. Table 3 about here Note that the difference between strata that are grouped together was in demographic pattern rather than achievement or socioeconomic characteristics. For example, schools in strata three were largely African American populations; schools in strata four served largely Latinx populations. Of importance in this table are the data indicating that the stratification followed by random assignment to treatment group resulted in highly similar characteristics within each pair of strata across Intervention schools and Control schools. The lowest strata (one and two) had the lowest percentage of students meeting or exceeding grade level expectations. It is interesting to
Text-based Explanatory Modeling in Science
22
note that the schools in the highest achieving strata were below 60% meeting or exceeding grade level expectations. Table 4 provides information about the 24 teachers in the Intervention as compared to the 24 in the Control group. Gender distribution was not related to condition (2 (2, N = 48) = .09, p = .76). Race/ethnicity distributions were also similar across conditions as was the range of teaching experience (two to 15 years). Each of the 48 teachers taught multiple sections of the ninth grade biological sciences course; each section defined a classroom for purposes of the design. Table 4 about here Students were recruited from two classrooms of each teacher, yielding 96 classrooms (48 Intervention and 48 Control).4 Approximately 1400 students returned their own and their parental consent forms indicating willingness to participate. Of these, approximately 60% were from students in Intervention classrooms and the other 40% were from students in Control classrooms. Preliminary analyses indicated that consent rates were consistent across strata and schools within districts. Thus, the consented sample did not introduce selection bias related to strata. A total of 981 students assented to contributing data to the analyses reported in this manuscript, approximately 70% of those who had agreed to participate at the start of the school year. Attrition was due to a variety of issues, including missing data on one or more of the assessments. Of importance is that the Intervention and Control groups did not differ with respect to age (Intervention: M = 14.22 years, SD = .56, range = 13-18; Control: M = 14.19, SD = .93, range = 13-18), t (933) = .60, p = .55). Nor were there differences related to the percentage of students reporting that English was their first language (Intervention: 77%; Control = 75%, 2 (1, 941) =.71, p = .40).5 Table 5 presents the gender and race/ethnicity distributions for the
Text-based Explanatory Modeling in Science
23
Intervention and Control groups. Neither the distribution of gender by condition (2 (1, 979) = .53, p = .47) nor that of race/ethnicity by condition (2 (5, 977) =8.72, p = .12) were significant. Table 5 about here Design of the Student Intervention The intervention began with the start of the Fall 2014 semester and extended into the first two months of the Spring 2015 semester. Topic selection and sequencing for the Intervention condition was aligned with content coverage for the Fall semester in the Control condition and complied with any district mandates regarding coverage. To achieve alignment, the Project READI team consulted districts’ scope and sequence documents in conjunction with information provided by Intervention and Control teachers regarding what they planned to cover (including any district mandates) and in what order during the Fall 2014 semester. The alignment of content coverage (e.g., biological principles and concepts) across Intervention and Control conditions was intended to reduce the possibility that differences between groups post-intervention could be attributed to the content they had had opportunities to learn. Table 6 shows how the four–phase learning progression (Table 2) and Project READI learning goals were instantiated across weeks in the Fall 2014 semester. The rows in the table specify the focal learning goals, materials and tools, and the sequence of biology science topics and principles. Weeks per learning phases were approximations and were expected to vary across teachers and classrooms, an expectation conveyed to the Intervention teachers. Table 6 about here The learning phase progression was organized to introduce and then deepen the reading, reasoning, and discourse skills that students need to engage in text-based inquiry for purposes of constructing explanatory models of biological phenomena. In phase one classroom routines that
Text-based Explanatory Modeling in Science
24
support reading, reasoning, and talking about biology were established. In phase two, students worked within these classroom routines and moved from more generic reading, reasoning, and talking strategies and heuristics to those that were tailored to making sense of principles, concepts, and models germane to the biological sciences. In phase three the routines and sense making processes were instantiated in inquiry aimed at constructing explanatory models of biological phenomena, often motivated by driving questions or conundra intended to induce puzzlement in students. In phase four, students deepened their explanatory modeling practices by not only constructing but justifying and critiquing alternative models. The design relied on intentional sequencing of information resources in combination with tools intended to scaffold reading, reasoning, representational and modeling practices, as well as classroom routines that made these processes visible. Particularly important for making processes and thinking visible are classroom discourse routines that support metacognitive awareness of how we know what we know. As indicated in describing the Project READI work leading up to the efficacy study, the specific materials, tools, and instructional processes for engaging students in the reading, reasoning, representational, and modeling practices in biology were based on those that had been iteratively designed and implemented by Project READI teachers in the Strand Two and Four work. These were assembled into student notebooks and text sets (“readers”). The student notebooks included descriptions of activities, instructions for what students were to do and templates of various worksheets that scaffolded reading, reasoning and modeling activities. The design assumed teacher facilitation and mediation of students’ use of the notebooks. Teacher guides to the facilitation and mediation took the form of annotated versions of the student notebooks. The annotations provided guidance and tips from teachers who had been involved in the iterative design of the modules and materials. The specifics of the four phases of learning are
Text-based Explanatory Modeling in Science
25
provided in Appendix A. Summaries of the modules listed in Table 6 Materials are provided in Appendix B. Complete modules can be accessed and downloaded at . Design of Professional Development for Intervention Teachers The professional development design was shaped by what we had learned from collaborating with teachers during the Project READI Strand Two and Four work in conjunction with the constraints of conducting an RCT efficacy study, as discussed above in the Project READI approach to professional development. The professional development was designed to achieve two focal goals. 1. Raise teachers’ awareness of their own practices for making sense of science information, including the reading, reasoning, and arguing processes they used when working with science materials that were challenging for them as adult biological sciences teachers; 2. Immerse the teachers-as-learners in the intervention they would subsequently implement with their students, a process similar to the educative curriculum approach (Davis & Krajcik, 2005). The immersion process engaged teachers in constructing explanatory models of the phenomena and topics covered in the ninth grade biological sciences course and provided a basis for teachers to discuss and reflect on how to introduce and sustain the instructional routines and classroom participation structures. In particular, they reflected on challenges they expected their students would experience and brainstormed tools and strategies for supporting students, especially in reading to construct explanatory models from biology information sources (e.g., texts, graphs, diagrams). Throughout, they examined their own thinking about modeling practices, including justification and evaluation of models based on coherence and completeness criteria.
Text-based Explanatory Modeling in Science
26
Intervention teachers participated in a total of 11 day-long sessions distributed over 10 months as shown in Figure 1. Nine of those days occurred during the Winter, Spring and Summer preceding the actual start of the intervention work with students. The remaining two days occurred during the enactment of the intervention. Sessions one to four. Teachers were immersed in reading practices relevant to learning science (Greenleaf et al., 2011; Schoenbach et al., 2012). For example, session one focused on engaging the teachers with close reading of science texts; in particular, in participating in the routines that they would enact to lay the ground work for and foster student engagement in science reading and learning. Participants explored how literacy has shaped their engagement with text, how the social conditions of the learning environment affected them, how they read and how they thought as scientists. They were asked to try out these routines in their classrooms in preparation for bringing artifacts from these efforts to session two. During session two, teachers shared their artifacts, discussed their experiences, and engaged in inquiry focused on engaging students in reading to construct explanations of science phenomena. Again, teachers were expected to try out these routines in their classrooms and debrief at the next meeting. Similarly, during sessions three and four, the emphasis was on pedagogical practices for supporting textbased inquiry in science. Sessions five to nine. Five sessions during the summer focused on organizing the work of the semester–long student intervention. Teachers were provided with an overview of the intervention semester (Table 6) and familiarized themselves with the substance of the intervention -- the information resources provided for students in the form of “readers” for each module, the tasks, descriptions of activities, and tools provided in the student notebooks. During the sessions, the teachers participated as students in the instructional routines and activities they were to
Text-based Explanatory Modeling in Science
27
implement in their own classrooms. Especially important were the teacher modeling activities because in the Project READI approach modeling of reading and reasoning makes these thinking processes visible to students. Teachers revisited but now in the context of biological science topics and explanatory modeling practices. Teachers worked through and discussed the suggested candidate texts for the introductory and cell biology topics as well as the Reading Models module. They previewed the Homeostasis and MRSA modules. Sessions ten and eleven. These sessions occurred during the intervention semester and focused on teachers taking deeper dives into the Homeostasis module (session ten during week six) and the MRSA module (session 11 during week 10). As well, they provided opportunities for teachers to share their experiences and instructional strategies. Design of Professional Development for Control Teachers Control teachers were provided five full-day sessions of professional development during which they experiences a modified version of the professional development that had been provided to the Intervention teachers. The five sessions all took place after data collection for the RCT study was completed (see Figure 1). The Control group teachers covered all of the same topics and learning experiences that the Intervention teachers had experienced, except for the portions concerned with implementation planning. Control teachers’ were provided with all of the same instructional resources for use with students that had been provided to the Intervention teachers. Data Collection Instruments: Teachers All teachers completed a self-report survey about their attitudes and practices regarding students’ reading in science prior to the start of the professional development for Intervention teachers (pre-intervention) and again after all data had been collected from students (post-
Text-based Explanatory Modeling in Science
28
intervention). The classroom practices of teachers in both conditions were observed twice during the time frame of the intervention. The instruments used to collect these data are described in this section. Teacher self-report survey of attitudes and practices. The Project READI team developed and administered a self-report survey of teachers attitudes and practices related to teaching science, science literacy, and their student populations. The teacher survey consisted of 72 items that reflected 10 scales. One scale was a single item that asked about familiarity with the Common Core State Standards. Three scales were developed for the purposes of this study, and six scales were adapted from those used in a prior RCT conducted by a subset of the Project READI team (Greenleaf et al., 2011). All items used a 5-point Likert-type response format with all response options labeled. Table 7 presents information on each of the scales, including the name and construct tapped by the scale, number of items before and after exploratory factor analyses (reported in Data Analysis section), one or two example items, the type of response scale (e.g., frequency, agreement, or importance), the response options, and the reliabilities obtained at the pre and post administrations. Table 7 about here The scales described in Table 7 were targeted at teachers’ attitudes with respect to the role and importance of reading in science (Scale 2), their confidence in teaching and implementing science reading strategies with their students (Scale 3), and the malleability of student reading achievement (Scale 4). With respect to practices, teachers were asked to indicate how frequently they had students read science material in different contexts (Scale 5), engage in discussions of science content within and across sources and for purposes of identifying elements of argument (Scales 6, 7), and engage in metacognitive discussions about the processes of reading (Scale 8).
Text-based Explanatory Modeling in Science
29
They were also asked how often they made their science reading and reasoning processes visible to students (e.g., through modeling) (Scale 9) and how frequently and in what manner they provided students with feedback on their reading assignments (Scale 10). Observation of teachers’ classroom practices. Observers took field notes continuously throughout the observed class period. Each observer then used the field notes to assign a rubric score point to each of 19 indicators, resulting in 19 scores for each teacher for each observation. As shown in Table 8, the indicators were a priori clustered into six constructs central to accomplishing Project READI science learning goals: opportunities to read science to acquire content knowledge and support for these processes (Constructs 1 and 2); metacognitive inquiry processes and content (Construct 3), strategies and tools for text-based inquiry (Construct 4), argumentation and model building (Construct 5), and collaboration (Construct 6). Generally, the indicators referred to the extent to which the tasks and teachers supported and provided students with opportunities to engage in the activities referred to in the construct and whether and how students took advantage of such opportunities. The constructs and indicators for each are described in Table 8. Table 8 about here Observations were conducted by six members of the project staff, all of whom were familiar with the intervention, including three who had been directly involved in its development. A rater who had not been involved with the intervention development (external rater) provided ratings that were used for purposes of interrater reliability. The external rater was a member of the Project READI assessment design team and therefore was familiar with the learning goals and instructional approach. Training to achieve consensus on the criteria for the various score points was conducted prior to the Time-One and again prior to the Time-Two observations. The training
Text-based Explanatory Modeling in Science
30
involved each of the seven raters independently watching a video of a science class, taking field notes, and assigning score points. Different videos were used for training at the two time points. The Time-One video was of a middle-school teacher implementing an early iteration of a textbased investigation on the water cycle; at Time-Two, the video was of a 9th grade genetics lesson that used text but that was taught by a non-Project READI teacher. The seven raters met to discuss score points and rationales. Discussion of each produced consensus regarding criteria for each of the score points on each of the indicators. To establish interrater reliability on score point assignments for the teachers observed in the present study, the external rater observed one class with each of the six observers, thus resulting in six pairs of observations at Time-One and six pairs of observations at Time-Two. The external rater was not told whether the teacher was an Intervention or Control teacher. Percent agreement was computed for exact score point agreement and agreement within 1 score point. Average exact percent agreement was 76.4% (range 51.7 – 96.6) at Time-One and 65.5% (range 89.7% – 51.7%) at Time-Two. Within one score, at Time-One average agreement was 93.1% (range 100% - 86.2%); it was 92.5% (range 100% - 89.7%) at Time-Two. Disagreements in score point assignments were discussed and resolved. Data Collection Instruments: Students As mentioned in the Research Design section, students completed the evidence-based argument assessment (EBA), self-report surveys (science epistemology and science self-efficacy), and two reading comprehension assessments (one administered pre-intervention and the other post intervention). Although the EBA assessment topics had not been part of the instruction in either the Intervention or Control groups, the EBA assessment was highly aligned with the intervention instruction in that it targeted practices of explanatory modeling of biological sciences
Text-based Explanatory Modeling in Science
31
phenomena from multiple information sources. Self-report surveys of prior knowledge of the topics featured in the EBA (part of the EBA), epistemology and of self-efficacy were administered because individual differences associated with these constructs are known to impact comprehension of information (e.g., Alexander, 2003; Brâten et al., Nietfeld, Cao, & Osborne, 2006). All of these instruments were designed to be administered pre- and post-intervention. In addition, students completed two reading comprehension assessments developed by the Educational Testing Service (ETS): Pre-intervention all students completed the Reading Inventory and Scholastic Evaluation ( (RISE) (Sabatini, Bruce & Steinberg, 2013), a test of basic reading comprehension skill components. Post-intervention all students completed the Global Integrated Scenario-Based Assessment (GISA) (Sabatini & O’Reilly, 2015), a test of comprehension from multiple texts. The GISA tapped reading and reasoning skills applied to science information resources but in a format that was less similar to the intervention instruction. Thus, the GISA assessment reflects a far transfer test relative to the intervention and the EBA. Evidence-based argument from multiple texts. The Project READI science and assessment teams designed the evidence-based argument assessment (EBA) to closely align with the text-based inquiry intervention. The assessment consisted of a set of five texts that students were to read and then use to complete four tasks, with the texts present. The tasks all involved understanding an explanatory model that could be constructed from the information provided in the text set. We developed text sets and corresponding tasks on two topics (skin cancer and coral bleaching), allowing us to counterbalance within classroom so that a student completed the assessment on different topics at pre and post (Goldman, Britt, Lee, Wallace, & Project READI, 2016b). The selection of these two topics was the result of several rounds of piloting different topics that were related to biological sciences but that were not taught directly in either the
Text-based Explanatory Modeling in Science
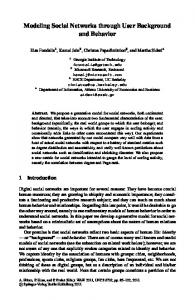
32
Intervention or the Control classrooms. Pilot testing indicated that the skin cancer and coral bleaching topics and the text sets provided were manageable by ninth grade students enrolled in biology. However, piloting also indicated that the two topics were not equal in difficulty, that students provided less complete answers the second time they saw the same topic, regardless of which topic it was, and that they did not see the point of doing the same tasks on the same topic a second time. Given that there are statistical procedures that can take differential difficulty of the two topics into account in analyses, we implemented a within-classroom topic by time of assessment counterbalancing plan for the skin cancer and coral bleaching topics rather than have students complete exactly the same tasks on the same topics at pre and post. The text set for each topic consisted of one text that provided background information about the topic plus four texts, one of which was a graph. Each text set was designed so that constructing the model required reading and synthesizing information across the multiple texts in the set. The text set contained information needed to answer a prompt that asked for an explanation of a phenomenon associated with the topic. Figures 2a and 2b are representations of the linked network of states and events derived from the information in the text set for skin cancer (a) and for coral bleaching (b). These reflect representations of explanatory models that provide complete and coherent responses to the prompt based on the information in the text set for the topic. Figure 2a, 2b about here Prior to beginning the EBA assessment, students rated how much they knew about coral bleaching or skin cancer, depending on the topic they were assigned, using a Likert-type scale with 1 = I do not know anything and 6 = I know a lot. The very brief nature of the prior knowledge assessment reflected time constraints for the pre and post assessments and that we
Text-based Explanatory Modeling in Science
33
wanted to maximize the time students had to read and complete the EBA tasks. The self-reported topic prior knowledge ratings were used to statistically control for differences in prior knowledge when examining the effects of the Project READI Intervention relative to the Control group. The task instructions prior to reading informed students that one purpose of reading in science was to understand why and how science phenomena happen. The instructions stated that students were to read the source materials provided in their packet to help them understand and explain For skin cancer: what leads to differences in the risk of developing skin cancer. For coral bleaching: what leads to differences in the rates of coral bleaching. For both: While reading, it is important to show your thinking by making notes in the margins or on the texts. You will be asked to answer questions and use specific information from the sources to support your ideas and conclusions. The instructions also specified that the information sources could be read in any order but that they should read the sheet called Background: Skin Damage or Coral Bleaching, depending on their topic, because it provided general information on the topic. Four task types were used to assess students understanding of the explanatory model and were to be completed in the following order. This order was intended to minimize students using information from the later tasks in the earlier tasks. 1. The essay task asked students to express the explanatory model in words or visuals. 2. The multiple choice task presented students with nine items that tapped connections among elements in the model, some of which had to be inferred. Four alternative answers were provided for each question and students selected one.
Text-based Explanatory Modeling in Science
34
3. The peer essay evaluation task presented students with two explanations (attributed to fictitious students). The essays were constructed to contrast on six criteria important to evaluating the adequacy of models of science phenomena: relevance (staying on topic), coherence (connecting concepts to the final outcome), completeness (stating both initiating factors), the importance of sourcing, mentioning the graph from the text set, mentioning a concept tied to the graph in the text set. Each peer essay adequately addressed only three of the criteria. This design meant that each essay met three of the criteria of an explanatory model. The criteria lacking in one were present in the other. This design was adopted based on pilot data indicating that this strategy yielded the most informative student responses from which to infer which criteria students were considering in their evaluations. 4. The graphical model comparison task asked students to decide which of two graphical depictions of possible explanatory models was more adequate and why. Students selected one of the models and wrote short explanations of the basis of their evaluations. Of the four tasks, the multiple choice task required the least amount of language production and thus came closest to traditional standardized testing methods of assessing reading comprehension. The essay task required students to organize and express their thinking about the explanatory model, thereby assessing comprehension and production at the same time. Neither the multiple choice nor the essay task required students to critique or evaluate models of the phenomenon. That was the purpose of the peer essay evaluation and the graphical model comparison tasks.
Text-based Explanatory Modeling in Science
35
The instructions for the four task types all included statements indicating that students could refer to the set of texts they had been provided to answer the questions. Appendix C contains the complete set of instructions for reading and the four task types. Coding and scoring of the EBA tasks. Coding and scoring for each task is described. . Scoring ranges and reliability of coding are reported in Table 9. Coding and scoring of all measures was conducted with the condition and time of test (pre or post) blinded. For details of the process used to establish reliability in scoring see Goldman, Greenleaf, & YukhymenkoLescroart, 2016b. Note that disagreements among coders were resolved through discussion. Table 9 about here. Essays. The essays were scored to determine the number of concepts (rectangles in Figure 2) and the number of connections (arrows in Figure 2) that students included in their essays (Hastings, Hughes, Blaum, Wallace & Britt, 2016; Wiley et al., 2017). The essays were coded on a sentence-by-sentence basis to identify all concepts nodes and all connections between concepts. Multiple choice. Each item was scored as correct or incorrect. Individual student scores ranged from 0 to 9 and were recorded as percent correct. Peer essay evaluation. The peer essay evaluation justification scores indicated how many of the six variables were mentioned across the two peer essays. A score of 1 was given for a variable if the student correctly wrote about the variable in at least one of the essay evaluations (e.g., correctly noting that the variable was present in the essay or correctly noting that the variable was absent). Graphical model evaluation. The justification of the model evaluation item was scored as a 1 or 0 based on a brief rubric of acceptable answers. The language in the justification of the selection of the better model had to include some variant of the following options: steps, step-by-
Text-based Explanatory Modeling in Science
36
step, order, cause and effect, the way it’s organized, process, chain reaction, how they connect to each other. Descriptive statistics for the peer essay evaluation and the graphical model evaluation tasks, indicated wide variation in scores within each group and minimal differences in central tendency measures between groups and across time. No additional analyses of these two measures are reported in this paper. Science epistemology survey. A subset of the Project READI team developed and validated this scale over the first four years of Project READI to specifically assess various dimensions of epistemology related to text-based science inquiry from multiple sources (Salas et al., 2016). Several iterations of piloting resulted in a final set of 18 items constituting two scales reflecting the nature of science knowledge: Complex/uncertain (seven items; e.g., “Most scientific phenomena are due to a single cause”; “The best explanations in science are those that stick to just the one major cause that most directly leads to the phenomena.”) and Integration/corroboration (11 items; e.g., “To understand the causes of scientific phenomena you should consider many perspectives.”; “Getting information from multiple sources is important when trying to explain the causes of scientific phenomena.”; “You should consider multiple explanations before accepting any explanation for scientific phenomena.”). Students endorsed the items using a scale ranging from 1 = strongly disagree to 6 = strongly agree. For each student 18 scores were recorded for analyses, with higher ratings reflecting more normative beliefs about the nature of science knowledge. Science self-efficacy survey. Nietfeld et al., , Cao, and Osborne’s (2006) self-efficacy scale was adapted to align with the science domain and piloted during the year preceding the efficacy study reported in this paper.
Text-based Explanatory Modeling in Science
37
The resulting scale contained six items measuring students’ confidence to learn and perform well in science (e.g., I am sure I could do advanced work in science). The scale employed a 5-point Likert-type response scale with option labels for the middle and both endpoints 1 = nothing like me; 3 = somewhat like me; 5 = exactly like me. Each student contributed one rating for each item with higher ratings reflecting higher confidence in doing science. Basic comprehension skills assessment. At the beginning of the school year, students completed the RISE, an assessment of basic reading skills (e.g., word recognition, decoding, morphology, vocabulary, sentence processing, efficiency of basic reading comprehension) (Sabatini et al., 2013). This assessment enabled us to examine the impact of the intervention taking into account pre-intervention proficiency on basic reading skills. Reliabilities on the RISE, computed as Cronbach’s alpha for each subtest in each of grades 5 – 10, range from .64 to .98 (Sabatini, Bruce, Steinberg, & Weeks, 2015). ETS staff scored this assessment and returned scores on each subtest and a total score to the Project READI team. Comprehension of multiple texts: GISA. The GISA assessment was developed specifically to tap comprehension of multiple texts using scenarios that pose authentic reading situations (e.g., preparing for a class presentation) (Sabatini & O’Reilly, 2015). Students took this test post intervention using the web-based administration platform. The topic of the GISA, mitochondrial DNA, was specifically developed for the Project READI 9th grade biological sciences intervention. This topic is related thematically to content covered in both the Intervention and Control classes but was not itself a topic that was taught in either of the groups. This GISA form contained an initial assessment of prior knowledge and then assessed a variety of comprehension skills, including literal comprehension and reasoning about information (e.g., students were asked to read and reason about attributes of nuclear and mitochondrial DNA,
Text-based Explanatory Modeling in Science
38
construct a table to indicate whether specific attributes are true of nuclear DNA, mitochondrial DNA, both, or neither). Other items provided inferences and students had to decide if the inference was supported by the text or not. This GISA form also presented the claims of two scientific theories, the evidence that supported each, and asked students to decide which of several presented statements provided additional evidence for each theory. The final task involved reading a short article that presented new evidence. Students were asked to decide which theory the evidence supported and indicate why. All responses on the GISA except the justification for the theory chosen are selected response items. ETS returned total percent correct scores for each individual student to the Project READI team for analyses. Sabatini, O’Reilly, Weeks, & Steinberg (2016) reported that in field tests conducted across a variety of GISA forms and grade levels, Cronbach’s alpha coefficients for the total percent correct score ranged from .72 to .89. Data Collection Procedures: Teachers As depicted in Figure 1, all teachers completed the “pre” assessment survey prior to the start of professional development for the Intervention teachers (early 2014); the “post” assessment occurred at the conclusion of the classroom intervention. Across the schools in the study start dates varied from mid-August to just after Labor Day, leading to variation between districts in when the classroom intervention began and ended. All teachers in both conditions were observed twice during the intervention period. Observations of Intervention and Control teachers from the same district or strata were scheduled within a week of each other. Across teachers, the average time between observations was 108 days (SD = 11, range 93 to 132). In the Intervention classrooms this corresponded to roughly the 4th – 7th week of the intervention implementation for Time-One and the 12th – 17th week for Time-Two (see Table 6). The timing of the Control
Text-based Explanatory Modeling in Science
39
teachers’ post surveys coincided with the timing of the Intervention teachers within their strata and district. Data Collection Procedures: Students The EBA assessment was administered in paper and pencil format over two successive days during the biology class period. For the pretest, the epistemology survey was distributed and completed first (10 minutes) followed by the brief topic knowledge rating for the pretest topic. After completing the topic prior knowledge rating, students each received a folder that contained the relevant texts for their topic arranged in the same order for all students but “clipped” rather than stapled so students could easily manipulate them. The booklets stated the overall task instructions (Appendix C) and indicated that the rest of the first class period was for reading and annotating the texts. Each student’s folder was collected at the end of day one and returned to that student on day two, along with a response booklet that repeated the overall task instructions; specific instructions for each task were included when the task appeared in the booklet. Tasks were organized in a fixed order: essay first, with lined paper provided for writing; multiple choice questions; peer essay evaluation; and graphic model evaluation. For peer essay and model evaluations lined response areas were provided. The last thing students completed was the selfefficacy scale. An additional class period was used for computer–based administration of the RISE reading comprehension test. Post-intervention administration was organized similarly in terms of task order and organization of the materials. Each student worked on the topic they had not worked on at pretest. The GISA was administered via computer within two weeks of completing the EBA post assessment.
Text-based Explanatory Modeling in Science
40
Student pre-intervention data were collected within the first eight weeks of school and post within two weeks of concluding the intervention. To account for the staggered school year start dates, data collection in Control classrooms was coordinated to that of the Intervention classrooms within their district. In all but one case, the Control classrooms completed the assessments later into the year than the Intervention so that any bias introduced by when the test was taken would favor the students in the Control classrooms. For ease of instructional management, all students in each class were administered the assessments, including the RISE and the GISA. Data from students who had not assented to participate in the research study were destroyed prior to analyses. Data Analysis Approaches Preliminary data analyses used exploratory factor analyses (EFA) to examine the validity and reliability of the data obtained from the teacher survey, the classroom observations, and the student surveys. Descriptive statistics (means, standard deviations), tests of between and within group differences, and multilevel modeling were used to evaluate treatment effects. Preliminary analyses. When conducting the EFA of each scale, we followed Tabachnik and Fidell’s (2007) recommendations to remove items whose loadings on a factor fell below .32. Having removed such items, the EFA was rerun. Item loadings on the various scales as well as the variance explained by the scales indicate the validity of the scales (Hair, Black, Babin, Anderson, & Tatham, 2006). Descriptive statistics. For all measures, means and standard deviations were computed and submitted to independent samples t-tests to examine the differences between Intervention and Control groups on pre and post scores. Additionally, paired-samples t-tests examined pre-post differences within each group.
Text-based Explanatory Modeling in Science
41
Multilevel modeling of treatment effects. Teacher survey and classroom observation data were submitted to two-level multilevel models, in which teachers (level-1) were clustered within schools (level-2). Treatment effects were examined for each scale on the teacher survey and each observation construct from the classroom observations. All models controlled for school strata (six levels) and included the pre-score on that scale (grand-mean centered at level 1) or the Time-One score on the specific observation construct. Student data were submitted to multilevel models in which students (level-one) were clustered within classrooms (level-two) and classrooms were clustered within schools (levelthree). The appropriateness of this multilevel model was determined through preliminary analyses that compared the intra-class correlation coefficients (ICCs) at each level for each of three multilevel models. Specifically, the following three models were compared. (a) A 3-level model: students nested within classrooms nested within schools; (b) A 3-level model: students nested within teachers nested within schools; (c) A 4-level model: students nested within classrooms nested within teachers nested within schools. Table 10 shows the ICCs at each level for the two different 3-level models and the 4-level model for performance on the multiple choice and the GISA instruments. (Essay performance showed the same pattern.) When all four levels were considered, the teacher level added little shared variance (ICC = 2.22% and 0.23%), indicating that the ICC at the teacher level was generally low. Therefore, following the recommendations in the multilevel regression literature (e.g., Raudenbush & Bryk, 2002), the more parsimonious three-level model (a) was chosen to proceed with the analyses,. Table 10 about here
Text-based Explanatory Modeling in Science
42
For the multiple choice and essay tasks of the evidence-based argument assessment, treatment effects were initially tested using full models that covaried pre-intervention scores on the outcome measure (e.g., multiple choice or essay performance), topic prior knowledge, the two epistemology scales, and the self-efficacy scale (each grand-mean centered). Additionally, the full models controlled for school strata (six levels), topic, and the interaction of topic by pretest score on the outcome measure. The inclusion of topic and the interaction addressed the difference in difficulty of the two assessment topics. For the GISA performance, we used a similar approach to the modeling, except that there was no topic prior knowledge variable and the RISE was used as the pre-intervention comprehension measure. The analyses were performed using HLM 7 Hierarchical Linear and Nonlinear Modeling software version 7.02 (Raudenbush, Bryk, & Congdon, 2016). All multilevel models were random intercepts models. We first tested full models, followed by removing non-significant covariates and testing these trimmed models, the results of which are reported in this paper. Sample sizes for analyses of the various measures were based on the total number of participants who provided data for that measure and are indicated when reporting the results. For the EBA assessment analyses, only participants who were present for both the two-day pre and two-day post administrations were included. The resulting sample consisted of 964 students (567 Intervention and 397 Control) from 95 classrooms (48 Intervention and 47 Control) in 24 schools (12 Intervention and 12 Control) and 48 teachers, 24 in each condition. Results The first section of the results reports the preliminary factor analyses that were conducted to establish the validities and reliabilities of the survey and observation scales. The organization of the remainder of the results reflects the theory of change guiding the project: Teachers need to
Text-based Explanatory Modeling in Science
43
provide opportunities for students to learn the knowledge, practices, and dispositions that constitute the intended outcomes of the Project READI intervention. Accordingly, research question two is addressed first to examine the impact of the professional development learning experiences and implementation of the intervention on the teachers. The Intervention and Control teachers are compared on the self-report surveys completed at the conclusion of the intervention, taking into account responses prior to the start of any professional development. The observations of classroom practices are informative regarding the nature of instruction over the course of the semester from the perspective of similarities and differences between Intervention and Control groups as well as changes over the semester within groups. The relationship between the surveys and observations of practice provide information regarding the validity of the teachers’ selfreports of practices. Research question one concerns impacts on students of participating in the intervention and is addressed through comparisons of post-intervention performance on the evidence-based argument tasks, and comprehension of multiple texts as assessed by the GISA, taking into account pre-intervention performance. Preliminary Analyses: Teacher Survey The EFA of each administration of the teacher survey resulted in the removal of 15 items because their factor loadings were below .32 (Tabachnik & Fidell, 2007). Table 7 indicates the scales from which the items were removed as well as the reliabilities for each scale. EFAs were then rerun on the 56 remaining items. Appendix D, Table D1 reports the number of items that loaded on each scale, the range of the factor loadings, and the variance explained by the scale for pre and post administrations. In addition, EFA indicated that five of the six scales that focus on teachers’ practices loaded on a single higher-order Teacher Practice factor. Factor loadings of the
Text-based Explanatory Modeling in Science
44
scales on this higher-order factor ranged from .63 to .86, explaining 51.3% of the variance for the pre score and from .86 to .88, explaining 74.2% of the variance for the post score. Reliability estimates for the higher-order Teacher Practice factor were .83 for pre and .93 for post administrations. Preliminary Analyses: Classroom Observations For purposes of contextualizing the meaning of the quantitative analyses of the rubric scores, qualitative descriptions of the Intervention and the Control teachers’ classrooms were derived from the fieldnotes taken during the observations. For each teacher observation, summaries based on repeated readings were constructed for three aspects of classroom instruction: science topics and materials in use, instructional and teacher activities, and student activities. Rubric scores for each of the indicators within each construct (Table 8) were submitted to EFAs. Results indicated that factor loadings were within acceptable ranges (Tabachnick & Fidell, 2007) for each of the six constructs: the Time-One range was .37 - .97; the Time-Two range was .69 - .97. Indicators within each construct explained 51.4% to 87.0% of the variance at Time-One and 61.9% to 89.1% at Time-Two. Estimates of internal consistency reliability (Cronbach’s alphas) ranged from .77 to .95 at Time-One and .86 to .93 at Time-Two. The factor loadings and estimates of internal consistency suggested that it was reasonable to calculate one mean rubric score for each construct for each time point. Details of the results of the factor analyses and reliability data are provided in Appendix D, Table D2. Preliminary Analyses: Science Epistemology Survey EFAs of the epistemology survey showed two distinct factors that corresponded to the a priori 11- item Corroboration scale and 7-item Complex/Uncertain scale. Factor loadings for the 11 items on the Corroboration scale ranged from .41 to .60 (Cronbach’s alpha = .80) for pre-
Text-based Explanatory Modeling in Science
45
scores and from .44 to .72 (Cronbach’s alpha = .84) for post-scores. Factor loadings for Complex/Uncertain ranged from .43 to .56 (Cronbach’s alpha = .70) for pre-scores and from .43 to .58 (Cronbach’s alpha = .72) for post-scores. Overall, the two subscales explained 27.73% of the variance for pre-data and 33.09% for post-data. Detailed results are available upon request. Preliminary Analyses: Self-Efficacy Survey Exploratory factor analyses on the Self-Efficacy scale indicated a single factor solution. At pretest, factor loadings ranged from .63 to .76 (Cronbach’s alpha = .86) and explained 50.47% of the variance; at post loadings ranged from .68 to .78 (Cronbach’s alpha = .87), and accounted for 54.15% of the variance. Comparisons of Intervention and Control Teachers: Surveys The mean scale scores of the teachers assigned to the Intervention as compared to those assigned to the Control group were not significantly different prior to the initiation of professional development for the Intervention teachers. The descriptive statistics and t-tests for these data are provided in Appendix E, Table E1. In contrast, the posttest comparisons, provided in Table 11, indicate that teachers in the Intervention scored significantly higher than those in the Control condition on Higher-order Teaching Practices as well as on each of its components, with large effect sizes (1.34 < d > 2.00). As well, Intervention teachers indicated that they provided a variety of science reading opportunities more frequently than the Control teachers reported doing so, also with a large effect size, d = 1.37. On attitude, self-efficacy, and teaching philosophy, differences between the teacher groups were not statistically significant, although Intervention teachers’ means tended to be higher than those of the Control. Cohen’s d effect sizes were small, ranging from .29 to .51. Table 11 about here
Text-based Explanatory Modeling in Science
46
The multilevel modeling for the survey scales confirm this pattern. Specifically, the science reading opportunities scale accounted for 68.0% of the variance at the teacher level and 3.8% at the school level. The model for higher-order teacher practice accounted for 41.0% of the variance at the teacher level and 77.8% at the school level. Variance explained by the individual teacher practice scales that loaded on the higher-order factor ranged from 19.8% to 50.2% at the teacher level and from 53.5% to 82.3% at the school level. After controlling statistically for school strata (six levels) and pre-scores on the scales, there were significant treatment effects for these same scales, with effect sizes that treatment ranged from 1.34 to 2.24, indicating large effects (Elliot & Sammons, 2004). These results are shown in the upper panel of Table 12. Of particular note is the effect size for students engaging in metacognitive inquiry. Table 12 about here Comparisons of Classroom Observations of Intervention and Control Teachers: Descriptive Accounts Topics and materials in use. During Time-One observations, five Intervention teachers were implementing the Reading Science Models module; five were engaged in activities focused on cell structure and function using the Project READI recommended text sets while five were using other texts; seven teachers were engaged in implementing the Homeostasis module; one teacher was doing a lab about cell structure and one teacher had students using the biology textbook to review for a quiz. At Time-Two, most teachers (17) were implementing the MRSA module but two were finishing the Homeostasis module. An additional four teachers were also working on evolution although they were using materials outside of those Project READI had provided (e.g., webquest, labs, district curriculum texts). Finally, one teacher was reviewing material for the end of semester biology exam.
Text-based Explanatory Modeling in Science
47
Control teachers were using the materials they typically used in teaching 9th grade biological sciences, such as text books, study guides, and powerpoint presentations. At Time-One, eleven control teachers were engaged in activities about cell structure and function; ten were focusing on ecology and ecosystems; two were working on writing lab reports using the scientific method and one teacher was covering atomic structure. At Time-Two, most teachers were engaged in activities about evolution and genetics (12) or ecology and ecosystems (9). Three teachers’ classes were focused on other topics: citing sources in research papers, a movie related to bio-chemistry, or extra-credit assignment completion. Instructional activities. In the Intervention classrooms, the predominant mode of classroom instruction was a mix of teacher directed activity (setting up the activity of the day, modeling a think aloud, introducing a new practice such as building an explanatory model, etc.) and student collaborative activity (i.e., metacognitive conversations around text, peer review). This mix was present during both observations. In the Control classrooms, the predominant mode of observed classroom instruction at both Time-One and Time-Two was teacher-lecture and powerpoint presentation of material. The lectures and powerpoints were, for the most part, shortened versions of the biology textbook content. Typically, teachers read the content of the slides verbatim. As the teacher presented the information, students were responsible for listening, taking notes, and completing study guides or worksheets. Teacher presentation was usually followed by whole class discussion that followed the traditional Initiate-Respond-Evaluate (IRE) monologic pattern in which the teacher asks a question, calls on students until the desired response is provided, affirms the answer, and then moves on to the next question (Cazden, 1988; Mehan, 1979; Wells,1989). Partner talk and small discussion groups were observed in three teachers classrooms. Infrequently, students were
Text-based Explanatory Modeling in Science
48
directed to search online using websites such Webquest, TedTalk, and YouTube, for information on teacher-designated science topics. Student activities. The student activities observed in the Intervention classrooms were similar during the two observations and reflected the use of Project READI-provided “readers” and student notebooks for the various modules. As indicated in the description of the student intervention design, the texts in the module readers included multiple representations (verbal text, graphs, diagrams, etc.) and were used in service of inquiry around a driving question. Teachers supported students’ by modeling thinking aloud, reminding students about support tools (e.g., reading strategy charts and science talk stems), or engaging them in metacognitive thinking (e.g.. What do I already know?; What questions do I have?). At Time-Two compared to Time-One there was greater emphasis on supporting students activities of using the information in the readers to construct models and evaluate them for their coherence and completeness. During both observations in the Intervention classrooms, collaborative meaning making of text in pairs or small groups was the dominant participation structure. Whole group discussion occurred after students had the opportunity to read and problem solve on their own. During reading time, teachers circulated among the pairs or small groups, listening and interjecting questions asking for elaboration (e.g., What else can you say about that? Why do you think that?), additional problem solving (e.g., How do you think you could figure that out? What source might help you understand that?), or evaluation of the completeness or coherence of the explanatory model, the science phenomenon, or their own understanding. Finally, in the classrooms of two different Intervention teachers, one at Time-One and the other at Time-Two, students were reading from their biology textbook to answer questions and fill out a study packet.
Text-based Explanatory Modeling in Science
49
In the Control classrooms, observed student activities were similar during the two observations although different from the student activities observed in the Intervention classrooms. In the Control classrooms, students were observed reading their science textbooks to complete activity sheets and lab reports. Occasionally, a student was asked to read orally from the textbook or to read independently from teacher-prepared “study packets” that highlighted material they needed to know. These included a variety of representational forms (e.g., verbal text, graphs, and tables). With two exceptions, little to no teacher support of the reading was observed. That is, students were told to read independently or for homework but without supports or modeling of how to read and reason about the information to make sense of it. The exceptions were two teachers who had students annotating texts and who talked with students about comprehension monitoring. When reading assignments were evaluated, it was through completion of activity sheets. Comparisons of Classroom Observations of Intervention and Control teachers: Observation Scores At both Time-One and Time-Two, there were significant differences between Intervention and Control teachers on all six constructs, with large effect sizes. Table 13 provides the means and independent sample t tests, and effect sizes for the rubric scores for each of the six constructs at each of the time points (Time-One upper panel; Time-Two lower panel). Consistent with the descriptive findings, Intervention teachers’ classrooms achieved higher score points than the Control teachers’ on each of the constructs. Furthermore, the differences between the two groups of teachers increased for the Time-Two observation. This is reflected in larger effect sizes at Time-Two compared to Time-One. Differences at Time-One are not surprising because the Intervention teachers had had nine days of professional development prior to beginning the Fall,
Text-based Explanatory Modeling in Science
50
2014 semester. Thus, the Time-One differences indicate that students in the classrooms of teachers in the Intervention group were indeed experiencing instruction and opportunities to learn that were substantively different from what the Control students were experiencing; these differences increased as the semester progressed. Tables 13 & 14 about here Within-group analyses of the Time-One and Time-Two scores, reported in Table 14, indicate increases for all constructs among the Intervention teachers. Differences met conventional levels of statistical significance for two constructs, Construct 2: Support and Construct 6: Collaboration. For the Control teachers, scores on each construct trended lower at Time-Two than at Time-One, although none of these differences reached conventional levels of statistical significance. In the multilevel model, the higher order observation rubric scores accounted for 48.8% of the variance at the teacher level and 84.0% of the variance at the school level. The model for the higher order score yielded a significant treatment effect indicating that these scores at Time-Two were significantly higher for Intervention as compared to Control teachers (Table 12, lower panel). The multilevel modeling results for each of the individual observation construct scores also showed significant treatment effects, with β coefficients ranging from .42 to .98, indicating medium to large effect sizes (range = .65 to 1.49). The largest effect size was for Construct 1: Science reading opportunities; the smallest was for Construct 5: Argumentation. Relationships between survey and observation data. To determine whether the selfreport survey data were consistent with the observed practices, we examined the relationships between individual teacher’s scores on the self-report higher-order teacher practices construct and the higher order scores for the observation constructs. Figure 3 shows the scatterplots for this, with
Text-based Explanatory Modeling in Science
51
3a showing the relationship between the survey completed prior to any professional development (pre) and the Time-One observation, which occurred between the 4th -7th weeks into the implementation of the intervention; 3b shows the relationship between the survey completed at the conclusion of the intervention and the Time-Two observations, which occurred between the 12th – 17th weeks of the intervention implementation. What is noteworthy is that at Time-One, the Intervention and Control groups are indistinguishable in terms of how they are distributed across the two-dimensional space, yielding a nonsignificant Pearson r(41) = .17, p = .274. However, at Time-Two, the scatterplot in Figure 3b suggests a much more distinct separation between the two groups on both the self-report and the observation measures, providing an overall significant correlation, r(45) = .50, p < .001. These patterns indicate consistency between what teachers reported they were doing in the classroom and what they were observed to be doing and provide evidence of the validity of the self-report responses. They also indicate movement on the part of the Intervention teachers toward more Project READI - consistent practices and ways of talking about them. Figures 3a and 3b about here Comparisons of Intervention and Control Students: Evidence-Based Argument Assessment The descriptive statistics for the multiple choice, essay, topic prior knowledge, epistemology and self-efficacy scales are provided in Table 15. With the exception of one scale (Complex/Uncertain), there were no significant differences in mean performance between the Intervention and Control groups before intervention (upper panel). On the Complex/Uncertain scale the Control group scored significantly higher than the Intervention group at the p = .03 level. Thus with the exception of the single epistemology scale, the randomization procedure resulted in groups that were performing at statistically equivalent levels on the multiple choice and essay tasks
Text-based Explanatory Modeling in Science
52
as well as the self-report measures of topic prior knowledge, corroboration, and self-efficacy prior to the intervention. Table 15 about here Post-intervention, the descriptives in the lower panel of Table 15 indicate significantly higher performance on the multiple choice task for the Intervention group (56% correct) compared to the Control group (51% correct). On the essay task, the Intervention group means were higher than those of the Control but the differences were not statistically significant. In addition, post intervention, there were no statistically significant differences between intervention and control groups on topic prior knowledge, epistemology or self-efficacy scales. Note, however, that analyses of the overall main effect of topic and the interaction of topic and time of test were significant: performance on the skin cancer topic was higher than on coral bleaching for both multiple choice and essay measures. Thus in conducting the multilevel modeling to evaluate the effects of the intervention, we statistically controlled for differences among students due to the testing time at which they had each topic. Multilevel modeling of multiple choice. The trimmed model for the multiple-choice performance post-intervention, shown in Table 16, explained 18.18% of the student-level variance, 76.92% of the classroom-level variance, and 96.62% of the school-level variance. This model yielded a significant treatment condition effect (β = 5.71, p = .010, ES = 0.26). In addition and not surprisingly, performance on the multiple choice task prior to the intervention was a significant predictor of performance post-intervention, with a large effect size of 1.03. As well, pre-intervention scores on the Epistemology scales (Corroboration, and Complex/Uncertain), were significant predictors of post multiple choice performance, indicating that students who held more sophisticated epistemological beliefs at the start of the school year scored higher on the post-
Text-based Explanatory Modeling in Science
53
intervention multiple choice measure. Finally, as anticipated based on the pilot data, whether students had the more difficult topic at pre versus post (indicated in the topic x multiple choice interaction term) significantly predicted post intervention performance. However, this interaction does not compromise the interpretation of the significant treatment effect because the same counterbalancing scheme was used in the Intervention and Control classrooms. Thus, taking into account individual differences prior to the intervention, students in the Intervention condition performed significantly better than those in the Control condition on the multiple choice task. Table 16 about here Multilevel modeling of essay performance. The results of the trimmed model for the concept nodes are provided in the upper panel of Table 17 and for connections in the lower panel. The final model for nodes accounted for 21.56% of the variance at the student level, 48.77% of the variance at the classroom level, and 99.92% at the school level. The trimmed model for connections accounted for 7.04% of the variance at the student level, 39.6% at the classroom level, and 99.99% at the school level. Treatment condition did not significantly predict post-intervention performance on either node or connection inclusion in the essay. This is consistent with the nonsignificant differences in the means for the two groups (Table 15). Individual differences at pretest associated with topic prior knowledge, the corroboration epistemology scale, and the self-efficacy scale were significant predictors of the inclusion of concept nodes in the essays, along with pre-test performance on this outcome measure. We found a similar pattern with the connections that were included in the essays: a nonsignificant condition effect and the same variables entering as significant predictors. among the surveys scales completed at the beginning of the semester. Table 17 about here. Comparisons of Intervention and Control Students on Multiple Text Comprehension: GISA
Text-based Explanatory Modeling in Science
54
Descriptive statistics for percent correct out of total items on the GISA indicated higher performance for the Intervention group (M = 59.60, SD = 16.24, n = 519) compared to the Control group (M = 56.38, SD = 17.22, n = 333). The multilevel model that was used to test for the significance of the treatment on GISA performance controlled for strata (six levels) and included the RISE assessment of basic reading comprehension, the pre-intervention scores on the two epistemology scales and the self-efficacy scale. Note that on the RISE, there were no statistically significant differences between Intervention (M = 272.48, SD = 13.27, N = 507) and Control (M = 271.42, SD = 14.09, N = 388) groups at the beginning of the school year. The results of the modeling (Table 18) showed that treatment condition emerged significant (β = 4.41, p = .038, ES = 0.32) with Intervention students scoring higher on the GISA than Control students. Table 18 about here Discussion The findings of the present study indicate that participating in the Intervention condition as compared to typical instruction in ninth grade biology impacted teachers’ practices and student performance in ways consistent with the Project READI approach and goals of the designed intervention. Impact on Students With respect to students, comparisons of those in Intervention classrooms to those in Control classrooms indicated significantly higher performance on the comprehension of science information from multiple texts. That is, there were significant differences favoring the Intervention group on the multiple choice task of the EBA assessment and on the GISA assessment of comprehension from multiple texts. Performance on these assessments required students to read and reason about biological sciences topics (skin cancer, coral bleaching,
Text-based Explanatory Modeling in Science
55
mitochondrial DNA) that had not been part of the curriculum for either group of students. Thus, the results indicate that students in the Intervention classrooms were better equipped than those in the Control classrooms to tackle new material in the biology domain. The magnitude of the effect sizes qualifies as small from a statistical point of view (.26 for the multiple choice task and .32 for the GISA). From a practical point of view, estimates of the magnitude of change associated with one year of reading growth at the high school level are .19 (Hill, Bloom, Black, & Lipsey, 2008). Thus the effect sizes in the present study suggest that the Intervention students were about 1.5 years ahead of the Control students after participating in the intervention. On the other hand, the Intervention students’ inclusion of concepts and connections in the written essay task were not significantly different from that of the Control students. We attribute this to insufficient instructional time and support for students to master the rhetorical forms and language structures needed to express explanatory models in written verbal text or visuals. Instructional time was devoted to the oral discourse of science argument, i.e., to talking about explanatory models in small group and whole class discussions (e.g., during homeostasis and MRSA modules). However, more support may have been needed to move from such socially supported oral discourse exchanges to independently constructed written explanations. Similarly, lack of sufficient opportunities to critique models was likely responsible for the failure to find treatment effects on the peer essay evaluation and the graphic model comparison tasks. The model and peer essay evaluation tasks required that students invoke evaluative criteria for models and for written explanations of models. Although these learning goals were introduced during the semester, limited instructional time was devoted to them. Overall, the results of the EBA assessment suggest that the impact on Intervention students was greatest for those learning goals and science practices that students had worked on
Text-based Explanatory Modeling in Science
56
iteratively over the four learning phases (Table 6): Close reading of a variety of the representational forms of science information for purposes of understanding key content ideas and how they might be synthesized and connected to make evidence-supported explanatory claims about phenomena in the biological world. However, students appear to have needed additional instruction in, support for, and opportunities to express their ideas in independently produced written essays and to develop criteria and language frames for writing critiques of representations (pictorial models or verbal representations) produced by others. These findings and interpretation are consistent with prior research regarding the critical need and importance of providing writing instruction and scaffolds that make the rhetorical forms of science communications explicit to students (Akkus, Gunel, & Hand, 2007; Hand, Wallace, & Yang, 2004; Songer & Gotwals, 2012). The significant treatment effects on the multiple choice EBA task and on the GISA were obtained after taking into account pre-existing differences among students on individual differences variables known to affect comprehension performance, including prior knowledge of the topic (Alexander, 2003; Cervetti & Wright, in press), epistemological orientations to the topic (e.g., Ferguson & Bråten, 2013; Kienhues, Ferguson, & Stahl, 2016; Sandoval, 2016) selfconfidence in reading (e.g., Guthrie et al., 1996; Wigfield & Guthrie, 1997) and not surprisingly performance on the outcome task prior to any intervention, (e.g., the multiple choice preintervention performance). It is hardly surprising to find that those students who were better at this task prior to intervention continued to be better post intervention and indicates that the treatment did not significantly disrupt the “rank ordering” so to speak among the students. This does not however mitigate the significance of the treatment condition effect; it added value over and above that predicted by performance levels prior to the intervention.
Text-based Explanatory Modeling in Science
57
The RISE test of basic reading skills emerged as a significant predictor of multiple text comprehension as assessed on the GISA. This finding is consistent with the conceptual model of single and multiple text reading and reasoning processes that served as the basis of the learning goals of the Project READI approach in science (Table 2). Students with stronger basic skills as measured by the RISE performed at higher levels on the GISA. The significant treatment effect on the GISA after controlling for basic reading skills indicates that the intervention enhanced performance on multiple text comprehension beyond what typical instruction is predicted to produce. The predictive relationships between the pre- and post-interventions for both the highly aligned and the less aligned assessments of comprehension from multiple texts indicate that, not surprisingly, it does indeed matter where students start. More importantly, these relationships indicate that the impact of the Intervention is robust enough to “survive” (have a positive impact on performance) despite the individual differences in starting points. We speculate that the positive impact of the Intervention was related to ways in which teachers adapted the Project READI approach and materials to the range of students they were teaching. Systematic investigation of adaptations was beyond the scope of the present study but is clearly an issue and area in need of further study. Although there was little change within groups from pre to post intervention and no significant differences between groups on the epistemology or the self-efficacy scales at post, the epistemology scale pre-intervention ratings did emerge as significant predictors in the multi-level modeling of the post-intervention multiple choice task and of GISA performance. Furthermore, the corroboration scale at pre was a significant predictor of the inclusion of concepts and connections for the essay task. Essentially, these findings suggest that performance on the post-
Text-based Explanatory Modeling in Science
58
intervention outcome measures was higher for those students who began the semester holding more sophisticated beliefs about the nature of science (Complex/Uncertain scale) and/or more strongly agreed with the need to cross-validate information and data when constructing explanations of science phenomena (Corroboration scale). These findings are consistent with prior research that has found significant relationships between epistemic beliefs about a domain or topic and performance on a variety of multiple text comprehension tasks (e.g., Brâten et al., 2008; Ferguson & Brâten, 2013; Strømsø et al., 2008).
Impact on Teachers With respect to the impact on teachers of participating in the Intervention, the significant changes in the constructs on the self-report survey and the observation protocol indicate that Intervention teachers did in fact change their instructional practices over the course of the professional development and intervention in their classrooms. Classroom observations validated the self-reports of the Intervention and Control teachers and support the claim that over the course of the intervention, observable practices and instructional routines in the classrooms of the Intervention teachers were more aligned with those central to the Project READI approach than they were at the beginning of the semester. These findings lend credence to the theory of change that guided the overall design of the present study. Specifically, we posited that teachers determine what students have opportunities to learn. Students in the Intervention classroom were indeed experiencing instruction that was different from what was happening in the Control classrooms, while at the same time all teachers were adhering to similar within-district mandates on topic coverage.
Text-based Explanatory Modeling in Science
59
The relationships between the higher-order observation practices construct and the higherorder self-reported practices construct shown in the scatterplots (Figure 3) indicate that prior to the professional development for the Intervention teachers, teachers who were assigned to the Intervention condition were indistinguishable from those teachers randomly assigned to the Control condition. In contrast, the scatterplot based on post-intervention surveys and Time-Two observations suggests movement toward two distinct samples of teachers. At the same time, it is important to note the lack of significant differences on attitude, self-efficacy, and teaching philosophy for both Intervention and Control teachers on pre and post intervention surveys. A plausible explanation for the lack of differences on these scales is that the time frame of this study was simply insufficient to impact these perspectives. There is quite a bit of debate in the research on teacher change regarding the relationships between changes in instructional practices and shifts in beliefs, attitudes, or perspectives about effective practices and confidence in one’s ability to execute such practices (e.g., Berliner, 2001; Borko & Putnam, 1996; Pajares, 2009; Hammerness et al., 2005; Rokeach, 1968). The present study suggests that changes in practice may be visible prior to evidence garnered through surveys about attitudes and beliefs. Nevertheless, the self-report surveys and classroom observations indicate that the Intervention teachers shifted their practice to be more aligned with the Project READI approach and its emphasis on socially supported reading, reasoning and argument based on information presented in multiple information resources. Further, as posited in our theory of action, these differences in instruction aligned with Intervention students’ performance on the assessments. That is, instruction over the Intervention semester provided iterative opportunities for students to deepen their mastery of the first three learning goals: close reading, with metacognitive awareness; analysis and synthesis of information across multiple information resources, and
Text-based Explanatory Modeling in Science
60
constructing arguments to explain phenomena. The later modules in the Intervention added to these three by introducing justification and critique of explanatory models. However, students had comparatively fewer opportunities to engage in the reading and reasoning processes of justification and critique. Implications: Classrooms as Complex Systems One rather unexpected finding that emerged in the course of carrying out the multilevel modeling supports a conception of classroom learning as constituting a complex system. Specifically, the multi-level modeling of the student performance indicated that more variance in outcomes was associated with the classroom level of clustering than with the teacher level of clustering. This finding suggests that the types of changes in instructional practices called for by the Project READI approach require changes in the classroom culture – in the expectations, responsibilities, and ways of participating in the teaching and learning process for both teachers and students. That is, teachers and students constitute a sense-making system the processes of which are dynamic and interactive, with products or results that vary far more widely that those in teacher-directed classrooms. Sense-making proceeds through grappling with ideas – independently, peer to peer, among peers with and without teacher input. Talk plays a central role in such classrooms but it must be productive talk for building knowledge and engaging in knowledge generation (e.g., Engle & Conant, 2002; Michaels & O’Connor, 2017; Resnick, Asterhan, & Clarke, 2015). Such activity depends on the existence of a classroom community that values and respects what students and teachers bring and contribute to the learning environment. Processes and outcomes emerge through such interactions and over time, much as they do in other types of complex systems (See Jacobson & Wilensky, 2006; Yoon, et al., 2017).
Text-based Explanatory Modeling in Science
61
An important property of complex systems that is particularly relevant to classrooms is that the unexpected occurs and not infrequently. Adaptive systems respond to the unexpected in ways that are productive for the functioning of the system, taking the state of the system into account. Seeing classrooms from a complex-systems perspective is consistent with claims that have been made that teachers need adaptive rather than routine expertise (Darling-Hammond & Bransford 2005; Hatano & Inagaki, 2003). This is so precisely because they are attempting “in the moment” to be responsive to the unanticipated in ways that move learning in productive directions and maintain the involvement and agency of students. This requires flexibility in guiding learning that goes well beyond the skilled execution of instructional procedures and strategies. To support the development of adaptive expertise in teachers, we need to better articulate what teachers need to know (e.g., knowledge of the discipline, the students, how students learn the discipline, how to engage students in productive disciplinary discussions, and how to assess students’ learning progress) and how they come to know it (Grossman, Hammerness, & McDonald, 2009; Lampert, 2010; Shulman, 1986). Limitations and Future Studies Of course, any study has limitations. In the present study some of the limitations are related to the requirements of conducting a randomized control trial in the context of the overall activities of Project READI. As discussed in the conceptual framework for the professional development, the design of the Intervention teachers’ professional development experience reflected a compromise between what the empirical literature indicates are important characteristics of effective professional development and the requirement of RCTs that the participating teachers be randomly assigned to treatment conditions. That is, the Intervention teachers in the RCT presented in this study were teaching with the Project READI approach for
Text-based Explanatory Modeling in Science
62
the first time, but the approach calls for significant shifts in the positioning of texts, tasks, students’ roles as agentive learners in the classroom, as well as teachers’ roles as facilitators of learning. Other research indicates that to make such shifts in practice, it typically takes multiple iterations during which teachers try out new practices, reflect on “how it went” and revise for subsequent classroom iterations (Ball & Cohen, 1999; Penuel, Fishman, Cheng, & Sabelli, 2011; Penuel, Fishman, Yamaguchi, & Gallagher, 2007; Yoon, et al., 2017). In-classroom coaching supplementing “out of the classroom” professional development experiences as well as opportunities to reflect and revise with colleagues can facilitate adaptive shifts in practice (Cochran-Smith & Lytle, 1999; Darling-Hammond & McLaughlin, 1995). The model of professional development that we enacted through the Project READI work leading up to the study reported in this paper, especially the collaborative design teams and the work in the teacher networks (Strands Two and Four) incorporated these features of effective professional development. Over three to four years, we saw evidence of shifts in practice and the emergence of teachers’ generative capacity with respect to instructional routines and modules. That is, after two or three iterations of a module, teachers showed evidence of adaptive integration of the “first principles” of the Project READI approach into their specific instructional contexts (Cribb, Maglio & Greenleaf, 2018; Greenleaf & Brown, 2018; Greenleaf, Litman, & Marple, 2018; Shanahan et al., 2016). However, as described in the participants section of this paper, the one-year time frame of the present study and the need to randomly assign teachers to condition prior to any professional development meant that the Intervention was tested under conditions of first-time implementation by the Intervention teachers. As well, due to the sample sizes that were needed to conduct the multilevel modeling, there were insufficient resources to provide in-
Text-based Explanatory Modeling in Science
63
classroom coaching, or more than two days of professional development during the actual implementation of the intervention. A second limitation of the study is the single-semester time frame of the instruction in which students participated. As noted in discussing the results of the four evidence-based argument tasks, the Intervention did not devote sufficient time to supporting students’ written expression of their thinking about phenomena in the biological sciences. Emphasis was on reading and reasoning from the multiple types of information sources in which biology information is conveyed, and on sense-making through discussion often for purposes of constructing explanatory models of various biological phenomena. Although students did construct various types of visual models and present them orally to their peers, they were infrequently asked to write out verbal descriptions. This is an area where further work is needed. Time constraints also curtailed going beyond surface-level considerations of justification and critique of models, either in terms of revising one’s own model or someone else’s. An important consideration in advancing these practices are occasions in which new evidence does not “fit” the working model, and leads to processes of revision as well as replication, two core features of the nature of science knowledge (Asterhan & Schwarz, 2009; Clement, 2008; Justi & Gilbert, 2002; Mendonca & Justi, 2013; Rinehart et al., 2016) Just as the instructional model was new to teachers, it was new to students. Accordingly, the first six weeks of instruction were typically devoted to establishing reading and sense-making routines for engaging with texts. We speculate that had students been versed in these routines based on prior instructional experiences, further progress would have been made on critique and justification of models through examination of alternative accounts based on the same set of information, consideration of additional data, and other ways in which models come to be questioned and revised or replaced.
Text-based Explanatory Modeling in Science
64
Future studies are needed to look at results for students engaged in such practices of science over multiple years. Finally, the intervention engaged students in “doing school” differently, asking them to take on greater responsibility as well as agency in their own learning processes. In hindsight, it is clear that the student perspective on this intervention is absent. Interviews with students to ascertain their perspectives on the intervention, in terms of what they were learning and how they were learning it would have been very informative. Conclusions Despite the short duration of the Project READI professional development, the first time implementation and the absence of in-classroom coaching, at the end of the intervention implementation, Project READI teachers reported practices significantly more aligned with those called for in the Project READI approach when compared to their own ratings at the start of the professional development and in comparison to the ratings of the Control teachers. Thus, the present study demonstrates that significant shifts in practice can be visible and have an impact on students’ learning even within a one-year time frame, as in this RCT. We caution however that in all of the Project READI classrooms, teachers and students were just getting started with this type of instruction and learning. Additional opportunities for professional development and classroom experiences of this type are needed for teachers and students to more firmly establish these practices of teaching and learning. The positioning of this RCT of the Project READI approach in biological sciences was necessitated by the need to recruit a sufficient sample size of schools and teachers to achieve sufficient power to detect an effect. As noted, across grades 6 – 12 and history, literary reading/literature, and the various sciences, 9th grade biological sciences was the only grade level
Text-based Explanatory Modeling in Science
65
and subject area where this was possible. However, this resulted in a semester-long curriculum that engaged students in sense-making from text, where text is defined as the multiple forms of representation in which biological information is expressed. This sensemaking involved students in the range of practices specified in the NGSS, including asking questions, developing models, interpreting data, constructing explanations, and arguing from evidence as well as the science literacy practices specifically discussed as Practice 8 in the NGSS: Obtaining, evaluating and communicating information (Next Generation Science Standards Lead States, 2013.). The present study demonstrates that when engaging in authentic scientific work, science literacies are integral to all seven practices (e.g., Bricker, Bell, van Horne, & Clark, 2017). Furthermore, the present study provides evidence of the efficacy of text-based investigations in promoting sensemaking with multiple forms of text in service of inquiry to develop explanations and argue for their viability, practices that involve students in nearly all of the NGSS practices. Indeed, there are many topics and phenomena in the sciences where it is simply not feasible and in some cases not possible for students to engage directly with the phenomenon. Thus, we argue that disciplinary reading (and writing) processes are critical to reasoning with, interpreting, and producing the multiple representational forms manifest in the practices and epistemology of science. We therefore view the kind of text-based investigations designed and studied by Project READI as an example of NGSS implementation, one that simultaneously builds students’ capacity to read for understanding in science.
Text-based Explanatory Modeling in Science
66
Endnotes 1
The selection of this grade level and this course content was based on a survey of the courses
that were taught at sixth thru twelfth grade in English language arts/literature, history, and science in the greater metropolitan area of the majority of the Project READI team. The only course taught consistently at the same grade level was biological sciences at ninth grade. 2
Of course, reasoning practices operate on entities and relationships among them. Thus, having a
model to explain the natural world entail entities and interactions among them as part of the model. For example, to explain observed characteristics of matter, it was necessary to posit the existence of atoms, at some point in scientific history. Such entities were then employed in explanatory models. 3
Reasons included changes in school leadership or teaching staff, assessment policies, and
competing initiatives at the school site. 4
One teacher taught only one section. Due to small class size in the sections of another teacher,
we recruited students from three of her classrooms. If a teacher had more than two sections, we randomly selected which two for consenting. 5
Twenty-three students in the Intervention group and fifteen in the Control group provided no
provided no response to the yes/no question “Is English your first language?”
Text-based Explanatory Modeling in Science
67
References Akkus, R., Gunel, M., & Hand, B. (2007). Comparing an inquiry‐based approach known as the science writing heuristic to traditional science teaching practices: Are there differences? International Journal of Science Education, 29(14), 1745-1765. Alexander, P. A. (2003). The development of expertise: The journey from acclimation to proficiency. Educational Researcher, 32, 10–14. Alvermann, D. E., & Moore, D. W. (1991). Secondary school reading. In R. Barr, M. L. Kamil, P. B. Mosenthal & P. D. Pearson (Eds.), Handbook of reading research (Vol. 2, pp. 951-983). New York: Longman. Andriessen, J.E. (2006). Arguing to learn. In K. L. Sawyer (Ed.), The Cambridge handbook of the learning sciences (pp. 443-459). Oxford, UK: Cambridge. Asterhan, C. S. C., & Schwarz, B. B. (2009). Argumentation and explanation in conceptual change: Indications from protocol analyses of peer-to-peer dialog. Cognitive Science, 33, 374–400. Ball, D., & Cohen, D. (1999). Developing practice, developing practitioners: Toward a practicebased theory of professional education. In L. Darling-Hammond & G. Sykes (Eds.), Teaching as the learning profession: Handbook of policy and practice (pp. 3–32). San Francisco: JosseyBass. Bandura, A. (1997). Self-efficacy: The exercise of control. NY, NY: Freeman. Bazerman, C. (1985). Physicists reading physics: Schema-laden purposes and purpose-laden schema. Written Communication, 2, 3-23. Berland, L. K., & Reiser, B. J. (2009). Making sense of argumentation and explanation. Science Education, 93, 26-55.
Text-based Explanatory Modeling in Science
68
Berliner, D. C. (2001). Learning about and learning from expert teachers. International Journal of Educational Research, 35, 463-482. Bill, V., Booker, L., Correnti, R., Russell, J., Schwartz, N., & Stein, M.K. (2017). Tennessee scales up improved math instruction through coaching. The Journal of the National Association of State Boards of Education, 17 (2), 22-27. Borko, H., & Putnam, R. T. (1996). Learning to teach. In D. C. Berliner & R. C. Calfee (Eds.), Handbook of educational psychology (pp. 673-708). New York, NY. Bråten, I., Strømsø, H.I., & Samuelstuen, M.S. (2008). Are sophisticated students always better? The role of topic-specific personal epistemology in the understanding of multiple expository texts. Contemporary Educational Psychology, 33, 814-840. Bricker, L. A., & Bell, P. (2008). Conceptualizations of argumentation from science studies and the learning sciences and their implications for the practices of science education. Science Education, 92, 473–498. Bricker, L. A., Bell, P., van Horne, K., & Clark, T. L. (2017). Obtaining, evaluating, and communicating information. In C.V. Schwarz, C. Passmore, & B. J. Reiser (Eds.), Helping students make sense of the world using the Next Generation Science Standards (pp. 259-281). Arlington, VA: National Science Teachers Association Press. Bromme, R. & Goldman, S. R., (2014). The public’s bounded understanding of science. Educational Psychologist, 49, 59-69. Brown, A. L., & Campione, J. C. (1994). Guided discovery in a community of learners. In K. McGilly (Ed.), Classroom lessons: Integrating cognitive theory and classroom practices (pp. 229-270). Cambridge, MA: MIT Press.
Text-based Explanatory Modeling in Science
69
Bryk, A. S., Gomez, L. M., Grunow, A., & LeMahieu, P. G. (2016). Learning to improve: How America’s schools can get better at getting better. Cambridge, MA: Harvard University Press. Cavagnetto, A. (2010). Argument to foster scientific literacy: A review of argument interventions in K–12 science contexts. Review of Educational Research, 80, 336-371. Cazden, C. B. (1988). Classroom discourse: The language of teaching and learning. Portsmouth, New Hampshire: Heinemann Educational Books, Inc. Cervetti, G. & Wright, T.S. (in press). The role of knowledge in understanding and learning from text. To appear in E. B. Moje, P. Afflerbach, P. Enciso, and N. K. Lesaux (Eds.), Handbook of reading research, Vol. V. NY, NY: Routledge. Chiappetta, E. L., Fillman, D. A. (2007). Analysis of five high school biology textbooks used in the United States for inclusion of the nature of science. International Journal of Science Education, 29, 1847-1868. Chin, C., & Osborne, J. (2010). Supporting argumentation through students’ questions: Case studies in science classrooms. Journal of the Learning Sciences, 19(2), 230–284. Clement, J. (2008). The role of explanatory models in teaching for conceptual change. In S. Vosniadou (Ed)., International handbook of research on conceptual change (pp. 417–452). NY, NY: Routledge. Cobb, P., Confey, J., diSessa, A., Lehrer, R., Schauble, L. (2003). Design experiments in educational research. Educational Researcher, 32, 9–13. Cochran-Smith, M. , & Lytle, S. L. (1999). Relationships of knowledge and practice: Teacher learning in communities. In A. Iran-Nejad & P. D. Pearson (Eds.), Review of research in education (Vol. 24, pp. 249-305). Washington, D.C: American Educational Research Association.
Text-based Explanatory Modeling in Science
70
Cognition and Technology Group at Vanderbilt. (1997). The Jasper Project: Lessons in curriculum, instruction, assessment and professional development. Mahwah, NJ: Erlbaum. Council of Chief State School Officers (CCSSO) (2010). The Common Core Standards for English Language Arts and Literacy in History/Social Studies and Science and Technical Subjects. Downloaded from http://www.corestandards.org. Cribb, G., Maglio, C., & Greenleaf, C. (2018). Collaborative argumentation: 10th graders read modern Iranian history. The History Teacher, 51(3), 477-526. Darling-Hammond, L., & Bransford, J. (Eds.) (2005). Preparing teachers for a changing world: What teachers should learn and be able to do. San Francisco, CA: John Wiley & Sons. Darling-Hammond, L., & McLaughlin, M. W. (1995). Policies that support professional development in an era of reform. Phi Delta Kappan, 76(8), 597–604. Davis, E.A. & Krajcik, J.S, (2005) Designing educative curriculum materials to promote teacher learning. Educational Researcher, 34(3), 3-14. Elliot, K., & Sammons, P. (2004). Exploring the use of effect sizes to evaluate the impact of different influences on child outcomes: Possibilities and limitations. In I. Schagen & K. Elliot (Eds.), But what does it mean? The use of effect sizes in educational research. (pp. 6-24). Slough: National Foundation for Educational Research. Retrieved from https://www.nfer.ac.uk/publications/SEF01/SEF01.pdf. Engle, R. A., & Conant, F. C. (2002). Guiding principles for fostering productive disciplinary engagement: Explaining an emergent argument in a community of learners classroom. Cognition and Instruction, 11, 365 – 395.
Text-based Explanatory Modeling in Science
71
Fang, Z., & Schleppegrell, M. J. (2010). Disciplinary literacies across content areas: Supporting secondary reading through functional language analysis. Journal of Adolescent & Adult Literacy, 53, 587–597. Ferguson, L.E. & Bråten, I. (2013). Student profiles of knowledge and epistemic beliefs: Changes and relations to multiple-text comprehension. Learning and Instruction, 25, 49–61. Ford, M.J. (2012). A dialogic account of sense-making in scientific argumentation and reasoning. Cognition and Instruction, 30(3), 207-245. Garcia-Mila M., & Andersen C. (2008). Cognitive foundations of learning argumentation. In S. Erduran & M. P. Jiménez-Aleixandre (Eds.), Argumentation in science education: Perspectives from classroom-based research (pp. 29–47). Dordrecht, Netherlands: Springer. Gee, J. P., (1992). The social mind: Language, ideology, and social practice. NY, NY: Bergin and Garvey. Goldman, S.R. (2004). Cognitive aspects of constructing meaning through and across multiple texts. In N. Shuart-Ferris & D.M. Bloome (Eds.), Uses of intertextuality in classroom and educational research. (pp. 313-347). Greenwich, CT: Information Age Publishing. Goldman, S. R. (2005). Designing for scalable educational improvement. In C. Dede, J. P. Honan, & L. C. Peters (Eds.), Scaling up success: Lessons learned from technology-based educational improvement (pp. 67-96). San Francisco, CA: Josey Bass. Goldman, S. R. (2018). Discourse of learning and the learning of discourse. Discourse Processes, 55:5-6, 434-453. Goldman, S. R. & Bisanz, G. (2002). Toward a functional analysis of scientific genres. In J. Otero, J. A. León, & A. C. Graesser (Eds.), The psychology of science text comprehension, (pp. 19-50). Mahwah, NJ: Routledge.
Text-based Explanatory Modeling in Science
72
Goldman, S. R., Britt, M. A., Brown, W., Cribb, G., George, M., Greenleaf, C., Lee, C. D., Shanahan, C. & Project READI. (2016a). Disciplinary literacies and learning to read for understanding: A conceptual framework for disciplinary literacy. Educational Psychologist, 51(2), 219-246. Goldman, S. R., Britt, M. A., Lee, C. D., Wallace, P. & Project READI. (2016b). Assessments of evidence-based argument in three disciplines: History, science and literature. Project READI Technical Report #10. Retrieved from URL: projectreadi.org Goldman, S. R., Ko, M., Greenleaf, C. & Brown, W. (2018). Domain-specificity in the practices of explanation, modeling, and argument in the sciences. In F. Fischer, C. Chinn, K. Engelmann, & J. Osborne, (Eds.) Scientific reasoning and argumentation: Domain-specific and domaingeneral aspects. NY, NY: Taylor Francis. Goldman, S. R., & Scardamalia, S. (2013). Managing, understanding, applying, and creating knowledge in the information age: Next-generation challenges and opportunities, Cognition & Instruction, 31, 255–269. Graesser, A. C., & McNamara, D. S. (2010). Computational analyses of multilevel discourse comprehension. Topics in Cognitive Science, 1-27. Graff, G., & Birkenstein, C. (2016). They say/I say: The moves that matter in academic writing. NY, NY: WW Norton. Greenleaf, C. & Brown, W. (2018). An argument for learning: Secondary science teachers building capacity to support students’ evidence-based argumentation. The Learning Professional, 38(2), 56 – 70. Greenleaf, C., Brown, W., Goldman, S. R., & Ko, M. (2014). READI for science: Promoting scientific literacy practices through text-based investigations for middle and high school
Text-based Explanatory Modeling in Science
73
science teachers and students. Washington, D.C.: National Research Council. Available at http://sites.nationalacademies.org/DBASSE/BOSE/DBASSE_085962 [January 2014]. Greenleaf, C., Brown, W., Ko, M., Hale, G., Sexton, U., James, K. & George, M. (2016). Updated design rationale, learning goals, and hypothesized progressions for text-based investigations in middle and high school science classrooms. Project READI Technical Report #25. Retrieved from URL: www.projectreadi.org Greenleaf, C.; Litman, C.; Hanson, T.; Rosen, R.; Boscardin, C. K.; Herman, J.; Schneider, S.; with Madden, S. & Jones, B. (2011). Integrating literacy and science in biology: Teaching and learning impacts of Reading Apprenticeship professional development. American Educational Research Journal, 48, pp. 647 – 717. Greenleaf, C., Litman, C. & Marple, S. (2018). The impact of inquiry-based professional development on teachers’ capacity to integrate literacy instruction in secondary subject areas. Teaching and Teacher Education, 71, 226-240. Greenleaf, C. & Schoenbach, R. (2004) Building capacity for the responsive teaching of reading in the academic disciplines: Strategic inquiry designs for middle and high school teachers’ professional development. In D. S. Strickland & M. L. Kamil, (Eds.), Improving reading achievement through professional development, Christopher-Gordon Publishers, Inc., pp. 97 – 127. Greenleaf, C., Schoenbach, R., Cziko, C. & Mueller, F. (2001) Apprenticing adolescent readers to academic literacy. Harvard Educational Review, 71(1), 79-130. Grossman, P., Hammerness, K., & McDonald, M. (2009). Redefining teaching, re-Imagining teacher education. Teachers and Teaching: Theory and Practice, 15, 273-289.
Text-based Explanatory Modeling in Science
74
Guthrie, J. T., Van Meter, P., McCann, A., Wigfield, A., Bennett, L., Poundstone, C, Rice, M. E., Faibisch, F., Hunt, B., & Mitchell, A. (1996). Growth in literacy engagement: Changes in motivations and strategies during concept-oriented reading instruction. Reading Research Quarterly, 31, 306-325. Hair, J. F., Jr., Black, W. C., Babin, B. J., Anderson, R. E., & Tatham, R. L. (2006). Multivariate data analysis (6th ed.). Upper Saddle River: Pearson Prentice Hall. Hammerness, K., Darling-Hammond, L., Bransford, J., Berliner, D., Cochran-Smith, M., McDonald, M., & Kenneth, Z. (2005). How teachers learn and develop. In L. DarlingHammond & J. Bransford (Eds.), Preparing teachers for a changing world: What teachers should learn and be able to do (pp. 258-289). San Francisco, CA: Jossey-Bass. Hand, B., Wallace, C. W., & Yang, E. M. (2004). Using a science writing heuristic to enhance learning outcomes from laboratory activities in seventh‐ grade science: Quantitative and qualitative aspects. International Journal of Science Education, 26, 131-149. Hastings, P., Hughes, S., Blaum, D., Wallace, P., & Britt, M. A. (2016). Stratified learning for reducing training set size. In International Conference on Intelligent Tutoring Systems (pp. 341346). Springer International Publishing. Hatano, G., & Inagaki, K. (2003). When is conceptual change intended? A cognitive-sociocultural view. In G. M. Sinatra & P. R. Pintrich (Eds.), Intentional conceptual change (pp. 407—427). Mahwah NJ: Erlbaum. Herrenkohl, L. R., & Cornelius, L. (2013). Investigating elementary students' scientific and historical argumentation. Journal of the Learning Sciences, 22, 413-461. Hill, C. J., Bloom, H. S., Black, A. R., & Lipsey, M. W. (2008). Empirical benchmarks for interpreting effect sizes in research. Child Development Perspectives, 2(3), 172–177.
Text-based Explanatory Modeling in Science
75
Hillocks, G. (2011). Teaching argument writing, grades 6-12: Supporting claims with relevant evidence and clear reasoning. NY, NY: Heinemann. Jacobson, M. J., & Wilensky, U. (2006). Complex systems in education: Scientific and educational importance and implications for the learning sciences. Journal of the Learning Sciences, 15(1), 11-34. DOI: 10.1207/s15327809jls1501_4 Justi, R. S., & Gilbert, J. K. (2002). Modelling, teachers’ views on the nature of modelling, and implications for the education of modellers. International Journal of Science Education, 24, 369–387. Kennedy, M. M. (2016). How does professional development improve teaching? Review of Educational Research. Retrieved from: http://rer.sagepub.com/content/early/2016/01/29/0034654315626800.abstract Kienhues, D., Ferguson, L. & Stahl, E. (2016). Diverging information and epistemic change. In J.A. Greene, W.A. Sandoval, & I. Bråten (Eds.), Handbook of epistemic cognition, (pp. 318220). NY, NY: Routledge. Kintsch, W. (1994). The psychology of discourse processing. In M. A. Gernsbacher. (Ed.) Handbook of psycholinguistics: 721-739, Academic Press: San Diego, CA. Kress, G. (1989). Linguistic processes in sociocultural practice (2nd ed.). Oxford: Oxford University Press. Kress, G., & Van Leeuwen, T. (2001). Multimodal discourse: The modes and media of contemporary communication. London, UK: Edward Arnold. Kyza, E. A. & Georgiou, Y. (2014). Developing in-service science teachers’ ownership of the PROFILES pedagogical framework through a technology-supported participatory design approach to professional development. Science Education International, 25(2), 55-77.
Text-based Explanatory Modeling in Science
76
Langer, J. A. (2011). Envisioning knowledge: Building literacy in the academic disciplines. NY: Teachers College Press. Lampert, M. (2010, January/February). Learning teaching in, from, and for practice: What do we mean? Journal of Teacher Education, 61(1/2), 21–34. Lave, J., & Wenger, E. (1991). Situated learning: Legitimate peripheral participation. NY, NY: Cambridge University Press. Lee, C. D., Goldman, S. R., Levine, S., & Magliano, J. P. (2016). Epistemic cognition in literary reasoning. In J. Green, W. Sandoval, & I. Brâten (Eds.), Handbook of epistemic cognition (pp. 165–183). New York, NY: Routledge. Lee, C. D., & Spratley, A. (2010). Reading in the disciplines: The challenges of adolescent literacy. New York, NY: Carnegie Corporation of New York. Lemke, J. L. (1998). Multiplying meaning: Visual and verbal semiotics in scientific text. In J.R. Martin & R. Veel (Eds.), Reading science (pp.87-113). London: Routledge. Lieberman, A., & Mace, D. P. (2010). Making practice public: Teacher learning in the 21st century. Journal of Teacher Education 61(1-2), 77 – 88. Linn, M. C., & Eylon, B.-S. (2011). Science learning and instruction: Taking advantage of technology to promote knowledge integration. New York, NY: Routledge. Litman, C., Marple, S., Greenleaf, C., Charney-Sirott, I., Bolz, M., Richardson, L, Hall, A., George, M., & Goldman, S.R. (2017). Text-based argumentation with multiple sources: A descriptive study of opportunity to learn in secondary English language arts, history and science. Journal of the Learning Sciences, 26, 79-130. Loucks-Horsley, S., Hewson, P. W., Love, N., & Stiles, K. E. (1998). Designing professional development for teachers of science and mathematics. Thousand
Text-based Explanatory Modeling in Science
77
Oaks, CA: Corwin Press. McNeill, K. L., & Krajcik, J. S. (2011). Supporting grade 5-8 students in constructing explanations in science: The claim, evidence, and reasoning framework for talk and writing. NY, NY: Pearson. Mehan, H. (1979). Learning lessons: Social organization in the classroom. Cambridge, MA: Harvard University Press. Mendonça, P. C. C., & Justi, R. (2013). The relationships between modelling and argumentation from the perspective of the model of modelling diagram. International Journal of Science Education, 35, 2407–2434. Michaels, S., & O’Connor, C. (2017). From recitation to reasoning: Supporting scientific and engineering practices through talk. In C.V. Schwarz, C Passmore, & B. J. Reiser (Eds.), Helping students make sense of the world using the Next Generation Science Standards (pp. 311 – 336). Arlington, VA: National Science Teachers Association Press. Moje, E. B. (2008). Foregrounding the disciplines in secondary literacy teaching and learning: A call for change. Journal of Adolescent & Adult Literacy, 52, 96-107. Moje, E. B. (2015). Doing and teaching disciplinary literacy with adolescent learners: A social and cultural enterprise. Harvard Educational Review, 85, 254-278. Moje, E. B., & O'Brien, D. G. (Eds.). (2001). Constructions of literacy: Studies of teaching and learning in and out of secondary classrooms. Mahwah, NJ: Erlbaum. Moje, E. B., & Speyer, J. (2014). Reading challenging texts in high school: How teachers can scaffold and build close reading for real purposes in the subject areas. In K. Hinchman & H. Thomas (Eds.), Best practices in adolescent literacy instruction, (pp. 207-231). NY, NY: Guilford Press.
Text-based Explanatory Modeling in Science
78
Moon, J. A. (2013). Reflection in learning and professional development: Theory and practice. NY, NY: Routledge. National Assessment of Educational Progress (2009a). NAEP 2008 trends in academic progress (NCES 2009–479). Prepared by Rampey, B.D., Dion, G.S., and Donahue, P.L. for the National Center for Education Statistics, Institute of Education Sciences, U.S. Department of Education, Washington, D.C. National Assessment of Educational Progress (2009b). Achievement gaps: How Black and White students in public schools perform in mathematics and reading on the National Assessment of Educational Progress, (NCES 2009-455). Prepared by Vanneman, A., Hamilton, L., Baldwin Anderson, J., and Rahman, T. for the National Center for Education Statistics, Institute of Education Sciences, U.S. Department of Education. Washington, DC. National Center for Educational Statistics (2012). The Nation’s Report Card: Science 2011 (NCES 2012–465). Washington, DC: Institute of Education Sciences, U.S. Department of Education. National Research Council. (2012). Education for life and work: Developing transferable knowledge and skills in the 21st century. Committee on Defining Deeper Learning and 21st Century Skills, J. W. Pellegrino and M. L. Hilton, Editors. Washington, DC: The National Academies Press. New London Group (1996). A pedagogy of multiliteracies: Designing social futures. Harvard Educational Review, 66, 60-92. Next Generation Science Standards Lead States (2013). Next Generation Science Standards: For states, by states. Washington, DC: National Academies Press. Nietfeld, J. L., Cao, L., & Osborne, J. W. (2006). The effect of distributed monitoring exercises and feedback on performance, monitoring accuracy, and self-efficacy.
Text-based Explanatory Modeling in Science
79
Metacognition Learning, 1, 159-179. Norris, S. P. & Phillips, L. M. (2003). How literacy in its fundamental sense is central to scientific literacy. Science Education, 87, 224–240. Organization of Economic and Cultural Development (2013). PISA 2012: Results in focus. Paris: OECD. Osborne, J. (2002). Science without literacy: A ship without a sail? Cambridge Journal of Education, 32(2), 203-218. Osborne, J. (2010). Arguing to learn in science: The role of collaborative, critical discourse. Science Magazine (328), pp. 463 – 467. Osborne, J. F., & Patterson, A. (2011). Scientific argument and explanation: A necessary distinction? Science Education, 95, 627-638. Pajares, F. (1992). Teachers’ beliefs and educational research: Cleaning up a messy construct. Review of Educational Research, 62, 307-332. Park, M., Anderson, E., Yoon, S. (2017). Learning biology coherently through complex systems: A model supported with scientific practices and agent-based simulations. In B. Smith & A. Foster (Eds.), Proceedings of the International Conference for Computer Supported Collaborative Learning. Philadelphia, PA: ISLS. Passmore, C. M., & Svoboda, J. (2012). Exploring opportunities for argumentation in modeling classrooms. International Journal of Science Education, 34, 1535-1554. Pearson, P.D., Moje, E.B., & Greenleaf, C. (2010).“Science and literacy: Each in the service of the other.” Science Magazine (328), 459-463.
Text-based Explanatory Modeling in Science
80
Penney, K., Norris, S. P., Phillips, L. M., & Clark, G. (2003). The anatomy of junior high school science textbooks: An analysis of textual characteristics and a comparison to media reports of science. Canadian Journal of Science, Mathematics and Technology Education, 3, 415–436. Penuel, W. R., Fishman, B. J., Cheng, B. H., & Sabelli, N. (2011). Organizing research and development at the intersection of learning, implementation, and design. Educational Researcher, 40, 331–337. Penuel, W., Fishman, B., Yamaguchi, R., & Gallagher, L. (2007). What makes professional development effective? Strategies that foster curriculum implementation. American Educational Research Journal, 44, 921–958. RAND Reading Study Group. (2002). Reading for understanding: Toward an R&D program in reading comprehension. Prepared for the Office of Educational Research and Improvement. Santa Monica, CA: RAND. Raphael, T., Au, K., & Goldman, S. R. (2009). Whole school instructional improvement through the Standards Based Change Process: A developmental model. In J. Hoffman and Y. Goodman (Eds.), Changing literacies for changing times (pp. 198-229). New York, NY: Routledge/ Taylor Frances Group. Raudenbush, S. W., & Bryk, A. S. (2002). Hierarchical linear models: Applications and data analysis methods (2nd ed.). Thousand Oaks, CA: Sage. Raudenbush, S.W., Bryk, A.S, & Congdon, R. (2016). HLM 7.02 for Windows [Computer software]. Skokie, IL: Scientific Software International, Inc. Reinking, D., & Bradley, B. A. (2008). On formative and design experiments: Approaches to language and literacy research. New York: Teachers College Press.
Text-based Explanatory Modeling in Science
81
Resnick, L. B., Asterhan, C., & Clarke, S. (Eds.) (2015). Socializing intelligence through academic talk and dialog. Washington, D. C.: American Educational Research Association. Rinehart, R. W., Duncan, R. G., Chinn, C. A., Atkins, T. A., & DiBenedetti, J. (2016). Critical design decisions for successful model-based inquiry in science classrooms. International Journal of Designs for Learning, 7(2). Retrieved from https://scholarworks.iu.edu/journals/index.php/ijdl/article/view/20137 Rokeach, M. (1968). Beliefs, attitudes and values: A theory of organization and change. San Francisco: Jossey-Bass. Rouet, J.-F. (2006). The skills of document use: From text comprehension to Web-based learning. Mahwah, NJ: Lawrence Erlbaum Associates. Rouet, J-F. & Britt, M.A. (2011). Relevance processes in multiple document comprehension. In M.T. McCrudden, J. P. Magliano, & G. Schraw (Eds.), Relevance instructions and goalfocusing in text learning (pp. 19 - 52). Greenwich, CT: Information Age Publishing. Sabatini, J., Bruce, K., & Steinberg, J. (2013). Research Report, ETS RR-13-08: SARA reading components tests, RISE Form: Test design and technical adequacy. Princeton, New Jersey: Educational Testing Service. Sabatini, J. P., Bruce, K., Steinberg, J., & Weeks, J. (2015). SARA reading components tests, RISE forms: Technical adequacy and test design, 2nd edition (ETS Research Report No. RR-15-32). Retrieved May, 2, 2018 from http://www.ets.org/research/topics/reading_for_understanding/publications. Sabatini, J. & O’Reilly T, (2015, July). Is the Moon a Satellite? “No, it is a Big Piece of Rock. It’s a Moon!” Examining Scientific Reasoning in Elementary Students’ Performance on ScenarioBased Assessments. Presentation at Society for Text & Discourse, Minneapolis, MN.
Text-based Explanatory Modeling in Science
82
Sabatini, J. P., O’Reilly, T., Weeks, J., & Steinberg, J. (2016, April). The validity of scenario-based assessments: Empirical results. Paper presented at the annual meeting of the National Council on Measurement in Education, Washington, D. C. Salas, C., Griffin, T., Wiley, J., Britt, M. A., Blaum D., & Wallace, P. (2016). Validation of new epistemological scales related to inquiry learning. Project READI Technical Report #6. Retrieved from: www.projectreadi.org Sandoval, W. A. (2016). Disciplinary insights into the study of epistemic cognition. In J.A. Greene, W.A. Sandoval, & I. Bråten (Eds.), Handbook of epistemic cognition, (pp. 184-194). NY, NY: Routledge. Sandoval, W. A., & Millwood, K. A. (2008). What can argumentation tell us about epistemology? In S. Erduran & M. P. Jiménez-Aleixandre, M. P (Eds). Argumentation in science education: Perspectives from classroom-based research (pp.68-85). Dordrecht, Netherlands: Springer. Schoenbach, R., Greenleaf, C., & Murphy, L. (2012). Reading for understanding: How Reading Apprenticeship improves disciplinary learning in secondary and college classrooms, 2nd Edition. SF: Jossey-Bass, Inc. A12 Schoenbach, R., Greenleaf, C., & Murphy, L. (2016). Leading for literacy: A Reading Apprenticeship Approach. Jossey-Bass. Retrieved from http://www.wiley.com/WileyCDA/WileyTitle/productCd-1118437268.html Schwarz, C. V., Passmore, C., & Reiser, B. J. (Eds.). (2017). Helping students make sense of the world using next generation science and engineering practices. NSTA Press, National Science Teachers Association.
Text-based Explanatory Modeling in Science
83
Shanahan, C., Heppeler, J., Manderino, M., Bolz, M., Cribb, G., & Goldman, S. R. (2016). Deepening what it means to read (and write) like a historian: Progressions of instruction across a school year in an eleventh grade U.S. history class. The History Teacher, 49, 241-270. Shanahan, T., & Shanahan, C. (2008). Teaching disciplinary literacy to adolescents: Rethinking content area literacy. Harvard Educational Review, 78(1), 40-59. Shulman, L. S. (1986). Those who understand: Knowledge growth in teaching. Educational Researcher, 15, 4-14. Songer, N. B., & Gotwals, A. W. (2012). Guiding explanation construction by children at the entry points of learning progressions. Journal of Research in Science Teaching, 49(2), 141-165. Snow, C. E., & Biancarosa, G. (2003). Adolescent literacy and the achievement gap: What do we know and where do we go from here? Adolescent Literacy Funders Meeting Report. NY: Carnegie Corporation. Strømsø, H.I., Bråten, I. & Samuelstuen, M.S. (2008). Dimensions of topic-specific epistemological beliefs as predictors of multiple text understanding. Learning and Instruction, 18, 513-527. Tabachnick, B. G., & Fidell, L. S. (2007). Using multivariate statistics (5th ed.). New York Allyn and Bacon. Tabak, I. (2016). Functional scientific literacy: Seeing the science within the words and across the Web. L. Corno and E. Anderman (Eds.) Handbook of educational psychology (3rd edition) (pp. 269-280). NY, NY: Routledge. Toulmin, S. E. (1958) The uses of argument. Cambridge, UK: Cambridge University Press. Toulmin, S., Rieke, R., & Janik, A. (1984). An introduction to reasoning. NY, NY: Macmillan Publishing Company. Unsworth, L. (2002). Changing dimensions of school literacies. Australian Journal of Language
Text-based Explanatory Modeling in Science
84
and Literacy, 25, 62–77. van den Broek, P. (2010). Using texts in science education: Cognitive processes and knowledge representation. Science, 328, 453–456. van den Broek, P., Young, M., Tzeng, Y., & Linderholm, T. (1999). The landscape model of reading: Inferences and the online construction of memory representation. In H. van Oostendorp & S. R. Goldman (Eds.), The construction of mental representations during reading (pp. 71– 98). Mahwah, NJ: Erlbaum. Vaughn, S., Swanson, E.A., Roberts, G., Wanzek, J., Stillman-Spisak, S.J., Solis, M., & Simmons, D. (2013). Improving reading comprehension and social studies knowledge in middle school. Reading Research Quarterly, 48(1), 77–93. doi:10.1002/rrq.039. von Aufschnaiter, C., Erduran, S., Osborne, J., & Simon, S. (2008). Arguing to learn and learning to argue: Case studies of how students' argumentation relates to their scientific knowledge. Journal of Research in Science Teaching, 45, 101-131. Wells, G. (1989). Language in the classroom: Literacy and collaborative talk. Language and Education, 3(4), 251-273. Wigfield, A. & Guthrie, J.T. (1997). Relations of children’s motivation for reading to the amount and breadth of their reading. Journal of Educational Psychology, 89, 420-432. Wiley, J., Hastings, P., Blaum, D., Jaeger, A.J., Hughes, S., Wallace, P., Griffin, T.D., & Britt, M.A. (2017). Different approaches to assessing the quality of explanations following a multipledocument inquiry activity in science. International Journal of Artificial Intelligence in Education, 1-33. DOI: 10.1007/s40593-017-0138-z.
Text-based Explanatory Modeling in Science
85
Windschitl, M., Thompson, J., & Braaten, M. (2008). Beyond the scientific method: Model‐ based inquiry as a new paradigm of preference for school science investigations. Science Education, 92(5), 941-967. Wineburg, S. (2001). Historical thinking and other unnatural acts: Charting the future of teaching the past. Philadelphia, PA: Temple University Press. Yoon, S., Anderson, E., Koehler-Yom, J., Evans, C., Park, M., Sheldon, J., Schoenfeld, I., Wendel, D. Scheintaub, H. & Klopfer, E. (2017). Teaching about complex systems is not simple matter: Building effective professional development for computer-supported complex system instruction. Instructional Science, 45(1), 99-121. Yoon, S., Koehler-Yom, J., & Yang, Z. (2017). The effects of teachers’ social and human capital on urban science reform initiatives: Considerations for professional development. Teachers College Record, 119(4), 1 – 32. Yore, Larry D. (2004). “Why do future scientists need to study the language arts?” In E. W. Saul (Ed.), Crossing borders in literacy and science instruction: Perspectives on theory and practice (pp. 71–94). Newark, DE: International Reading Association Yore, L. D., Bisanz, G. L., & Hand, B. M. (2003). Examining the literacy component of science literacy: 25 years of language arts and science research. International Journal of Science Education, 25, 689–725. Zech, L. K., Gause-Vega, C. L., Bray, M. H., Secules, T., & Goldman, S. R. (2000). Content-based collaborative inquiry: A professional development model for sustaining educational reform. Educational Psychologist, 35(3), 207–217.
Text-based Explanatory Modeling in Science
86
Zohar, A. (2008). Science teacher education and professional development in argumentation. In S. Erduran & M. Jiménez-Aleixandre (Eds.), Argumentation in science education: Perspectives from classroom based research (pp. 245-268). Dordrecht, Netherlands: Springer.
Text-based Explanatory Modeling in Science
87
Table 1. Core Constructs Instantiated for Text-based Investigation in Science Core Construct: General Definition Epistemology: Beliefs about the nature of knowledge and the nature of knowing. What counts as knowledge? How do we know what we know?
Inquiry Practices, Reasoning Strategies: Ways in which claims and evidence are established, related, and validated
Science: Text-based Investigation Description, classification, and explanation of the natural and engineered worlds expressed as models and theories that are • approximations and have limitations • based on sound empirical data • socially constructed • meet criteria of parsimony, and logical cohesion • subject to revisions with successive empirical efforts that reflect changes in technology, theories and paradigms, and cultural norms. Scientific knowledge is built by: • developing coherent, logical classification systems, explanations, models or arguments from evidence • advancing and challenging classification systems and explanations • converging/corroboration of evidence • comparing/integrating across sources and representations • evaluating sources and evidence in terms of scope, inferential probability, reliability, and extent to which it accounts for evidence.
Overarching concepts, themes, principles, frameworks: Foundational concepts, ideas, reasoning principles, and assumptions. These serve as a basis for warranting, justifying, legitimizing connections between evidence and claims.
Scientists connect evidence to claims using • cross-cutting concepts (patterns; cause and effect; scale, proportion and quantity; systems and system models; energy and matter in systems; structure and function; stability and change of systems). • disciplinary core ideas in the physical sciences, earth and space sciences; life sciences; and engineering, technology, and applications of science.
Forms of information representation/types of texts: Types of texts and media (e.g., traditional print, oral, video,
Scientific texts may have different explanatory purposes (e.g., cause effect, correlation, comparison, process sequence, chronology, enumeration, description). Science texts convey meaning with multiple representations (e.g., verbal, diagrams, equations, graphs, tables, simulations,
Text-based Explanatory Modeling in Science digital) in which information is represented and expressed.
Discourse and language structures: The oral and written language forms in which information is expressed.
88
flowcharts, schematics, videos). Different types of sources (genres) are written for different audiences and purposes, with implication for their content and structure (e.g., bench notes, refereed journal articles, textbooks, websites, blogs). Science texts contain • distinctive grammatical structures (e.g., nominalizations, passive voice). • technical and specialized expressions. • signals to the degree of certainty, generalizability, and precision of statements. Argumentation is a scientific discourse practice in which evidence is used to support knowledge claims, and scientific principles and methods are used as warrants. Conventions for claim and evidence presentation in oral and written forms include • one-sided, two-sided arguments, multi-sided • two-sided, multi-sided refutational arguments • implicit arguments (embedded in descriptive and narrative structure) • oral arguments (debates, discussions, conversations)
Table 2. Progression of Project READI Science Goals across the Four Learning Phases Learning Phase
Project READI Science Learning Goals
1. Close reading. Engage in close reading of science information to construct domain knowledge, including multiple representation s characteristic of the discipline and language learning strategies. Close reading encompasses metacompreh ension and selfregulation of the process. 2.Synthesize within and across multiple text sources.
Phase 1: Building Classroom Routines To Support Science Literacy and Meaning Making
Phase 2: Building a Repertoire of Science Literacy and Discourse Processes
Phase 3: Deepening Scientific Literacy And Discourse Practices For Reasoned Sensemaking
Phase 4: Utilizing Scientific Literacy And Discourse Practices For Disciplinary Knowledge Building
Building confidence and range with science genre, text types and text structures (including scientific models). Previewing to set reading purpose and • Annotation process based on as persistent close reading topic, genre, text type, level of practice. • Discussion of interest and level of challenge. metacomprehensi Identifying and on in context Handling Roadblocks while of sense reading. making. • Language for describing reading and reasoning processes.
Set reading purpose based on text-based indicators of reliability and scope of content. Nascent Modeling Reading processes: attending to and clarifying/inquiring into the Science, phenomena, elements and relationships thereof, and model generation. Multi-text synthesis.
Attending to scientific principles (theories such as mass-energy conservation, Hardy-Weinberg model) and Unifying Concepts of science (paradigms such as Evolution, Scale, Equilibrium, Matter and Energy, Form and Function, model and explanations, Evidence and representations) while reading.
Reading multiple texts on same topic or related topics
Attending to how multiple texts are connected (i.e. complimentary, additive, or even contradictory) and the affordances of
Viewing texts as investigations, setting purpose and inquiry for reading single and multiple texts.
Setting a purpose for reading in science and science learning. Introducing
Making connections to schema and intext connections. Building knowledge of key concepts
Text-based Explanatory Modeling in Science
90
across multiple texts.
various text types (i.e. personal anecdotes, primary data). Building explanations for inquiry questions across multiple texts.
Attending to the new information afforded with additional texts and how information provided in those texts addresses the inquiry question.
3. Construct explanations of science phenomena (explanatory models) using science principles, frameworks, enduring understanding s, crosscutting concepts, and scientific evidence.
Developing Norms for Classroom Discourse that holds students accountable to one another’s ideas. Students begin to increasingly explicate their ideas and make them visible to the classroom and their peers.
Making norms for reading, writing, talking, speaking for text based science inquiry / sensemaking discussion routine. Increased attention to building off of one another’s ideas, attending to the logical coherence of one another’s claims. Constructing gists of phenomena from single texts treating the text as an authority (i.e. noticing causal or correlation relationships between elements).
Deepen language, representation and discourse patterns/convention s that attend to disciplinary norms for knowledge building. Attention to evidence, claims, and the links that one puts forth and that others propose within classroom discussion. Developing and making public disciplinary norms for model construction, justification, critique and revision. Constructing models based on text evidence.
Using disciplinary criteria for knowledge building as students engage in multiple cycles of reading, talking, and writing. Constructing multitext models from larger text sets. Using models to predict implications of proposed solutions and answers to authentic science questions.
4. Justify explanations using science principles, frameworks and enduring understanding s, crosscutting concepts, and scientific
Citing text in sense making/metacomprehension discussions. Reasoning and support based on authority (text, teacher, or one’s own experience).
Identifying relevant evidence in single text that responds to inquiry questions. Increasing attention to the distinction between evidence and inference in both texts and classroom talk.
Identifying relevant evidence that informs the model while reading single and multiple texts. Specifying how evidence informs the model. Developing criteria for scientific models
Justifying explanations by appealing to scientific principles or unifying concepts of science. Refining explanatory models and explanations through careful attention to claims,
Text-based Explanatory Modeling in Science evidence. (Includes evaluating the quality of the evidence.)
91
and explanations (writ large and for particular systems). Justifying models based on criteria for scientific models and reliability of text sources.
evidence and reasoning.
Critique the reliability of models and explanations based on the quality of evidentiary support (convergence, corroboration). Critique the scope of the model based on appeals to scientific principals and unifying concepts of science.
5. Critique explanations using science principles, frameworks and enduring understanding s, crosscutting concepts, and scientific evidence.
Offering and tolerating alternative explanations, viewpoints, opinions in class discussions.
Disagreeing and offering evidence/rationale for it. Asking probing questions of each other in class discussions. Questioning while reading (to clarify, challenge or build knowledge). Increased attention to how the ideas presented in text “fit with” one’s prior knowledge and other texts.
Offering alternative explanations in response to the explanations of others. Using criteria for scientific models and explanations as basis for critique and consensus building. Critique models and explanations based on the model’s purpose (question it is trying to answer). Compare multiple, alternative models for single phenomena.
6. Science Epistemology and Inquiry. Demonstrate understanding of epistemology of science through inquiry dispositions and conceptual change awareness/ orientation (intentionally
Promoting the understanding that scientific findings have both practical and theoretical implications for science and society Taking inquiry stance as a basis for interacting with text.
Viewing science findings as limited and tentative, based on available evidence Tolerating ambiguity and seeking the best understanding, given the evidence, while reading
Recognize that Recognize that science knowledge • Science is socially knowledge constructed by peer building is shaped critique and public by (and shapes) dissemination scientific (advancing and principles challenging (theories) and explanations/models Unifying ) to create scientific Concepts explanations that (paradigms) meet certain criteria • Theories and (based on sound paradigms are empirical data, used as a basis for parsimonious and constructing, logically cohesive) justifying and as a basis for co-
Text-based Explanatory Modeling in Science building and refining key concepts through multiple encounters with text); seeing science as a means to solve problems and address authentic questions about scientific problems.
construction of knowledge while reading.
92
critiquing models while reading.
Table 3. Demographic Information for Schools Resulting from Stratified Random Assignment of Schools (Total = 24) to Intervention or Control Group Schools Strata Demographics
1&2
3&4
Schools per Strataa Intervention (n =12) 2 6 Control (n = 12) 3 4 Students eligible for Free/Reduced Lunch Intervention 85% 78% Control 91% 94% PSAE: Students Meeting or Exceeding Standards Intervention 14% 29% Control 15% 25%
5&6 4 5 47% 53% 48% 59%
Note. aCharacteristics for schools are averaged and reported for pairs of strata that had similar Prairie State Achievement Exam (PSAE) performance based on the Spring, 2013 administration to 11th graders. Data are reported for pairs rather than individual strata to maintain confidentiality of schools since in three of the 12 possible cells there was only one school. Not shown in the table is that the distribution of city and suburban schools across the intervention and control conditions was similar. The race/ethnicity distributions were similar as well: For Intervention and Control, four were largely African American. Two Intervention and four Control schools were largely Latinx. Six Intervention and three Control schools were Mixed. One Control school was largely Caucasian.
Table 4. Race/Ethnicity (Self-Report) by Gender for Teachers (N = 48) assigned to the Intervention or Control Condition Intervention, n = 24 Control, n = 24 Race/Ethnicity Male Female Male Female African American 2 1 3 4 Asian 0 2 0 0 Caucasian 6 13 5 11 Latinx 0 0 1 0 Total 8 16 9 15
Table 5. Race/Ethnicity (Self-Report) by Gender for Students (N = 979) assigned to the Intervention or Control Condition Intervention, n = 574 Control, n = 405 Race/Ethnicity Male Female Male Female African American 62 84 34 72 American Indian 0 0 1 1 Asian 19 12 11 10 Caucasian 58 61 37 34 Latinx 68 111 56 94 Other/multi 45 53 29 25 Total 252a 321 168a 236 Note. The demographic information for the N = 979 students reflects those who were present all four days for the evidence-based argument assessment and provided any of the demographic information. Two additional students were present for all four days but did not provide demographic information. a One male student in Intervention and one male student in Control did not answer the race/ethnicity question but provided other demographic information. Thus the total number of males in the Intervention group was 253 and the total in the Control was 169. Two additional students provided neither gender information nor race/ethnicity information.
Table 6. Design of Semester-long Instructional Intervention in 9th Grade Biological Sciencesa Week in semester Learning Phase
1
2
3
4
Phase 1: Building classroom routines to support science literacy and meaning making. Focal Project Students begin to see that X learning scientific knowledge is goals built through close reading of text, and also through class-wide knowledgebuilding discourse. Students begin to see themselves as readers of science, increasingly interact with texts and view the classroom as a place where their knowledge is valued.
5
6
7
8
Phase 2: Building a repertoire of science literacy and discourse processes. Students closely read multiple texts with attention to kinds of evidence that are embedded in various text types (written, visual representations); consider interpretations that can be made from different kinds of evidence and how this helps construct explanations of science phenomena. Build knowledge of conventions of scientific models and criteria for evaluating them. Increasing awareness, confidence, ownership of science reading and reasoning practices as inquiry.
9
10
11
12
Phase 3: Deepening scientific literacy and discourse practices for reasoned sensemaking. Students continue building close reading and multiple text synthesis practices in order to build causal explanatory accounts for scientific phenomena. Students increasingly view models as representations that facilitate their own sense making activities: to clarify, refine, and modify or revise their own science thinking.
13
14
15
16
17
Phase 4: Utilizing scientific literacy and discourse practices for disciplinary knowledge building. Students deepen close reading and multiple text synthesis in order to construct, justify, and critique causal explanatory accounts for scientific phenomena. Students work more independently in building explanations of scientific phenomena in the world as well as taking an active role in justification and critique of scientific explanations.
Text-based Explanatory Modeling in Science Materials and Tools
Science Principles and Topics
Texts: Teacher-selected and Project X –provided. Tools and scaffolds: science reading stems, science talking stems, evidence and interpretation notetakers Introduction Cell Biology to big ideas • Basic cell of Biology biochemistry • Community • Enzymes/substrate and interactions Ecosystem • Cell differentiation Ecology and specialization (Inter• History of cell dependence biology and energy • Technology and flow in advancement of ecosystems) science knowledge • Energy production in plants (Photosynthesis) • Scientific evidence of Evolution • Cell biology: cell division, communication
Project X Reading Models Moduleb Models as represen tations of ideas; reading types of models; criteria for evaluati ng; revising models
Project X Homeostasis Module (~ 4–5 weeks)
97
Project X MRSAc Module (~ 5–6 weeks)
Internal balances are Evolution as a ubiquitous dynamic in regulated through feedback. living systems. Body systems from cells to • Natural selection (variation in traits, organ systems contribute to genetic inheritance, selection) ad regulation adaptation • Feedback mechanisms • Antibiotic resistance (focused on • Cell communication staphylococcus aureus) • Homeostasis (both cellular • Microbes: bacteria and viruses; human and organism levels – microbiota (staphylococcus aureus in human focus) particular); Binary fission of bacteria • Role of specialized organs • Human contributions to evolution and and systems (e.g., kidneys, evolutionary engineering. pancreas, endocrine system) in maintaining balance in the human body. • Diabetes and hypo/hypernatremia as cases of homeostasis disruption • Behavior and its impact on homeostasis
Text-based Explanatory Modeling in Science a
98
Text as used in this table and throughout the paper reflects all forms (e.g., visual/verbal; static/dynamic) and genres (e.g., research reports, bench notes, journalistic reports) in which science information is represented. The complete set of materials supplied by Project READI for the intervention are available through the website (www.projectreadi.org). b Types of models sampled the forms of representation used in biological sciences. c MRSA is the acronym for methicillin-resistant Stapphylococcus aureus, an antibiotic-resistant bacteria. MRSA is a type of staph that has become increasingly prevalent due to the misuse and overuse of antibiotics to treat ordinary staph infections. MRSA illustrates evolved resistance through selective breeding.
Text-based Explanatory Modeling in Science
Table 7. Survey of Teacher Knowledge, Attitudes and Practices Related to Students and Science Reading Number of Items before and after EFAa Before After Scale Title 72 56 Example item(s) Scale and range 1. bCommon Core Familiarity 1 1 How familiar are you with the Familiarity: scale ranging Common Core State Standards?” from 1 = not familiar to 5 = extremely familiar. c 2. Attitude 9 9 Stem for all items: How important is Importance: scale ranging it for students to… from 1 = not important to …use multiple sources of 5 = extremely important. information presented in diverse formats and media in order to develop an argument. c 3. Self-Efficacy 9 9 Stem for all items: How confident Confidence: scale ranging are you in teaching students to … from 1 = not confident to …evaluate the credibility and 5 = extremely confident. reliability of a source of information. 4. d,eTeaching Philosophy: 14 5 1. It is virtually impossible to Agreement: scale ranged Reading. Beliefs about significantly improve students' from 1 = strongly teaching reading, malleability reading in secondary school. disagree to 5 = strongly of student reading 2. Spending class time reading runs agree. achievement; role of reading in counter to the goal of building science knowledge building knowledge in science.
99
Cronbach's α Pref N/A
Postf N/A
0.88
0.91
0.95
0.95
0.78
0.77
Text-based Explanatory Modeling in Science 5. dScience reading opportunities: Learning structure.
6
4
6. cArgument and Multiple Source Practices
9
9
7. dContent reading and discussion.
5
3
8. dMetacognitive inquiry: Student practices
7
7
9. dMetacognitive inquiry: Teachers modeling their thinking when and about science reading
5
5
10. dNegotiation success: Feedback and assessment
7
5
Stem for all items: How frequently do your students… …read for homework. …listen to teacher reading aloud in whole class setting. Stem for all items: How frequently do you work with students to … … identify points of agreement and disagreement across authors addressing the same issue or topic. Stem for all items: How often did … …you discuss homework reading assignments in class …your students discuss the content of reading materials in whole class Stem for all items: How often did your students… …discuss what was easy or challenging for them about reading science. …take notes on how as well as what they understood from readings Stem for all items: How often did … …you share with students your own interest in reading science …you pose questions to probe and deepen student thinking about science reading and thinking? Stem for all items: How often did you… …read and comment on student journal writing …assess student participation in
100
Frequency: scale ranging from 1 = never to 5 = all or almost all lessons.
0.69
0.77
Frequency: scale ranging from 1 = never to 5 = all or almost all lessons.
0.69
0.77
Frequency: scale ranging from 1 = never to 5 = all or almost all lessons.
0.67
0.70
Frequency: scale ranging from 1 = never to 5 = all or almost all lessons.
0.70
0.87
Frequency: scale ranging from 1 = never to 5 = all or almost all lessons.
0.70
0.85
Frequency: scale ranging from 1 = never to 5 = all or almost all lessons.
0.75
0.79
Text-based Explanatory Modeling in Science
101
reading-related activities for evidence of comprehension Note. aExploratory Factor Analyses were used to determine the fit of items to the construct intended to be measured by the scale. b All teachers responded with 4 or 5 on this item and it was not considered in further analyses. c These scales were developed for purpose of this study and pilot-tested during 2011-2014 with a different sample of teachers than the participants in the present study. Each scale had a different stem but the nine completions were the same. The examples show three of the nine completions. The other six were 1)…identify claims and evidence in expository text passages; 2)…determine the central idea of a text; 3) … draw evidence from scientific texts to support analysis, reflection, and research; 4) … develop disciplinary vocabulary, concepts, and principles; 5) …evaluate the claims, evidence, and reasoning presented by the author of an expository text passage; 6) …understand the criteria for what counts as evidence in science. d These scales were adapted from a prior study conducted by a subset of the Project READI team (see Greenleaf et al., 2011). e Two items were added to the 12 in the Greenleaf et al. (2011) scale. f Pre: prior to the start of professional development for the intervention teachers; Post: after completion of student data collection but prior to the professional development provided for the control teachers.
Text-based Explanatory Modeling in Science Table 8. Constructs and Indicators Comprising the Classroom Observation Protocol Construct Definition of Indicators Four-Point Rubric Scales for lowest (1) highest (4) points 1. Science Role of reading: Role of text in science 1-Text played little or no role in learning; students could meet reading learning; whether students need to read to expectations without reading. opportunities meet classroom expectations. 4-Text played a central role in learning; students could not meet (centrality of expectations without reading and doing the intellectual work. student reading Breadth of reading: Range of instructional 1-Teacher utilized one or no text. in the genres/types utilized in the lesson. 4-Teacher utilized multiple and multiple types of texts. intellectual Teacher support of reading: Teacher 1-Teacher did not address how to read text. work) addresses how to read text(s). 4-Teacher addressed how to read multiple texts. Student accountability for reading: Task 1-Students were not held accountable for reading. Teacher expectations require students to learn presented important content verbally. content through reading. 4-Students held accountable for reading; generated their own ideas from reading. Teacher did not duplicate content from text(s). 2. Teacher Task Structure - Social Support for Reading 1-Tasks not structured to support collaborative meaning support for Comprehension: Task structure supports making. student efforts collaborative meaning-making. 4-Tasks were structured for social support for collaborative to comprehend meaning-making during in class reading. science content Nature of Teacher Support: Teacher moves 1-Teacher moves never promoted student understanding of from text that promote student comprehension of content. science content 4-Teacher moves promoted student understanding of content (e.g. students supported to engage in meaning-makingelaborating, problem solving, evaluating). Student practice: Teachers provide time and 1-Students never did the work of reading and comprehending direction for students to do the work of science text. reading and comprehending science content 4-Students had time for and were directed to use meaningmaking scaffolds and strategies for reading and comprehending science content (e.g. annotations, metacognitive conversations, evidence/interpretation charts). Accountability/Formative Assessment of 1-Teacher did not assess students’ understanding of content. Content from Reading: Extent teacher
102
Text-based Explanatory Modeling in Science assesses students’ understanding as they read and make sense of science content. 3.Metacognitive Task structure: Structure provides inquiry into opportunities for metacognitive science reading conversations and thinking processes Teacher support: Extent to which teacher supports students to engage in metacognitive reading and thinking.
4. Specific reading and science reading comprehension routines, tools, strategies, and processes 5. Science argumentation and/or building explanatory models from multiple sources
Student Practice: Student use of metacognitive reading and comprehension monitoring routines, tools and strategies. Teacher Support (Explicit Instruction and Modeling): Instructional supports the teacher uses (routines, tools, strategies). Student Practice: Use of comprehension supporting and disciplinary reading routines, tools and strategies. Task Structure – Structure provides opportunities for students to engage in science argumentation and/or model building through reading Teacher Support for science argumentation and/or model building through reading: Teacher actions support students in argumentation and model building.
4- Teacher assessed students’ understanding formatively during reading and sense-making of science text. 1-Task structure did not provide opportunities for metacognitive conversation. 4. Task structure provided opportunities for metacognitive conversations (e.g. metacognitive sentence prompts, close reading tools). 1-Teacher never supported students engagement in metacognitive reading and thinking. 4- Teacher supported student engagement in metacognitive reading and comprehension monitoring routines, tools and strategies. 1-Students never used metacognitive routines, tools and strategies. 4 -Students used metacognitive routines, tools and strategies. 1-Teacher did not provide instructional supports for reading. 4- Teacher provided explicit instruction and/or modeled use of comprehension and/or disciplinary reading routines, tools and strategies. 1-Students used no comprehension or disciplinary reading routines, tools and strategies. 4- Students used comprehension and disciplinary reading routines, tools and strategies as integral part of science reading. 1-Task did not provide argumentation or model-building opportunities. 4-Task structure to provided opportunities for argumentation and/or model building; texts used to update, revise, or deepen argumentation and/or model building. 1-Teacher never supported students in argumentation and/or model building. 4-Teacher supported students in argumentation and/or model building, pushing students toward reasoned sense-making,
103
Text-based Explanatory Modeling in Science elaborating, and justifying their claims using text-based evidence. Student Practice - science argumentation 1-No student engagement in reading processes for the purposes and/or model building through reading: of argumentation and/or modeling. Extent to which students engage in reading 4-Students engaged in reading processes for the purposes of processes for purposes of argumentation argumentation and/or modeling. Students cited text-based and/or model building. evidence from multiple sources to support argument and/or model. 6. Collaboration Task structure: Participation structures 1-No formal participation structures were in place; no which support student collaboration. collaboration. 4-Participation structures support students engagement in collaboration; structures ran smoothly. Teacher support: Teacher actions support 1-Teacher did not support collaboration.. collaborative processes and disciplinary 4-Teacher mentored, facilitated, and/or modeled collaborative reading, thinking and discourse routines. processes and disciplinary reading, thinking and discourse routines. Student practice: Extent to which students 1-Students never attended to evidence, built off one another’s attend to evidence, build off one another’s ideas, asked probing questions or offered alternative ideas, ask probing questions and offer explanations. alternative explanations. 4-Students attended to evidence, built off one another’s ideas, asked probing questions, and offered alternative explanations. Note. The 6-construct observation protocol adapted from Greenleaf et al. (2011) to reflect the Project X science learning goals for building explanations from text-based evidence. As is the case throughout the paper, text as used here refers to the multiple representational forms in which scientific information is represented and communicated.
104
Table 9 Coding and Scoring and Interrater Reliability for Evidence-Based Argument Measures Data Collection Coding and Scoring Interrater Reliability Instrument (Range of Scores) % of Sample Cohen’s Kappaa Essay Coral Bleaching: 20% .81 Nodes (0 – 13) Links (0 – 12) Skin Cancer: 20% .85 Nodes (0 – 10) Links (0 - 9) Multiple Choice Number correct (0 – 9) NA NA Peer Essay Evaluation Variables mentioned (0 5% .83 6) Graphic Model Justification of choice of 20% .91 Evaluation model (0, 1) a Reliability was conducted and calculated for six subsets of responses to insure that consistency in coding was maintained across the entire set of responses. The Kappas reported for each measure reflect the averages of the six separate Kappas.
Text-based Explanatory Modeling in Science
106
Table 10. Intraclass Correlation Coefficients (ICCs) for Three Competing Multilevel Models for the Multiple Choice and GISA Performance 4-level: students, 3-level: students, 3-level: students, classrooms, teachers, classrooms, schools teachers, schools schools Multiple Choice ICC-students 69.16% 72.03% 71.85% ICC-classrooms 7.19% n/a 8.19% ICC-teachers n/a 6.50% 2.22% ICC-schools 23.65% 21.47% 17.74% GISA ICC-students 65.29% 73.44% 65.38% ICC-classrooms 16.52% n/a 19.38% ICC-teachers n/a 9.47% 0.23% ICC-schools 18.19% 17.10% 15.01%
Table 11. Comparison of Intervention and Control Teachers for Post-Intervention Scores on Survey Scales Intervention Control n = 23 n = 23 Scale Familiarity with Common Core State Standards Attitude Self-efficacy Teaching philosophy: Reading Science reading opportunities: Learning structure Higher-Order Teacher Practice Factor - Argumentation and multiple source practices - Content - Metacognitive inquiry: Teacher modeling - Metacognitive inquiry: Student practice - Negotiation success: Instruction
M
SD
M
SD
t(44)
3.17 4.21 3.44 3.92 3.70 3.95 3.90 4.12 3.94 3.87 3.91
0.78 0.64 0.83 0.74 0.45 0.31 0.40 0.47 0.40 0.43 0.41
2.96 3.90 3.02 3.72 2.85 3.05 3.20 3.26 3.02 2.78 2.99
0.75 0.66 0.82 0.56 0.74 0.56 0.62 0.75 0.71 0.70 0.57
0.97 1.64 1.70 1.03 4.72a 6.90b 4.60c 4.66 5.46d 6.37e 6.30
Cohen's d 0.29 0.48 0.51 0.30 1.37 2.00 1.34 1.37 1.60 1.88 1.85
Note. Teaching philosophy: Reading – This was reverse coded so that higher scores reflect beliefs more consistent with the Project READI perspective. One teacher in each group did not complete the post-intervention survey, resulting in n = 23 in each condition. a Equal variance is not assumed (Levene’s test: F = 6.96, p = .011), independent samples t-test: t = 4.72, df = 38.30. b Equal variance is not assumed (Levene’s test: F = 6.29, p = .016), independent samples t-test: t = 6.90, df = 36.14. c Equal variance is not assumed (Levene’s test: F = 4.78, p = .034), independent samples t-test: t = 4.60, df = 39.67. d Equal variance is not assumed (Levene’s test: F = 11.95, p = .001), independent samples t-test: t = 5.46, df = 34.68. e Equal variance is not assumed (Levene’s test: F = 8.21, p = .006), independent samples t-test: t = 6.37, df = 36.70. Cohen’s d = M2 – M1/√[(S1² + S2²)/ 2]; d values between 0.2 and 0.5 constitute a small effect, 0.5 to 0.8 a medium effect, and 0.8 or greater a large effect. *** p < .001.
Text-based Explanatory Modeling in Science Table 12. Summary of Multilevel Results for Condition for Teacher Survey and Classroom Observations ES for Condition
Construct Coefficient (SE) p Survey Familiarity with the CCSS 0.31 (0.27) .268 0.45 Attitude 0.35 (0.19) .086 0.53 Self-Efficacy 0.35 (0.23) .155 0.41 Teaching philosophy: Reading 0.31 (0.17) .100 0.46 Science reading opportunities: Learning structure 0.87 (0.21) .001 1.36** Teacher Practice: Higher-Order Score 0.99 (0.15) .000 2.21*** Argumentation and multiple source practices 0.87 (0.17) .000 1.73*** Content 1.01 (0.23) .000 1.60*** Metacognitive inquiry: Teacher modeling 0.75 (0.17) .000 1.34*** Metacognitive inquiry: Student practice 1.18 (0.19) .000 2.24*** Negotiation success: Instruction 0.98 (0.16) .000 1.89*** Classroom Observations Observation: Higher Order Score 0.63 (0.17) .002 1.28** C1 - Opportunities 0.98 (0.28) .003 1.49** C2 - Support 0.63 (0.26) .027 1.09* C3 - Inquiry 0.84 (0.32) .018 1.37* C4 - Strategies 0.62 (0.20) .006 1.07** C5 - Argumentation 0.42 (0.56) .031 0.65* C6 - Collaboration 0.70 (0.20) .003 0.83** Note. SE = standard error. ES = effect size. *p < .05; **p < .01; ***p < .001. All models were two-level models, nesting teachers (level-1) within schools (level-2) and included six school stratas (added at level-2) and a corresponding pre-test score (either pre-survey or Time-One observation) added at level-1. The results for these are omitted from this table for readability purposes. Only the 23 Intervention and 18 Control teachers who contributed data for both pre and post surveys were included in the multilevel modeling. All 48 teachers provided both Time-One and Time-Two observations.
108
Text-based Explanatory Modeling in Science
Table 13. Comparisons of the Mean Rubric Score Points on Classroom Practices Constructs for Intervention and Control Teachers, n = 24 per group. Intervention Control t-test ES Construct M SD M SD t df p d Observation: Higher Order Score C1: Opportunities C2: Support C3: Inquiry C4: Strategies C5: Argumentation C6: Collaboration
Time-One Observations 2.13 0.54 1.52 0.45 2.74 0.68 1.97 0.66 2.45 0.84 1.77 0.72 2.04 0.73 1.33 0.61 1.77 0.63 1.38 0.47 1.60 0.75 1.04 0.20 2.19 0.71 1.63 0.75 Time-Two Observations 2.42 0.62 1.41 0.35 2.92 0.80 1.77 0.64 2.90 0.80 1.78 0.59 2.36 0.95 1.25 0.43 2.04 0.79 1.17 0.38 1.71 0.94 1.00 0.00 2.58 0.77 1.51 0.67
4.29 4.00 3.00 3.66 2.48 3.51 2.70
46 46 46 46 46 26.4 a 46
.000 .000 .004 .001 .017 .002 .010
Observation: Higher Order Score 6.93 36.2 a .000 C1: Opportunities 5.49 46 .000 C2: Support 5.49 46 .000 a C3: Inquiry 5.21 32.0 .000 a C4: Strategies 4.87 33.1 .000 C5: Argumentation 3.69 23 .001 C6: Collaboration 5.15 46 .000 Note. ES = effect size. a. Levene's Test of Equal Homogeneity was significant; thus, variance is not equal across two cohorts. Cohen's d = (M2 - M1) /(SQRT((SD1^2 + SD2^2)/2));.2-.5 = small; .5-.8 = medium; >.8 = large.
1.24 1.16 0.87 1.06 0.71 1.01 0.78 2.00 1.58 1.58 1.50 1.41 1.07 1.49
109
Text-based Explanatory Modeling in Science Table 14. Within-group Comparisons of the Mean Rubric Score Points on Classroom Practices Constructs at Time–One and Time–Two Observations for Intervention and Control Teachers Paired Sample t-tests Time-One Time-Two (Time-Two – Time-One) M SD M SD t (23) p Cohen's d Intervention Teachers Observation: Higher-Order Score 2.13 0.54 2.42 0.62 2.22 .036 0.45 C1_Opportunities 2.74 0.68 2.92 0.80 0.82 .422 0.17 C2_Support 2.45 0.84 2.90 0.80 2.53 .019 0.52 C3_Inquiry 2.04 0.73 2.36 0.95 1.65 .113 0.34 C4_Strategies 1.77 0.63 2.04 0.79 1.59 .125 0.32 C5_Argumentation 1.60 0.75 1.71 0.94 0.53 .599 0.11 C6_Collaboration 2.19 0.71 2.58 0.77 2.67 .014 0.55 Control Teachers Observation: Higher-Order Score 1.52 0.45 1.41 0.35 -1.75 .093 -0.36 C1_Opportunities 1.97 0.66 1.77 0.64 -1.52 .142 -0.31 C2_Support 1.77 0.72 1.78 0.59 0.10 .925 0.02 C3_Inquiry 1.33 0.61 1.25 0.43 -0.64 .529 -0.13 C4_Strategies 1.38 0.47 1.17 0.38 -1.93 .067 -0.39 C5_Argumentation 1.04 0.20 1.00 0.00 -1.00 .328 -0.20 C6_Collaboration 1.63 0.75 1.51 0.67 -0.80 .431 -0.16 Note. Cohen's d = (M2 - M1) /(SQRT((SD1^2 + SD2^2)/2)); .2-.5 = small; .5-.8 = medium; >.8 = large.
110
Text-based Explanatory Modeling in Science
111
Table 15. Descriptive Statistics for Evidence-Based Argument (EBA) Assessment, Epistemology, Self-Efficacy, and Topic Prior Knowledge for Intervention and Control Groups for Pre-Intervention and Post-Intervention Administrations Intervention Control t-tests Total Measure n M SD n M SD t df p N Pre Intervention Multiple Choice ( % correct) 964 567 53.03 25.15 397 54.77 25.18 1.06 962 .290 Essay: Nodes (% mentioned of possible) 959 566 30.68 21.21 393 32.65 22.95 1.37 957 .172 Essay: Connections (% mentioned of possible) 959 566 13.82 16.78 393 14.99 18.51 1.02 957 .307 Topic Prior Knowledge: Coral Bleaching 474 281 2.84 0.75 193 2.93 0.75 1.26 472 .207 Topic Prior Knowledge: Skin Cancer 504 290 3.00 0.75 214 2.99 0.71 0.13 502 .898 Epistemology Survey: 1. Corroboration Scale 964 567 4.85 0.65 397 4.91 0.69 1.44 962 .152 2. Complex/Uncertain Scale 964 567 3.79 0.80 397 3.90 0.83 2.17 962 .030 Self - Efficacy Scale 949 556 3.65 0.81 382 3.68 0.77 0.61 947 .542 Post Intervention Multiple Choice ( % correct) 964 567 55.67 25.50 397 50.94 26.16 2.81 962 .005 Essay: Nodes (% mentioned of possible) 954 561 34.83 21.59 393 32.55 22.53 1.58 952 .115 Essay: Connections (% mentioned of possible) 954 561 16.45 17.02 393 15.16 16.52 1.17 952 .244 Topic Prior Knowledge: Coral Bleaching 472 282 3.03 .78 190 3.00 0.71 0.36 470 .718 Topic Prior Knowledge: Skin Cancer 499 289 2.99 0.71 210 2.98 0.65 0.11 497 .916 Epistemology Survey: 1. Corroboration Scale 946 558 4.89 0.70 388 4.80 0.75 1.88 795.07a .060 2. Complex/Uncertain Scale 946 558 4.00 0.85 388 4.00 0.83 0.02 944 .983 Self - Efficacy Scale 937 555 3.61 0.84 382 3.54 0.84 1.28 935 .202 Note. Only students who were present for all four days of the EBA pre and post testing contributed to the analyses reported in this table. Differences in total sample (N) and sample sizes for Intervention and Control groups (n) reflect missing data (e.g., Some students despite being present for all four days failed to provide any written essay in their assessment booklets). a Levene's Test of Equal Homogeneity was significant; thus, variance is not equal across the two conditions.
Text-based Explanatory Modeling in Science Table 16. Effects of Treatment Condition on Multiple Choice Posttest Performancea Variable SE t p ESb Coefficient Level-3: School (df = 17) Condition: Intervention vs Control 5.71 1.97 2.90 .010 0.26 Strata 1 43.53 3.79 11.47 .000 2.01 Strata 2 44.85 3.96 11.32 .000 2.07 Strata 3 47.48 2.89 16.44 .000 2.19 Strata 4 54.87 3.07 17.88 .000 2.53 Strata 5 53.94 2.72 19.83 .000 2.49 Strata 6 56.88 2.66 21.37 .000 2.62 Level-1: Students (individual) (df = 840) Corroboration-pre 4.69 1.08 4.33 .000 0.29 Complex/Uncertain-pre 2.96 0.89 -3.33 .001 0.22 Multiple choice performance - pre 0.45 0.04 11.08 .000 1.03 Topic -4.19 3.05 -1.37 .170 -0.19 Topic X Multiple choice-pre -0.11 0.05 -2.18 .029 -0.34 Note. SE = Standard Error a These multilevel models reflect students nested within classrooms, nested within schools. Because there were no predictor variables at level 2 = classroom, this level is not displayed in the table. b Effect Size for dichotomous variables (ES) = β1 / σ. Effect size for continuous variables (ES) = β1 *2SDiv / σ. These effect sizes are interpreted as Cohen’s d, with d = 0.2 a small effect, 0.5 a medium effect and 0.8 or greater a large effect.
112
Table 17. Effects of Treatment Condition on Essay Performancea SE t p ESb Coefficient Concept Nodes Level-3: School (df = 17) Condition 2.11 1.50 1.41 .178 0.11 Strata 1 27.14 2.88 9.42 .000 1.38 Strata 2 27.97 3.26 8.59 .000 1.42 Strata 3 32.12 2.14 15.03 .000 1.63 Strata 4 41.08 2.33 17.59 .000 2.09 Strata 5 41.27 1.97 20.91 .000 2.10 Strata 6 40.57 1.97 20.63 .000 2.06 Level-1: Students (individual) (df = 801) Corroboration-pre 3.00 1.02 2.94 .003 0.20 Self-Efficacy-pre 2.05 0.82 2.51 .012 0.16 Prior Knowledge-pre -1.91 0.89 -2.14 .032 -0.14 Topic -9.49 2.13 -4.47 .000 -0.48 Nodes (Pretest) 0.48 0.05 9.37 .000 0.05 Topic X Nodes Interaction -0.27 0.06 -4.58 .000 -0.02 (Pretest) Connections Level-3: School (df = 17) Condition 1.21 1.20 1.01 .328 0.08 Strata 1 8.31 2.26 3.68 .002 0.54 Strata 2 11.75 2.59 4.54 .000 0.76 Strata 3 11.71 1.59 7.37 .000 0.76 Strata 4 19.84 1.74 11.38 .000 1.28 Strata 5 18.33 1.47 12.49 .000 1.18 Strata 6 19.97 1.45 13.77 .000 1.29 Level-1: Students (individual) (df = 812) Complex/Uncertain-pre -1.63 0.65 -2.49 .013 -0.17 Self-Efficacy-pre 1.86 0.63 2.94 .003 0.19 Topic -2.69 1.28 -2.11 .035 -0.17 Connections (Pretest) 0.29 0.05 6.36 .000 0.04 Topic X Connections Interaction -0.12 0.06 -2.17 .030 -0.01 (Pretest) Note. SE = Standard Error a These multilevel models reflect students nested within classrooms, nested within schools. Because there were no predictor variables at level 2 = classroom, this level is not displayed in the table. b Effect Size for dichotomous variables: (ES) = β1 / σ. Effect size for continuous variables: (ES) = β1 *2SDiv / σ. These effect sizes are interpreted as Cohen’s d, with d = 0.2 a small effect, 0.5 a medium effect and 0.8 or greater a large effect.
Text-based Explanatory Modeling in Science Table 18. Effects of Treatment Condition on Comprehension of Multiple Texts: GISA Variable Coefficient Level-3: School (df = 17) Condition 4.41 Strata 1 51.95 Strata 2 52.40 Strata 3 54.08 Strata 4 53.15 Strata 5 56.24 Strata 6 59.16 Level-1: Students (individual) (df = 810) RISE 0.46 Corroboration (Pretest) 1.77 Simple/Certain (Pretest) -1.54 Self-efficacy (Pretest) 0.16 Note. These multilevel models reflect students nested within classrooms, nested within schools. Because there were no predictor variables at level 2 = classroom, this level is not displayed in the table. SE = Standard Error a Effect Size for dichotomous variables (ES) = β1 / σ. Effect size for continuous variables (ES) = β1 *2SDiv / σ. These effect sizes are interpreted as Cohen’s d, with d = 0.2 a small effect, 0.5 a medium effect and 0.8 or greater a large effect.
114
Text-based Explanatory Modeling in Science
115
Figure Captions for AERJ 17-0596 Figure 1. Research Design Timeline for Efficacy Study Figure 2. Representations of complete and coherent models that could be constructed from text sets for a. Skin Cancer and b. Coral Bleaching. Causal links are indicated by solid arrows; Inferred causal links are indicated by dashed arrows. Figure 3. Scatterplots showing the relationship between self-reported practices and observed practices by condition. Scatterplot a shows the relationship between higher order self-reported practices-pre (measured prior to start of Intervention professional development) and the TimeOne observations (conducted between four to seven weeks into the intervention) for the 24 Intervention and 19 Control teachers who completed the pre-survey. Scatterplot b shows the relationship between higher-order self-reported practices-post (at the end of the intervention) and Time-Two observations (conducted eight to ten weeks after the first observation) for 23 Intervention and 23 Control teachers who completed the post-survey.
Text-based Explanatory Modeling in Science
117
a. ↑ direct sunlight (2)
closer to equator (1)
↓ Melanin (11)
↑ RNA damage(4 )
↑ UVb radiation (3)
↑ sunburn (5)
↓% damaged cells removed (6)
↑ skin cancer (50)
↓ protection (12)
+ ↑ UVb radiation (3)
b.
↓ trade winds or reverse (1)
↑ warm waters eastward (2)
storms bring rain (11)
↑ water temps (3)
↑ fresh water in ocean (12)
↓ CO2 in water (4)
↓ salinity (13)
↓ photo -synthesis (5)
↓ chemicals to coral for food (5b)
threatens balance for health (14)
↑ coral stress (6)
death or ejection of Algae (7)
Coral bleaching occurs (50)
a.
b.
Supplementary Materials available online
119
Appendix A. Specifics of the Four Phases of Learning for 9th Grade Biological Sciences Earlier phases prepare students for the activities of the subsequent phases. Phase One: Building Classroom Routines to Support Science Literacy And Meaning Making. This phase was intended to establish a classroom culture through instructional routines and participation structures that engaged students in close reading of text along with class-wide, critical discussion. This culture emphasized that accepted processes for building science knowledge involved reading and reasoning processes that drew on materials provided in class. Students were encouraged to make their thinking visible, including conceptions they brought to the reading based on prior experiences. Text materials used during this phase were a combination of teacher-selected and Project READI-provided. They covered the topics for the initial month of instruction: big ideas in biology that would be reflected in subsequent instruction and cell biology (see Table 4, last row). Tools such as annotation and talk stems were introduced, their use modeled by the teacher and then turned over to students. Teachers also modeled close reading with concurrent think-alouds to make visible their thinking and reasoning during reading, including noticing things that did not seem to fit with prior knowledge or previously read material, struggles to understand specific technical terms, and connections to other science content. Following the modeling, teachers used metacognitive conversation stems to prompt students to report what they noticed that the teacher was doing during the close reading, how it was being done, and why. Examples include “What did you notice about … my thinking? …what I struggled with? …what I did when I was struggling with something?” (For more information see Schoenbach, Greenleaf, & Murphy, 2012.) Students were expected to use the tools for independent reading in preparation for discussing with a peer (pair share) or small group. Small groups were expected to share one or two key ideas with the whole class as a basis for discussion of key ideas, identification of questions, sources of confusion, etc. These whole-class shareouts often served to direct subsequent inquiry. Phase Two: Building A Repertoire Of Science Literacy And Discourse Practices. In phase two, the instructional routines and student activities were employed for purposes of deepening reading and reasoning about biological phenomena and systems (e.g., how biologists represent entities such as cells and biochemical phenomena by attending to the kind of evidence embedded in different types of texts, the interpretations that could be drawn from them, and how the evidence and interpretations were relevant to constructing explanations of cellular and biochemical phenomena. Materials included teacher-supplied texts on cell biology and two modules designed by Project READI, Reading Models and Homeostasis (Ko et al., 2016; Sela, Brown, Jaureguy, Childers, & Ko, 2016). The Reading Models module began with a text excerpted from a standards-based curriculum, Investigating and Questioning our World Through Science and Technology (IQWST), that discussed why and how scientists use models (Krajcik, Reiser, Sutherland, & Fortus 2011).1 The remainder of the module used an adapted version of an elicitation task (Pluta, Chinn, & Duncan, 2011) applied to representational models of biology content for purposes of developing criteria for biological models. These criteria were then applied
Supplementary Materials available online
120
in the Homeostasis module, which spanned phases two and three. Routines for reading and discussing science texts (e.g., think aloud, annotation, and metacognitive conversations) were incorporated into this module to support sense-making, evidence, and interpretation processes. Phase Three: Deepening Scientific Literacy And Discourse Practices For Reasoned Sensemaking. The reading and reasoning practices and dispositions introduced and practiced in the first two phases were applied to modeling the biological systems principle homeostasis. The Homeostasis module provided a sequenced set of texts and tasks that built toward a complete and coherent causal explanatory model of how balance is maintained. Tools introduced earlier (e.g., evidence/interpretation charts, talk stems, metacognitive discourse routines) supported students in creating and revising models that deepened in complexity (type and number of components, connections among components) over the course of the module. For example, after several readings about effects of water - sodium imbalances, students worked with a partner to draw a model of what might be happening inside a patient who had hypernatremia, and indicated what information from the readings they had drawn on for their model. Later they worked with a diagrammatic model of the body’s response to low versus high concentrations of sodium in the blood and discussed what it and did not explain, providing evidence for their critiques based on the prior readings they had done in this module. Modeling activities were motivated by driving questions sparked by popular press pieces (e.g., a runner dying from drinking too much water during a race, a patient experiencing dementia). The texts and activities were sequenced to intentionally stimulate students to reflect on how their thinking and models were changing as they learned more, what questions they had, and what further modifications to their models might be needed. The second part of the Homeostasis module revisited the question of how the body works to maintain balance and what happens when balance is disrupted in the context of diabetes. The latter part of phase three introduced the last set of science topics for the semester, genetics, heredity and evolution. The Project READI MRSA (methicillin resistant staphylococcus aureus) module (Brown et al., 2016) dealing with antibiotic resistant bacteria supported inquiry into these topics. Phase Four: Utilizing Scientific Literacy And Discourse Practices For Disciplinary Knowledge Building. This phase was intended to deepen text-based inquiry goals by introducing justification and critique of causal explanatory models. Within the MRSA module, students worked with a variety of texts to construct, justify and critique models related to four aspects of MRSA: infection, transmission and spread, evolution of staphylococcus aureus into a methicillin resistant form, and managing public health challenges of MRSA. Phase four employed all of the tools and routines of the previous phases (peer to peer and class-wide discussions) and two new components: peer review of the models constructed by other small groups and an emphasis on presenting and explaining models and recommendations based on the models. Endnote for Appendix A 1
According to the authors of IQWST, this curriculum, developed with NSF support, engages students in conducting investigations to address driving questions that related to their lives.
Supplementary Materials available online
121
Instructional activities include collecting and analyzing data, creating models to explain phenomena, and arguing from evidence. The curriculum emphasizes discussion and hands-on data collection with verbal text used primarily to supply background information. Attention is devoted to collecting, analyzing, and interpreting data in the context of evolving explanatory models. Unlike the Project READI approach, relatively little attention is paid to building comprehension and sense-making strategies and metacognitive awareness for reading and reasoning from verbal text.
References for Appendix A
Brown, W., Ko, M., Greenleaf, C., Sexton, U., George, M., Goldman, S. R., with CA Teacher Inquiry Network Science Teachers. (2016). Life sciences: The spread of MRSA. High school, grade 9, spring 2013, RCT fall 2014. Project READI Curriculum Module Technical Report CM #27. Retrieved from URL: www.projectreadi.org Ko, M., Sarna, J., Stites, J., Goldman, S. R., Brown, W., James, K., & Greenleaf, C. (2016). Life sciences: Homeostasis, high school, 9th grade. Project READI Curriculum Module Technical Report CM #28. Retrieved from URL: wwwprojectreadi.org Krajcik, J., Reiser., B., Sutherland, L., & Fortus, D. (2011). IQWST: Investigating and questioning our world through science and technology (middle school science curriculum materials). Greenwich, CT: Sangari Active Science. Pluta, W. J., Chinn, C. A., & Duncan, R. G. (2011). Learners’ epistemic criteria for good scientific models. Journal of Research in Science Teaching, 48, 486–511. Schoenbach, R., Greenleaf, C., & Murphy, L. (2012). Reading for understanding: How Reading Apprenticeship How Reading Apprenticeship Improves Disciplinary Learning in Secondary and College Classrooms, 2nd Edition. SF: Jossey-Bass, Inc. Sela, R., Brown, W., Jaureguy, A., Childers, E., & Ko, M. (2016). Reading science models, high school, grade 9. Project READI Curriculum Module Technical Report CM #29. Retrieved from URL: www.projectreadi.org
Supplementary Materials available online
122
Appendix B. Project READI science modules used in the intervention classrooms The Project READI curriculum materials focused on high school biology and consisted of two text sets, instructional tools, learning activities, and three modules sequenced to systematically build students’ knowledge, skills, and stamina and thereby support them in making progress on the Project READI science learning goals. The goals include science literacy and inquiry practices as well as epistemological understanding. A brief synopsis of the three modules is provided here: Reading models, Homeostasis, MRSA. Full versions of these modules are available on the Project READI website (www:projectreadi.org) Reading Science Models To develop the Reading Science Models, we reviewed the emerging literature from the field focused on argumentation as well as the work focused on building empirical learning progressions for science explanation and science modeling. As a result of that reading, we were introduced to an elicitation task for students’ understanding of science models that was developed by Pluta, Chinn, and Duncan (2011). We requested and received permission to use these elicitation materials in our science design work. READI science design team members analyzed the model criteria elicitation materials used by Pluta, Chinn, and Duncan (2011) to find commonalities with our design principles and core constructs and to identify gaps that module development would need to address. As a result of that analysis, and to address the identified needs of teachers and students from our early implementation, we augmented the model criteria elicitation task to focus more explicitly on inquiry with science texts, rather than assessment of student ideas alone. Thus, we introduced pedagogical tools and practices for engaging students in close reading of a variety of science texts, including the varied models in the elicitation materials, through teacher and student Think Aloud and discussion routines, in sync with our other science design work and modules and drawing on our prior work (Greenleaf, Hale, Charney-Shirott, & Schoenbach, 2007; Schoenbach, Greenleaf, & Murphy, 2012) . To this end, we searched for an authoritative text on why and how scientists use models and received permission from Reiser to excerpt a text from the IQWST materials (Krajcik, Reiser, Sutherland, & Fortus, 2011). This early unit is designed to put in place early scaffolds for reading science texts (Think Aloud and metacognitive conversations) as well as discourse routines to support ongoing sense-making, and ultimately, argumentation. The Reading Models module supports students’ close reading of science visuals and models germane to high school biology while building knowledge about the conventions of scientific models and the criteria for evaluating them. The module is comprised of a set ten texts within a notebook with integrated routines, scaffolds, tasks and an annotated teacher guide. The initial tasks engage students in reading and discussion of "Explanatory Models in Science," an authoritative text about science models (National Center for Mathematics and Science, 2002). The subsequent tasks engage students in reading and discussion of nine visuals and visual models. The discussions include metacognitive conversations about the reading and sense making processes to build knowledge of the conventions of science models. To support knowledge building of the model criteria, the module engages students in an evaluation tasks requiring application of science model criteria. These tasks are adapted from an elicitation task for student understanding of science models developed by Pluta, Chinn, and Duncan (2011).
Supplementary Materials available online
123
Homeostasis Investigation The Homeostasis module supports science reading and introduces the use of texts as tools for constructing, revising and defending explanatory models of phenomena that relate to disciplinary core ideas in Biology. The Homeostasis Investigation focuses on two examples of homeostasis in a human body: the balance of sodium and sugar concentrations in blood serum. In line with our design principles, the module includes multiple texts of multiple modalities (e.g. clinical studies of hypernatremic patients, news stories, diagrams from Biology textbooks, and texts from the New York Times and The New Yorker). The module includes explicit modeling and explanation tasks, peer review with scientific argumentation for the modeling and explanations tasks. Each of these tasks requires that students use information from texts in the text set to develop, refine, and apply explanatory models to related phenomena around the disciplinary core idea of Homeostasis. The Homeostasis Investigation is linked to the third learning phase, deepening scientific literacy and discourse practices for reasoned sensemaking, in which multiple text synthesis and modelling are introduced. The intention of this phase is for students to use the knowledge, skills, and dispositions introduced and practiced in the first two phases for purposes of constructing a causal explanation of science phenomena. We collaborated with two high school biology teachers to select human homeostasis as a topic for the module, based on the college readiness frameworks (Annenberg Institute for School Reform et al., 2014), the Common Core State Standards (Council of Chief State School Officers, 2010), the Chicago Public School Biology content frameworks and the Next Generation Science Standards (NGSS Lead States, 2013). During our design-team meetings, we brainstormed the breadth and depth of scientific principles that we wish to target. In the subsequent meetings, we brought text candidates and discussed potential sequencing possibilities, based on the causal models that were created for each phenomenon and identified affordances each text provided for building a repertoire of close reading practices. Next, the two design teachers used these texts with their students, which informed the final set of meetings. We debriefed with teachers and probed for how these texts were used in the classroom, its affordances for close reading and knowledge building, and the kinds of texts and tasks that would support these sense-making discussions. Through this iterative process, we decided to focus on 2 cases that exemplify how feedback within and between organ systems maintains homeostasis in the human body. The first half of the module focuses the maintenance of sodium ion levels in the blood – both cases of when the balance is in maintained and when it is disrupted (hypo- and hypernatremia). The second half of the module focuses on how the body maintains appropriate blood sugar levels, and cases when this balance is disrupted (e.g. Diabetes). The Homeostasis module text set includes both texts that are specific to mechanisms that govern salt and sugar balance, as well as more generalized texts that describe on the principles of human homeostasis. After selecting these two phenomena as the central focus of the Homeostasis module, research members of the design team studied the phenomena in detail (consulting with multiple reputable online and textbook sources) to generate causal model that would accurately describe and explain the feedback mechanisms that regulate salt and sugar balance in the human body. These explanatory models were then brought to the teacher partners and discussed and revised for accuracy and simplicity. Through this discussion, we also identified the critical features of these explanatory models that would be set as targets for students learning, as well as the features
Supplementary Materials available online
124
developmentally or instructionally inappropriate for 9th grade high school Biology students. These complex, evidence-based models served as the guideline for text-selection process, helping us determine the affordances of a given text for scientific knowledge building. We simultaneously evaluated whether or not texts afforded opportunities to engage students in discussions of the close reading practices and variety of texts representative of those encountered in science. MRSA Investigation The MRSA module supports students’ science reading and engagement in modeling, explanation, and argumentation to build knowledge of core science concepts. The topic of methicillin resistant Staphylococcus Aureus (MRSA) affords the opportunity to learn natural selection, adaptation, and human impact on evolution. As such, it involves cross cutting concepts (NGSS Lead States, 2013) such as cause and effect; systems and interactions and, to a degree, scale, proportion, and quantity. MRSA also offers direct relevance to students since adolescents are at increased risk for contracting MRSA, and entails sufficient complexity to foster questioning, argumentation, and modeling. The MRSA Text-Based Investigation consists of four sections: MRSA infection, transmission and spread of MRSA, evolution from SA to MRSA, and managing the public health challenge of MRSA which build on each other conceptually and in literacy practices. Each section engages students in reading multiple texts and in science argumentation. The first three sections engage students in developing an explanatory model for MRSA and in argumentation about their models. The final section focuses on designing interventions based on the models and in argumentation about their interventions. Throughout the MRSA TBI, students do the challenging work of reading, evidence gathering, piecing together explanatory models, and arguing about their models. The MRSA Module text set consisted of 13 texts representing a range of sources; five from university websites, three from news agencies, two from science research journal reports, one each from the CDC website, a high school biology textbook excerpt, and a popular science magazine. They also offered a range of information in diverse representations: MRSA news stories, statistics on MRSA deaths, MRSA-human ecology, timelines showing antibiotic use and antibiotic resistance, models of evolution, and potential interventions. Four texts featured visuals: three graphs and one visual explanatory model. The MRSA Module Interactive Notebook includes integrated routines, scaffolds, and tasks. Inquiry questions support student engagement with the phenomena. Notetakers support students in identifying and reasoning about evidence in the texts; and modeling and argumentation tasks to engage students in these science practices. The routines for the reading and modeling tasks provided opportunities to assess students’ reading for modeling and to incorporate scaffolds responsively – orchestrating student groupings and timing; chunking texts and reading; offering strategic modeling of reading and modeling processes; and facilitating metacognitive conversations to deepen engagement, solve problems, and build knowledge of science principles and practices. An annotated teacher guide provides support for implementation. The MRSA investigation is linked to the fourth learning phase, utilizing scientific literacy and discourse practices for disciplinary knowledge building, in which reading is framed as investigation, and the work of argumentation, drawing on science principles, to develop and refine models and explanations is foregrounded. It may be used subsequent to the Reading Science Models module and the Homoeostasis investigation to provide ongoing opportunities to learn.
Supplementary Materials available online
125
References for Appendix B Annenberg Institute for School Reform, Brown University; John W. Gardner Center for Youth and their Communities, Stanford University; & University of Chicago Consortium on Chicago School Research. (2014). Beyond college eligibility: A new framework for promoting college readiness. College Readiness Indicator Systems Resource Series. Seattle, WA: Bill & Melinda Gates Foundation Council of Chief State School Officers (CCSSO) (2010). The Common Core Standards for English Language Arts and Literacy in History/Social Studies and Science and Technical Subjects. Downloaded from http://www.corestandards.org. Greenleaf, C., Hale, G., Charney-Sirott, I., & Schoenbach, R. (2007). Reading apprenticeship academic literacy curriculum. San Francisco: WestEd. Krajcik, J., Reiser., B., Sutherland, L., & Fortus, D. (2011). IQWST: Investigating and questioning our world through science and technology (middle school science curriculum materials). Greenwich, CT: Sangari Active Science. National Center for Mathematics and Science (2002). Modeling for understanding in science education: Explanatory models in science. Madison, WI: Wisconsin Center for Education Research, University of Wisconsin, Madison. Accessible 9/25/17: http://ncisla.wceruw.org/muse/models/index.htm. Next Generation Science Standards Lead States (2013). Next Generation Science Standards: For States, by States. Washington, DC: National Academies Press. Pluta, W. J., Chinn, C. A., & Duncan, R. G. (2011). Learners’ epistemic criteria for good scientific models. Journal of Research in Science Teaching, 48, 486–511. Schoenbach, R., Greenleaf, C., & Murphy, L. (2012). Reading for understanding: How Reading Apprenticeship How Reading Apprenticeship Improves Disciplinary Learning in Secondary and College Classrooms, 2nd Edition. SF: Jossey-Bass, Inc.
Supplementary Materials available online
Appendix C. Instructions for the four evidence-based argument assessment tasks
Task Introduction and Instructions for Reading Skin Cancer One purpose of reading in science is to understand the causes of scientific phenomena; in other words, we read to understand how and why things happen. To do this, we often need to gather information from multiple sources. Today you will be reading about what causes some people to experience abnormal cell growth like skin cancer. You will have to piece together important information across multiple sources to construct a good explanation of how and why this happens. No single source will provide all of the important pieces of the explanation. Instead, you are the one making connections across sources and coming up with an explanation. Your task is to read the following set of sources to help you understand and explain what leads to differences in the risk of developing skin cancer. While reading, it is important to show your thinking by making notes in the margins or on the texts. You will be asked to answer questions and use specific information from the sources to support your ideas and conclusions. You can read the sources in any order you wish, but you should read the sheet called “Background: Skin Damage” first, because it gives general information on the topic.
Coral Bleaching One purpose of reading in science is to understand the causes of scientific phenomena; in other words, we read to understand how and why things happen. To do this, we often need to gather information from multiple sources. Today you will be reading about what causes “coral bleaching”. Coral, which lives in the ocean, can be many different colors, but sometimes it loses its color and turns white. You will have to piece together important information across multiple sources to construct a good explanation of how and why this happens. No single source will provide all of the important parts of the explanation. Instead, you are the one making connections across sources and coming up with an explanation. Your task is to read the following set of sources to help you understand and explain what leads to differences in the rates of coral bleaching. While reading, it is important to show your thinking by making notes in the margins or on the texts. You will be asked to answer questions and use specific information from the sources to support your ideas and conclusions. You can read the sources in any order you wish, but you should read the sheet called “Background: What is ‘Coral Bleaching?’” first, because it gives general information on the topic.
Essay Writing task
126
Supplementary Materials available online Using this set of documents, write an essay explaining what leads to differences in the risk of developing skin cancer. Make sure to connect the ideas within your explanation to the differences in the risk of developing skin cancer. Be sure to use specific information from the documents to support your ideas and conclusions.
Using this set of documents, write an essay explaining what leads to differences in the rates of coral bleaching. Make sure to connect the ideas within your explanation to the differences in the rates of coral bleaching. Be sure to use specific information from the documents to support your ideas and conclusions. Multiple Choice Items Based on the documents you read, please Based on the documents you read, please select the option that best fills in the blanks select the option that best fills in the blanks to answer the question: “explain what to answer the question: “explain what leads to differences in the risk of leads to differences in the rates of coral developing skin cancer.” bleaching.” Explanation Evaluation Task Below are explanations written by students Below are explanations written by students like you who are explaining what leads to like you who are explaining what leads to differences in the rates of coral bleaching. differences in the risk of developing skin Read the explanations and answer the cancer. Read the explanations and answer questions that follow. the questions that follow. (Explanation 1) Q1. Considering the essay question what (Explanation 1) did the student do well in the explanation? Q1. Considering the essay question what Q2. Considering the essay question what did the student do well in the explanation? advice would you give the student for Q2. Considering the essay question what improving the explanation? advice would you give the student for (Explanation 2) improving the explanation? (Explanation 2) Q1 then Q2 as for Explanation 1. Q1 then Q2 as for Explanation 1.
Graphical Model Comparison Above you can see two graphic models. The arrows between the boxes indicate connections between steps in the process. The arrows within the boxes indicate increases and decreases in components of the process. Which graphic model above provides the best explanation for what leads to differences in the risk of developing skin cancer? Circle you answer: Model 1 or Model 2 Why do you think the model you selected is better?
Above you can see two graphic models. The arrows between the boxes indicate connections between steps in the process. The arrows within the boxes indicate increases and decreases in components of the process. Which graphic model above provides the best explanation for what leads to differences in the rates of coral bleaching? Circle you answer: Model 1 or Model 2. Why do you think the model you selected is better?
127
Supplementary Materials available online
128
Appendix D. Preliminary Analyses: Teacher Self-Report Survey and Classroom Observations Table D1. Teacher Survey: Exploratory Factor Analyses and Reliability Analyses at Pre and Post Administrations Pre Post # of Factor Factor items Loadings: Variance Loadings Variance a Scale Range Explained αb : Range Explained αb Attitude 9 .51 - .81 48.01% .88 .55 - .90 54.21% .91 Self-efficacy 9 .75 - .92 68.90% .95 .71 - .96 69.10% .95 Teaching philosophy: Reading 5 .51 - .77 43.30% .78 .42 - .80 44.90% .77 Science reading opportunities: Learning structure 4 .40 - .73 37.30% .69 .54 - .77 46.90% .77 c Higer-Order Teacher Practices 5 .63 - .86 51.3% .69 .86 -.88 74.2% .93 c Argumentation and multiple source practices 9 .40 - .73 37.30% .69 .54 - .77 46.90% .77 c Content 3 .47 - .74 42.20% .67 .33 - .97 61.30% .70 c Metacognitive inquiry: Teacher modeling 5 .44 - .78 34.00% .70 .66 - .81 54.50% .85 c Metacognitive inquiry: Student practice 7 .47 - .74 34.00% .70 .65 - .78 51.30% .87 c Negotiation success: Instruction 5 .34 - .90 42.80% .75 .48 - .91 46.90% .79 Note. The pre-professional development survey was completed by 43 teachers (24 Intervention and 19 control). The post-intervention survey was completed by 46 teachers (23 Intervention and 23 Control). Both pre and post surveys were completed by 41 teachers (23 Intervention and 18 Control). a The numbers in this column reflect the removal of the Common Core State Standards familiarity item plus 15 items that yielded factor loadings < .32 on EFAs conducted on the full set of 72 items on the pre and post surveys. b α is Cronbach's alpha. c The five Teacher Practice Scales included in Higher-Order Teacher Practices factor.
Supplementary Materials available online
Table D2. Exploratory Factor Analysis for Six Constructs at Observation Time-One and at Time-Two (N = 48) Variance Loadings Cronbach's # of indicators Explained Range Alpha Time-One C1: Opportunities 4 51.37% .37 - .89 .79 C2: Support 4 71.12% .75 - .90 .91 C3: Inquiry 3 66.77% .79 - .86 .84 C4: Strategies 2 62.57% .79 - .79 .77 C5: Argumentation 3 86.98% .90 - .97 .95 C6: Collaboration 3 65.42% .77 - .84 .84 Time-Two C1: Opportunities 4 61.92% .69 - .91 .86 C2: Support 4 71.37% .80 - .91 .90 C3: Inquiry 3 75.96% .83 - .95 .90 C4: Strategies 2 77.47% .88 - .88 .87 C5: Argumentation 3 89.11% .92 - .97 .93 C6: Collaboration 3 71.26% .75 - .89 .88
129
Appendix E Descriptive Statistics for Pre-Administration of Teacher Self-Report Survey Table E1. Teacher Self-Report Survey: Descriptive Statistics for Ratings on the Pre Administration Intervention n = 24 Scale
M
SD
Control n = 19 M
SD
t (41)
Cohen's dc 0.18 0.08 0.55 0.03 0.09 0.14 0.17 0.33 0.18 0.20 0.03
Familiarity with Common Core State Standards 2.58 1.02 2.75 0.91 -0.57 Attitude 3.76 0.46 3.81 0.82 0.22a Self-efficacy 3.39 0.76 2.96 0.80 -1.79 b Teaching philosophy: Reading 3.58 0.66 3.56 0.70 0.08 Science reading opportunities: Learning structure 2.79 0.76 2.72 0.74 -0.30 Higher-order Teacher Practices 2.87 0.47 2.94 0.54 -0.45 - Argumentation and multiples source practices 3.13 0.54 3.23 0.62 0.59 - Content 3.03 0.67 3.26 0.79 1.06 - Metacognitive inquiry: Teacher modeling 2.99 0.58 2.88 0.63 -0.58 - Metacognitive inquiry: Student practice 2.45 0.70 2.59 0.60 0.66 - Negotiation success: Instruction 2.73 0.61 2.72 0.77 -0.08 Note. Five teachers in the Control condition did not complete the pre-survey, hence n = 19. a Equal variance is not assumed (Levene’s test: F = 6.73, p = .013), independent samples t-test: t = .22, df = 28.71. For all other scales, equal variance was assumed. b Teaching philosophy: Reading – This was reverse coded so that higher scores reflect beliefs more consistent with the READI perspective. c Cohen’s d = M2 – M1/√[(S1² + S2²)/ 2]; d values between 0.2 and 0.5 constitute a small effect, 0.5 to 0.8 a medium effect, and 0.8 or greater a large effect.