Available online at www.sciencedirect.com
ScienceDirect Procedia - Social and Behavioral Sciences 110 (2014) 215 – 222
Contemporary Issues in Business, Management and Education 2013
Exploitation of quantitative methods for the assessment of regional performance of the Slovak economy Ivan Holúbeka, Marta Vrábelováa, Milan Maroša* a
Constantine the Philosopher University in Nitra, Faculty of Natural Sciences, Trieda A. Hlinku 1, 949 74 Nitra, Slovakia
Abstract Regional disparities in the EU regions have lately managed to become the interest of professional and lay public. Since 1989 the Slovak Economy has undergone the transformation process from centrally planned economy to market-oriented economy. Before 1989 Czechoslovakia belonged to the countries with the most reduced regional differences. However, this state lasted only based on the loss of competitiveness of subjects from the most developed country regions from the point of view of history. After 1989 there was the decrease of induced efforts for balancing the disparities to analogous differences at the level or regions. The article deals with the regional analysis of GDP at the level of Slovak regions (NUTS 3) by the means of quantitative methods. Its aim is to refer to possible solutions for ceasing the deepening of regional disparities and fulfilment of the aim of convergence criteria not only in the conditions of Slovakia but also in other regions of EU. Authors. Published Published by by Elsevier Elsevier Ltd. Ltd.Open access under CC BY-NC-ND license. © 2014 The Authors. Selection and peer-review under under responsibility responsibility of of the the Contemporary Contemporary Issues Issuesin inBusiness, Business,Management Managementand andEducation Educationconference. conference. Keywords: GDP; regional disparity; NUTS 3; economy; quantitative methods.
1. Introduction Regional disparities have lately managed to become the interest of professional and lay public. They are characterized as the differences at the level of social-economic development of regions. Politicians, economists, political scientists and geographers started to be interested in the regional disparities after Slovakia entered the European Union in 2004. They also started to appear in the list of the problems perceived by the society. The aim of
* Corresponding author. Tel.: +421-37-6408601. E-mail address:
[email protected]
1877-0428 © 2014 The Authors. Published by Elsevier Ltd. Open access under CC BY-NC-ND license. Selection and peer-review under responsibility of the Contemporary Issues in Business, Management and Education conference. doi:10.1016/j.sbspro.2013.12.864
216
Ivan Holúbek et al. / Procedia - Social and Behavioral Sciences 110 (2014) 215 – 222
the regional policy of EU lies in the process of convergence of regional difference extenuation in the EU countries. The efforts for the intentional impact of social and economic development of certain areas appeared just during the morning of human history. Slovakia as a part of socialistic Czechoslovakia belonged to the countries with the most reduced regional differences at the end of 1980´s (Sloboda, 2013). Centrally planned economy reached the reduction of regional differences only at the basis of the loss of competitiveness of subjects that operate in more developed regions of the country. Repressed differences at the level of regions development got real after the Velvet Revolution in November 1989 and after the transformation of centrally planned economy into market-oriented economy. Nowadays, Slovakia as a member state of EU is a part of a higher complex where political structures try to balance the regional disparities via the state assistance and stimuli. The base for the research of regional differences are the theories of regional development that are inspired by the theories of economic development or they directly follow from them. The most famous ones are convergence and divergence theories of regional development in an inductive or deductive way, or the theories emphasizing the demand and offer. The basic theories differ from each other based on the issue related to the role of the state in society and economy. Several approaches to the role of the state are known from the economic theory. Neoclassic approach prefers an automatic mechanism of the market. It follows from the fact that the market provides optimal allocation of factors between the regions and also takes care of the respective division of rents within the elimination of the impacts of the state. The regional differences are sorted out by the motion of capital and the migration of the workforce from developed to less developed regions where the capital is attracted by the existence of low salaries and the abundance of jobs. It is the process in a long-term time horizon and the region itself gets to the balance state (convergence). The role of regional politics in this model is the elimination of imperfections of market that include the asymmetry of information, existence of imperfect competitiveness or barriers of goods mobility and production factors. Economic reality shows the fact that unrestricted impact of market forces leads to unequal economic development of regions in a short-term horizon. Keynesian approach within the regional development claims that market itself is not able to provide the full employment and therefore the state must interfere in economic processes by the economic stimulation of domestic consumption demand and via the support of private investment. Neoliberal approach within the theories of regional development emphasizes the role of the market for the effective allocation of sources and the activity of an individual. They prefer only minimal and limited state interventions focused on the elimination of the barriers of market mechanisms functioning. Neoinstitutional approach of regional development applies for example the theory of production district. The base of the region prosperity are quality social, cultural and institutional structures and non-hierarchical system of the organisation of small companies cooperation. It flourished from the savings of the range and specialization and work division among companies, information sharing etc. (Sloboda, 2006). The role of regional policy in this model is the existence of collective institutions supporting small and middle companies. A traditional method of regional geography is the individual regionalization, which allocates distinctive (original) regions and the typological one that allocates regions types. The regional policy of EU whose aim is to reduce the regional differences, uses the institutional classification known under the acronym of NUTS within the allocation of planned help (Sloboda, 2006). This methodology was elaborated by Eurostat with the aim of the division of the area of EU countries into the areas of lower hierarchical rang than national states represent. The classification system (NUTS) consists of three regional levels (NUTS 1 to NUTS 3) and two local levels (NUTS 4 and NUTS 5). In our article we used the current statistical data at the level of regions (NUT 3) for the characteristic of regional differences from the point of view of sufficient selection of indicators. The source of data was the Statistical Office of the Slovak Republic and the database of Eurostat respectively. We encountered the problem of relevance and currentness of these data within gaining the data. From them we process e.g. the indicator of regional GDP is processed in databases with delay. The most important economic and social indicators of regional disparities in European context and Slovak conditions are the amount of GDP measured per a person in the parity of purchasing power, the employment rate or the unemployment rate, eventually the amount of average real salaries. Gross Domestic Product in market prices is a final result of production activity of residential production units generated within the current accounting period (Holman, 2010). Regional Domestic Product is calculated as the summary of added values for the sectors within a region and taxes on the products reduced by subventions per products. Regional Domestic Product is expressed in parity of purchasing power for the sake of international comparisons. Purchasing
Ivan Holúbek et al. / Procedia - Social and Behavioral Sciences 110 (2014) 215 – 222
Power Parity is calculated upon the prices and volumes of good purchase that are mutually comparable and representative for the countries included in the comparison. Purchasing Power Parity eliminates the effects of different price level among countries (Tvrdoň, 2012). Gross Domestic Product cannot be confused with the indicator of household incomes. Regional Domestic Product per an inhabitant is a quotient of two indicators - regional gross domestic product (which applies the criterion of compilation according to the workplace) and average number of inhabitants permanently living in a given region (based on the principle of residence). In most of regions, the comparison of these two indicators based on various principles does not cause bigger problems. In case of the regions with high level of commuting to work from surrounding regions – they are mostly the regions of capital cities, this indicator is overestimated. In Eurostat the ways are being searched for within academical discussions and important projects that would lead to the solution of denouncing ability of this indicator, or to the substitution of the indicator of the average number of permanent population by another indicator. Measuring of regional disparities also entails several problems. There is currently a worldwide social discussion about the reliability, denouncing ability and correctness of the methodological calculation of GDP. We list some of the problems for the sake of complexity of the issue that is being solved. For example, GDP is not a deterministic but a stochastic quantity. We cannot measure the performance of grey and black economy via GDP (Nováček, 2010). The level of nominal GDP often depends on deformed prices and finally, a high level of goods and services production measured by GDP is not a measure of real benefit balance even by extra-work activities. A basic indicator of job market is unemployment. Statistical Office of the Slovak Republic defines the economically active population as the summary of employed and unemployed people. In the database of Statistical Office of the Slovak Republic there is this indicator reporter by the unemployment rate. The unemployment rate is the share of unemployed people from the group of economically active population. The indicator is expressed in percentage. The problem from the methodological point of view is the fact that during the data collection, persons are classified according to permanent address and not according to the work place. The indicator of the level of average nominal monthly salary is used together with others as a social-economic indicator for monitoring the regional disparities. The average monthly salaries show the average monthly level of salaries of an unemployed person for the whole economy of the Slovak Republic. According to the statistics of Statistical Office of the Slovak Republic the average monthly salaries are calculated by averaging the summary of total monthly salary at monthly base and its division by the average daily employment rate per a quarter. A deficiency of the measuring of this indicators is impossibility of monitoring the development of price level at the level of regions (NUTS 3) and the representativeness of a given sample that is influenced by the development of the price level. The average real monthly salary in central regions and in the regions of capital cities is often distorted by the fact that the headquarters of state and above regional companies operate in these regions. The highest proportion of managers is concentrated there. The crisis that has been in Europe for 5 years, meant a shock. There was a fall into the economy recession after the period of prosperity, economy development and social securities. Therefore the aim of the article is to analyse the main economic and social indicators by the means of quantitative and statistical methods. They serve for the assessment of economic power of Slovak regions at the level of NUTS 3. 2. Matter of using method Cluster analysis is a research tool for the analysis of multidimensional data. Its aim is to categorize cases - objects (people, things, events, etc.) into groups so that the level of grouping be strong among the members of the same groups and weak among the members of the different groups. The application of suitable algorithms can reveal the structure of data set that is not known before and it can classify individual objects. Such a classification can help to formulate the hypotheses about the origin of a sample, describe the sample with the regard to typology, e.g. for the analysis of the market or administrative purposes, optimize the functional processes and so on (Rencher, 2002). Within the clustering of objects we find the matrices of data X, type n x p, where n is the number of objects and p is the number of variables. We consider various decompositions of n objects into k clusters. We search for such a decomposition that would be the most convenient from a certain point of view. The objects inside the cluster should be as much similar as possible, and objects from various clusters should be at least similar as possible.
217
218
Ivan Holúbek et al. / Procedia - Social and Behavioral Sciences 110 (2014) 215 – 222
For each pair of objects we have to calculate the level of similarity or the level of distance and we create the matrix of distances or similarities D with n rows and n columns that is symmetric and it has got zeros or ones on the diagonal. The concept of distance and similarity can be defined in various methods. The selection of distance and the measure of similarity of objects depend on the type of measured data. There exist a lot of measures of similarities and distances. If the objects are characterized by the values of quantitative variables, we apply the distance of the objects. The most used measure of distances is Euclidean distance or its square. Euclidean distance is calculated according to the formula 1: d (i , j ) =
p
∑ k =1 ( xik − x jk )2 ,
(1)
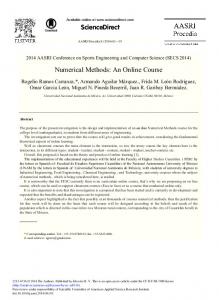
where xi1, xi2, ... , xip are the values of the variables X1, X2, ... , Xp identified at i-th object. There exist a lot of methods of clustering. The most often used ones are agglomerative hierarchical clustering methods. When using these methods we follow from the single-element clusters and in each step two most similar clusters are linked (their distance is called the clustering level) till a new cluster is generated that contains all objects. Agglomerative methods differ in defining the clusters distance. For example when using the farthest neighbour method (complete linkage) we define the distance of two clusters as the maximum distance of two objects (one is from the first cluster, the other from the second cluster). The result of these methods is the graph called dendrogram. Dendogram is horizontally cut at a certain level of clustering. 3. Statistical results The documents and data for statistical processing derive from Statistical Office of the Slovak Republic. We studied the regional data from 2010 because there are not newer data available at the level of NUTS 3. Apart from time series for the period from 2000 to 2010 we also analysed and compared the year 2010 with the year 2004 when the Slovak Republic became the member of the EU. The Fig. 1. shows the development of gross domestic product per an inhabitant expressed in the parity of purchasing power (GDPPPP) during 2000 to 2010 at the level of regions NUTS 3 of the Slovak Republic. Line Plot of multiple variables HDPPKS 2000-2010 45000 40000 35000 30000 25000 20000 15000 10000 5000 0
0
1
2
3
4
5
6
7
8
9
10
11
12
BA TT TN NR ZA BB PR KE SR
Fig. 1. The times series from 2000 to 2010 from the point of view of GDP expressed in the parity of purchasing power per an inhabitant (Source: Statistical Office of the Slovak republic)
The graph at the first glance shows that Bratislava region is clearly better than other regions in this area. Trnava region is above the national average for a long time. Other regions do not even reach the average values. The
Ivan Holúbek et al. / Procedia - Social and Behavioral Sciences 110 (2014) 215 – 222
Figure 2 shows the development of unemployment rate (DUR) between 2000 and 2010 at the level of the regions NUTS of the Slovak Republic. Li ne Pl ot of multipl e variables MNEZ 2000-2010 28 26 24 22 20 18 16 14 12 10 8 6 4 2
0
1
2
3
4
5
6
7
8
9
10
11
12
BA TT TN NR ZA BB PR KE SR
Fig. 2. Time series from 2000 to 2010 from the point of view of the unemployment (Source: Statistical Office of the Slovak republic)
The graph shows that the unemployment rate registered less stable development and the order of regions. The regional differences have variously changed in time, too. The lowest unemployment rate is in Bratislava region. However, this difference is not as high in comparison to other regions as it was with other indicators. Fig. 3 shows the development of average salary (DAS) between 2000 and 2010 at the level of the regions NUTS of the Slovak Republic. Li ne Plot of multi pl e variabl es PMZDA 2000-2010 1100 1000 900 800 700 600 500 400 300 200
0
1
2
3
4
5
6
7
8
9
10
11
12
BA TT TN NR ZA BB PR KE SR
Fig. 3. Time series from 2000 to 2010 from the point of view of average salary (Source: Statistical Office of the Slovak republic)
The Bratislava region is clearly at the highest position the area of average salary. It is the only one above the national average. The results of the clustering analysis are expressed in the dendrogram. First, the analysis for 2004. The similarities of Slovak regions in 2004 according to gross domestic product per an inhabitant expressed in the
219
220
Ivan Holúbek et al. / Procedia - Social and Behavioral Sciences 110 (2014) 215 – 222
parity of purchasing power, the unemployment rate, the average salary are graphically illustrated by dendrogram (Fig. 4) using the cluster analysis. We have used the standardized data, Euclidean distances and Complete Linkage as method of clustering. Based on the clustering analysis we found out that the most similar are the regions of ZA (Žilina) and NR (Nitra), then TN (Trenčín) and TT (Trnava), and then PR (Prešov) and BB (Banská Bystrica). BA region (Bratislava) is markedly different from all the others. Tree Di agram for 8 Cases Complete Li nkage Eucl idean distances 5
Linkage Distance
4
3
2
1
0 PR
BB
KE
ZA
NR
TN
TT
BA
Fig. 4. The clustering analysis of the regions of the Slovak Republic for 2004
When we classify the regions of the Slovak Republic by gross domestic product per an inhabitant expressed in the parity of purchasing power (GDPPPP), by the unemployment rate (DUR) and by the average salary (DAS) for 2004 (Table 1.), we see that the unemployment rate separates the first cluster from the second and the third cluster. However, not all the regions included in the first cluster have a higher unemployment rate than the national unemployment rate of the Slovak Republic. ZA regions has a lower value than the national average. The regions from the second and the third cluster are found markedly under the national average. Table 1. Slovak Regions in 2004 (Source: Statistical Office of the Slovak republic) Region
GDPPPP
region
DUR
region
DAS
PR
7391
BA
8.2
PR
416.1
ZA
9997
TN
8.6
NR
439.9
BB
10170
TT
12.5
BB
441.8
KE
10880
ZA
17.5
TN
461.6
NR
10915
SR
18.1
ZA
462.4
TN
11436
NR
20.3
TT
487
SR
12349
PR
22.9
KE
512.5
TT
13028
KE
25.2
SR
525.3
BA
27901
BB
26.6
BA
697.6
The average salary is the indicator that separates BA region from the other regions of Slovakia. BA has the average salary of 697.60EURO. The other regions have the average salary lower than 525.30EURO, what is the
Ivan Holúbek et al. / Procedia - Social and Behavioral Sciences 110 (2014) 215 – 222
national average. GDPPPP separates two regions from the others. Only two regions, Bratislava and Trnava regions, are above the average value of 12 349, while Bratislava region is considerably above the average with the value of 27 901. Although Trenčín region is in one cluster with Trnava region, from the point of view of GDPPPP it is under the national average. We show the dendrogram with the data from 2010 for the sake of the comparison of clustering analysis (Fig. 5.). The regions PR and BB are the most similar according to variables used in the analysis; ZA and NR are very similar too. The region BA is very different from others regions and creates a single cluster – simplicifolious. Others regions create two groups; first with five regions PR, BB, KE, ZA, NR, second with two regions TN TT. Tree Di agram for 8 Cases Compl ete Li nkage Eucl idean distances 6
5
Linkage Distance
4
3
2
1
0 PR
BB
KE
ZA
NR
TN
TT
BA
Fig. 5. The clustering analysis of the regions of the Slovak Republic for 2010
When we classify the regions of Slovakia by GDPPPP, by DUR and by DUS for 2010, we see that the unemployment rate separates the first cluster from the second and the third cluster. In comparison to 2004 we found out that in 2010 all regions included in the first cluster have a higher unemployment rate than the unemployment rate of Slovakia and the regions from the second and the third cluster are under the national average. The average salary is the indicator separating BA from the other Slovak regions, as it is in case of the year 2004. BA has the average salary of 991 EURO. The other regions have the average salary lower than 769 EURO, which is the national average. GDPPPP separates the same two regions from the others as it is in the case of 2004. Only two regions, Bratislava and Trnava regions, are above the average value of 17865, while Bratislava region is highly above the average with the value of 43 063. Although Trenčín region is in one cluster with Trnava region, from the point of view of GDPPPP it is under the national average. 4. Conclusion The equalisation between the regional differences in the EU conditions is a long-term target. The market-oriented economy that is currently being realized in the EU conditions is divided into two main streams. A basic condition of neoclassic economy is markets that regulate themselves and they are automatically heading straight towards the balance state. Economists of this stream are the opponents of state impacts and prefer the principles of economic liberalism. Keynesianism was created as the reaction to the Great Depression at the breakthrough of 1920’s and 1930´s. The market does not have to under certain circumstances get closer to the most effective point, but it can stabilize in the situation, when the product is low and the unemployment is high. Keynesians are the supporters of national anti-cyclic interventions into the economy.
221
222
Ivan Holúbek et al. / Procedia - Social and Behavioral Sciences 110 (2014) 215 – 222
The regional and cohesion policy of the EU developed after 1989. The realisation of the cohesion policy was generated based on the worries of European politicians that the closer economic integration and the generation of internal market will result in faster development of nuclear regions at the expense of peripheral ones. The key orientation of the cohesion policy of the EU is the effort for the balanced and permanent sustainable development of the EU regions. The main aim of this policy is the mitigation of the differences among the regions. It is questionable whether this type of stimulatory politics actually contributes to the long-term development and to the reduction of regional differences of the EU regions. The analyses show the inefficiency of spending the means through the structural funds of the EU. The money of taxpayers are distributed through the redistribution strategies, e.g. the cohesion policy. Despite such a conceived form of help, high total unemployment rate dominates in Slovakia and Slovakia is included among the European countries with the highest unemployment rates. Significant regional differences are identified at the level of NUTS 3. The method of the clustering analysis classified the Slovak regions into the clusters with significant regional differences and with the existence of one strong peripheral region at the expense of the others. The EU politicians and administration will support the cohesion and regional policy even in the future programming period. Related to the preparation for a new programming period 2014–2020 the discussion has started that deals with the future of the cohesion policy within the European Commission. The initiatives are not directed towards the exclusion of the cohesion policy but to the realisation of the changes so that the cohesion policy be not only a tool for the redistribution of financial means of the EU. The supporters of liberal economy policy prefer an active role of EU inhabitant within the minimizing the regional differences. It implies the decrease of tax burden, the reduction of the regulatory burden pressure and lower rate of redistribution. The consequences of redistribution are conservation and irreconcilability of economic structure, high indebtedness, the inflation issues, the expansion of public sector at the expense of private one and gradual loss of competitiveness of subjects in globalized economy. (Institute of Economic and Social Studies, 2012). For the last 5 years the economy crisis was one of the reasons. It reached the most important, especially economically less performing regions. Acknowledgements This research was financially supported by the Fund to support research and development centre in Faculty of Natural Sciences, Constantine the Philosopher University in Nitra. References Holman, R. (2011). Ekonomie. 5th edition. Prague C. H. Beck, ISBN 978080-7400-006-5. Rencher, A. C. (2002). Methods of Multivariate Analysis (2nd ed.). New York John Wiley & Sons, ISBN 0-471-41889-7. http://dx.doi.org/10.1002/0471271357 Nováček, P. (2010). Udržitelný rozvoj. ISBN 978-80-244-2514-6. Sojka, M. (1999). John Maynard Keynes a současná ekonomie. Grada Publishing, 156 p., Prague, ISBN 80-7169-827-X. Holman, R. (2010). Makroekonomie. 2nd edition. C. H. Beck Prague, ISBN 978-80-7179-861-3. Kluwer, W. (2012). Reálie k makroekonomii. Wolters Kluwer Czech republic, a.s., 472 p., ISBN 978-80-7357-848-0. Sloboda, D. (2013) Eurofondy a regionálne rozdiely v Európskej únii, M. R. Stefanik Conservative Institute, Available from internet: http://www.konzervativizmus.sk/upload/pdf/Eurofondy_a_regionalne_rozdiely_2012.pdf Sloboda, D. (2006). Slovensko a regionálne rozdiely, M. R. Stefanik Conservative Institute, Available from internet: http://www.konzervativizmus.sk/upload/pdf/Slovensko_a_regionalne_rozdiely.pdf Tvrdon, M. (2012). Macroeconomic comparison of the Czech NUTS 3 regions, Contemporary issues in business, management and education 2012. p. 471–480, ISSN 2029-7963/ISBN 978-609-457-323-1, Available from internet: http://cbme.vgtu.lt/index.php/cbme/cbme_2012/paper/viewFile/81/63 Štatistický úrad SR, Statistical Office of the Slovak Republic, Indicators of Economic Development of the Regions, http://portal.statistics.sk/showdoc.do?docid=6617 Eurostat, http://epp.eurostat.ec.europa.eu/portal/page/portal/eurostat/home Institute of Economic and Social Studies, http://iness.sk/stranka/6540-Vychod-na-Bratislavu-nema-Rozdiely-sa-nestieraju-Hospodarskenoviny.html Institute of Economic and Social Studies, http://www.iness.sk/stranka/2473-Vyrovnavanie-regionalnych-rozdielov.html Kohézna politika 1988–2008. Investovanie do budúcnosti Európy, časopis Panorama, ISSN 1725-826X, http://ec.europa.eu/regional_policy/sources/docgener/panorama/pdf/mag26/mag26_sk.pdf Eurofondy a regionálne rozdiely v Európskej únii, M. R. Stefanik Conservative Institute, http://www.konzervativizmus.sk/upload/pdf/Eurofondy_a_regionalne_rozdiely_2012.pdf