the sled takes long time to reach the center, since it is not ... policy, the sled acts as if it is seeking from its current position to the center with the exception ... the shutdown times along X and Y can be found in a separate technical report .... [3] M. A. Lantz, H. E. Rothuizen, U. Drechsler, W. Häberle, and M. Despont. A Vibration ...
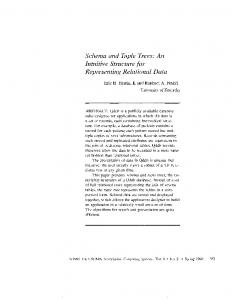
Exploiting the Spring Structure of MEMS-Based Storage Devices to Reduce Their Shutdown Energy Mohammed G. Khatib and Pieter H. Hartel Dept. of CS, Univ. of Twente Enschede, the Netherlands {m.g.khatib, p.hartel}@utwente.nl I. I NTRODUCTION New storage devices based on Micro-Electro-Mechanical Systems (MEMS) have been proposed [3]. Enabled by high storage densities (> 1 Tb/in2 ), MEMS technology promises to deliver small-form factor, high-capacity, and low-power storage devices. These devices have potentially low cost, because they can be manufactured using batch MEMS fabrication technology. A MEMS-based storage device dissipates an order of magnitude less power than a disk drive. However, like disk drives, MEMS devices have a moving medium. For optimal energy saving, a MEMS device should be shut down (i.e., the sled is stopped) during periods of inactivity. Because of their micro-mechanical nature, MEMS devices lend themselves to more aggressive shut down policies than disk drives. As the timeout decreases, the number of shutdowns increases, because more periods of inactivity are exploited. As a result, the energy consumed to shut down increases and so the total energy, which limits the applicability of aggressive shutdown decisions. Interestingly, as Figure 1 shows, in MEMS devices the moving medium is suspended by springs. We show that the potential energy stored in the springs can be exploited at shutdown to accelerate the sled toward the center as shown in Figure 2. External energy is invested only to decelerate the sled so that it stops at the center. Consequently, the shutdown energy is reduced to the deceleration energy, allowing to increase the aggressiveness of the shutdown decisions. This energy benefit, however, comes at a performance cost; that is the sled takes long time to reach the center, since it is not actively accelerated. In this work, we compare the energy-efficient (EE) policy against a performance-efficient (PE) policy. The PE policy uses the actuators to accelerate for some distance as shown in Figure 2 and then decelerate the sled so that it reaches the center in the shortest time possible. When deploying the PE policy, the sled acts as if it is seeking from its current position to the center with the exception that it stops along Y as well as along X at the center. Therefore, energy is consumed during both acceleration and deceleration. We propose an analytical model of the EE policy, comparing it to the PE policy. We use state-of-the-art parameter settings of the IBM MEMS device. II. S HUTDOWN T IME AND E NERGY The shutdown time along each direction consists of an acceleration and deceleration part. The complete derivation of
Springs & actuators
Medium sled
Medium Probe array
Electronics
Fig. 1. A 3D view of a MEMS-based storage device. Two layers facing each other where the medium sled is attached to springs that suspend it over the probe array. energy-efficient policy Factuator
m
Fspring
Fspring
acceleration
deceleration
x0
xs
center x1
motion direction performance-efficient policy Factuator
m
Factuator
Fspring
Fspring
acceleration
deceleration
x0
xs
center x1
motion direction
Fig. 2. The energy-efficient shutdown policy versus the performance-efficient one. The latter uses the actuators for acceleration.
the shutdown times along X and Y can be found in a separate technical report [2] due to space limitation. The shutdown time is the maximum of the shutdown times along X and Y, because of their independency, whereas the energy is their sum: tshutdown = max(tx , ty ), Eshutdown = Pmax × (txd + tyd ) .
(1) (2)
III. A NALYTICAL R ESULTS We devise an analytical model for the EE policy and use the seek model devised by Hong et al. [1] for the PE policy, taking into account that the sled stops at the center along Y
100 Shutdown energy difference [%]
Shutdown time difference [%]
600 500 400 300 200 100 0 50
80 60 40 20 0 50
50 0
Y distance [µm]
0 −50
−50
X distance [µm]
50 0
Y distance [µm]
0 −50
−50
X distance [µm]
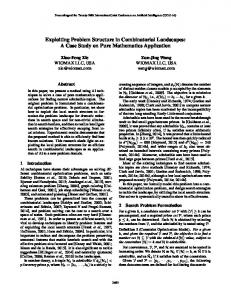
Fig. 3. Relative difference in shutdown time (left) and energy (right) between the performance-efficient (PE) policy and the energy-efficient (EE) policy calculated as tEEt−tPE and EPEE−EEE , respectively. PE
PE
too. The parameters of both models are set to the state-of-theart figures of the IBM MEMS device [3]. Figure 3 shows the relative difference in the shutdown time and energy for every position within a probe storage area. The rest position is the center at coordinate (0,0). Figure 3 (left) shows that the relative difference (calculated PE as tEEt−t ) is at minimum at the borders of the probe area. PE It, however, increases as the starting position gets closer to the center. When deploying the EE policy, the sled accelerates to the center by the spring force only, which depends on the distance (F = −kd). As a result, the shutdown times for all positions in the probe area lie in the same order; for example, the shutdown time at a 5 µm and 45 µm distance is 1.6 ms and 2.0 ms, respectively. In contrast, when deploying the PE policy the shutdown time scales very sensitively with the traveled distance, because it is actively accelerated; for example, the shutdown time at a 5 µm and 45 µm distance is 0.6 ms and 1.6 ms, respectively. This explains why the difference between both policies increases as the starting position gets closer to the center. The difference nearby the center reaches orders of magnitude, explaining the prohibitive relative difference. Figure 3 (right) plots the relative difference in energy EE consumption (calculated as EPEE−E ). The shutdown energy PE when deploying the PE policy is larger than when deploying the EE policy, because the former consumes energy for acceleration and deceleration, whereas the latter consumes energy for deceleration only. The relative difference is larger around the center and decreases as the starting position gets further from the center. From Equation (2), the energy difference boils down to a difference between the deceleration time of the EE policy and the sum of the acceleration and deceleration times of the PE policy. The closer the starting position to the center, the shorter the deceleration time (and thus energy) when deploying the EE policy, which is smaller than the total (acceleration plus deceleration) time when deploying the PE policy. No prohibitive difference exists, as with the shutdown time, because active actuation is used for deceleration when deploying the EE policy, yielding sensitive shutdown time (and thus energy) to the distance traveled.
IV. D ISCUSSION Our analytical study shows a larger potential energy saving when deploying the EE policy compared to the PE policy. Large amounts of energy can be saved if the data are located around the boarders relative to the center. Yet, if the data around the center are frequently accessed, then large savings are possible too. The saving is at least 40%. The EE policy shows worse timing performance than the PE policy. This is especially true around the center, where the difference can be up to 600%, because of the (extremely) slow behavior of the EE policy in reaching the center. That said, the slow shutdown performance can be of an advantage to real-world applications for two reasons. First, from a cost viewpoint, shutdown is an overhead and not an inherent task of accessing data. That means it should be done as cheap as possible and not as quickly as possible. Second, the slow motion benefits those applications that exhibit (high) sequentiality and/or locality of data. In other words, moving the sled slowly allows for quick inexpensive seek to an already visited region if new requests demand further data from there. A. Future Work The next step, after this analytical study, is to implement both policies in the MEMS model of DiskSim. Driven by real-world traces, we plan to study the dynamic behavior of both policies and compare their performance and energy consumption. After that, we will study the the interaction between power management and shutdown policy to analyze their joint influence on the total energy consumption of MEMS-based storage devices. R EFERENCES [1] B. Hong and S. A. Brandt. An analytical solution to a MEMS seek time model. Technical Report UCSC-CRL-02-31, Storage Systems Research Center, University of California, Santa Cruz, Sept. 2002. [2] M. G. Khatib and P. H. Hartel. An Energy-Efficient Shutdown Policy for MEMS-Based Storage Devices – An Analytical Model. Technical Report TR-CTIT-, Jan. 2008. [3] M. A. Lantz, H. E. Rothuizen, U. Drechsler, W. H¨aberle, and M. Despont. A Vibration Resistant Nonopositioner for Mobile Parallel-Probe Storage Applications. Journal of Microelectromechanical Systems, 16(1):130– 139, February 2007.