Abstract. The National Board of Medical Examiners (NBME) has developed the .... In the following discussion, an approach to modeling complex data will be carried .... On the right is an example of a balanced tree, with key values 1â15 shown.
Exploring Alternative Models of Complex Patient Management with Artificial Neural Networks Adrian M. Casillas, M.D. UCLA School of Medicine Los Angeles, CA 90095-1680
Abstract
The National Board of Medical Examiners (NBME) has developed the Computer-based Clinical Scenarios (CCS) as a high stakes assessment of realistic clinical cases for the purpose of establishing physician licensure. These case management simulations are necessarily complex in order to depict the real nature of patient case management by incorporating time, risk, quality of benefits, etc., to the simulation. The rich nature of the data set also requires that large databases be generated due to the complexity of the cases, the types of actions being recorded and the number of examinees being tested. This analysis describes methods for compressing, storing and retrieving data from a CCS data set using high performance computing methods of preprocess data for subsequent analysis. Distinct approaches to building a model of the performance data were carried out with artificial neural networks (ANNs) to derive comprehensive and predictive models of performance from the CCS student data set. More than one model of the performance behavior could be explained with different views of the data, which were compared with each other.
Casillas, A. M. AERA 2002
Introduction The National Board of Medical Examiners’ Computer-based Case Simulations The NBME CCS was developed to assess the performance-based aspects of competence in order to grant licensure to physicians (Clauser et al., 1998; Clauser et al., 1997; Clauser et al., 1996b; Clauser et al., 1996a; Clauser et al., 1994; Clauser et al., 1993). These cases represent diagnostic and case management procedures that represent a realistic patient encounter with the goal of eliciting beneficial patient management while minimizing risks and harm. In these exercises, the examinee is presented with a patient scenario and is required to order diagnostic tests, medications and procedures. Each of these actions results in some change related to the patient’s well being, and may serve as the stimulus to take the next action depending on the information obtained from the test or procedure. These actions are recorded in a transaction database that also includes information about the actual timing of the requested events in addition to a number of other system-generated transactions. The diagnostic and management domains are interrelated but not uniform across cases. The data set further depicts the real nature of patient case management by incorporating time, risk, quality of benefits, etc. to the simulation. The rich nature of the data set also requires that fairly large databases be generated due to the complexity of the cases, the types of actions being recorded and the number of examinees being tested. Ratings of the performances are obtained by applying appropriate measurement models commonly based on linear regression as a method of emulating sampled clinician ratings (Clauser et al., 1997). The goal of these examinations is to grant licensure based on a predetermined threshold for determining competence. 2
Casillas, A. M. AERA 2002
Non-parametric methods for modeling performance Scoring, as a form of data compression, is a method to match actions with criteria that are compared to performance standards. The final score may be misleading since it implies that competence can be based on a single criterion when, in fact, the score is derived from multiple variables to ensure an accurate scoring model (Mislevy et al., 1999; Mislevy et al., 1995) It has been shown that many aspects of learning, knowledge, and behavior affect performance and not all of these can be addressed in any particular examination format. It is also not always clear what features of problem-solving strategies and the examinee model go unrecognized in this data compression process. With the NBME’s CCS project, a scoring algorithm using linear regression techniques to model clinician ratings has provided a practical means for scoring large-scale performance assessment. Inherent to this method, however, is a mechanistic approach to assessment that may overlook certain unique patterns of behavior that do not fit within an algorithm (Clauser et al., 1996a). An alternative approach is nonparametric relying on the data use where performance behaviors guide the problem-solving approach (Kennedy et al., 1998). One method of achieving this is with artificial neural networks (ANNs) that can build a data-driven model of clinically relevant performance (Casillas et al., 2000; Hurst et al., 1997). In many other areas of medicine, where data represent diverse and complex information, neural networks have been applied to build pattern-recognitionbased models of clinical magnetic resonance spectroscopy (El Deredy et al., 2000), digital mammography (Hogge et al., 1997), clinical decision making (Penny et al., 1997; Johnson et al., 2001), and even predictions of protein secondary structure based on amino acid sequence (Baldi et al., 1999). 3
Casillas, A. M. AERA 2002
In expanding the utility of ANNs in performance-based assessment, it is necessary to consider the properties of the model we wish to establish. First, the model must be accurate through its ability to establish the “best fit” of the model’s estimated value to the true value if it is known. In such a case, for example, supervised neural networks can be trained with performance data in which ratings of the performances have been performed on a case-by-case basis. From a purely practical point of view, this type of system can have impact as a data-modeling tool for classification of performances. Where experts are a fixed resource and the data sources are increasing, the ability to automate the assessment of performance is highly desirable. Furthermore, complexity of clinical casemanagement related data could lead to oversight of important details inherent to establishing a true assessment of the quality of a performance. The second feature is interpretability or the type of input-output or “cause-relationships” that can be extracted from the model and which can be explained to the intended users of the model. The lack of interpretability in some cases may not necessarily make a model unacceptable, however. For instance, if the purpose is to discover new knowledge about performance, and an empirical assessment of the parameters of the model shows an acceptable degree of accuracy over a wide range of inputs then the use of such a model would be reasonable (Andrews et al., 2000). In this regard, the use of unsupervised neural networks may provide an insightful model based more on clustering of performances than on predetermined classifications. This would be useful if the model was reproducible in its ability to cluster performances over a number of trials. A combination of approaches may ultimately result in the best model, or at least a better interpretation of the model than either one alone can provide. In order to minimize 4
Casillas, A. M. AERA 2002
the uncertainty of the model, there are at least three considerations (Penny et al., 1997; Bishop, 1995): •
Noise in the data
•
Bias in the model
•
Variance in the model Noise within the data is clearly unavoidable even if the best data model can be
elucidated. Factors that will help to attenuate these effects are to ensure that the data collection is rigorous and represents a diverse sample. Although noise can be modeled (Bishop, 1995), it is not the subject of highest consideration if the fidelity of the data can be verified. The bias of the model stems from the complexity of the model itself and the training algorithm used (Bishop, 1995; Dorffner et al., 2000). If the model is too simple (i.e. linear) there is a natural systemic deviation from the optimal output when the theoretical optimal output is non-linear. By using a complex model such as artificial neural networks the model’s bias can be minimized. Furthermore, the bias due to the training can be minimized by performing multiple runs or by ensuring that the data represents a true global representation. The variance of the model can arise due to insufficient data and the training algorithm. Again, multiple runs of the data can minimize this source of uncertainty in the model. Indeed, a logical approach would include a model based on a variety of models: simple to complex, minimal data inclusion to maximal data representation, interpretable to less interpretable. In the following discussion, an approach to modeling complex data will be carried out using NBME CCS data representing several thousand performances of varying complexity. The first aspect of the approach will focus on the practical issue of data 5
Casillas, A. M. AERA 2002
characterization and preprocessing using sophisticated yet easily accessible computing techniques. In the first approach to modeling of the performance data, neural networks are used as an extension of established parametric models based on less flexible output criteria. The next approach extends the model by applying more flexibility to the output through mapping of the input data using self organizing feature maps (SOFMs) to order CCS performances based on inherent characteristics of the performance (Principe et al., 2000; Kohonen, 1982). Finally, the interpretability of the approaches will be discussed. Methods and Data Source The CCS data set characteristics The CCS data set used consisted of 6585 performances from two cases: Case 166 (n=3247) and Case 286 (n=3338). According to the NBME assessment of the cases, 166 was a more complex case than 286 (personal communication). The number of steps used by examinees ranged from 1 to 68 for the data set of both cases. A
B
Case 166
STEPS
Case STEPS286
800
286
1000
800 600
600 400
200 Std. Dev = 8.65 Mean = 28.4 N = 3247.00
0 0.0
10.0 5.0
20.0
15.0
30.0
25.0
40.0
35.0
50.0
45.0
60.0
55.0
70.0
Frequency
Frequency
400
200
Std. Dev = 7.20 Mean = 16.1 N = 3336.00
0 0.0
65.0
10.0 5.0
STEPS
20.0
15.0
30.0
25.0
40.0
35.0
50.0
45.0
60.0
55.0
65.0
STEPS286
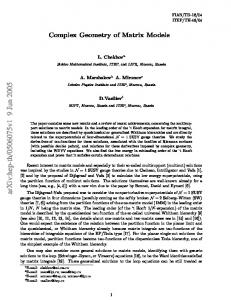
Distribution of the number of steps for two cases in the NBME CCS data set. Case 166 in panel A and Case 286 in panel B are shown with the mean number of steps of 28 and 16, respectively. Figure 1:
6
Casillas, A. M. AERA 2002
An analysis of the distribution of the number of steps in each case indicated a near normal distribution for Case 166 (Fig. 1a) with a kurtosis statistic of 0.424 (std error = 0.086). The same analysis for Case 286 (Fig. 1b) revealed more uniform clustering of the data with few outliers where the value of the kurtosis statistic was 2.136 (std. error = 0.085). Representing individual examinee performances: order and usage of test items In order to capture as much information and still maintain the richness of performances, a systematic approach to preprocess and compress the data was developed. The representation of the sequential nature of a performance that preserves the unique test item selection and timing of that selection in the same data set would necessarily result in a large 2-dimensional input space. Since the number of inputs would be large, the number of input vectors would also be very large due to an exponential growth of unique time-item possibilities. This would “fix” or bias the input space by introducing a high degree of prior knowledge in the input (Kennedy et al., 1998). In order to balance introducing too much potentially biased knowledge with sufficient information to build models that perform well given reasonable numbers of performance examples, an initial approach of separating the sequential aspect of the performance from the unique test item usage could be tested. In considering data compression techniques, the real nature of the task and the modalities for representing it should be considered. For example, in the workup of a patient who presents with congestive heart failure, a number of tests are indicated including a chest x-ray and an electrocardiogram (EKG). Usage of test items can represent these possibilities very well, but may lose some of the sequential information, 7
Casillas, A. M. AERA 2002
which may be important (i.e., ordering a chest x-ray before an EKG may result in late recognition of a myocardial infarction even though both tests are needed for the complete treatment of a patient). On the other hand, representing purely sequential data may result in segregation of performances in artificial ways such as the length of a performance since some performances are lengthy and others more concise. Therefore, a data preprocessor should be able to carry out both modalities of representing performance data, and the methods should be compared to each other to detect patterns in each that may emerge as an explanation for the observations made. The concept of analyzing the patterns found in sequential data has been exploited in a neural network approach that attempts to predict the complex phenomenon of protein structure solely based on the amino acid sequences and the occurrence of certain types of grouped amino acid residues (Baldi et al., 1999; Riis et al., 1996). Prediction of the secondary structure of the protein (β-sheets, a-helices, and coils) are important in understanding the complex 3-dimentional conformations that help to explain structural integrity, enzyme function, substrate binding, etc. Predicting outputs in this type of model requires different preprocessing approaches depending on the type of protein structure. As a basic example, an α-helix can be predicted by a single contiguous region of amino acid residues while a β-sheet results from recognition of various combinations of disjointed regions. While the individual models for α-helices or β-sheets can be explained by a sequential or disjointed input sources, the more predictable model for protein structure must rely on both. Through a direct extension of this approach, the data structures that represent the complexity of performance data must be thought of in a similar fashion. By analogy, a rote process (e.g. an algorithm for cardiac resuscitation) 8
Casillas, A. M. AERA 2002
may rely only on a given sequence of data item selections in a specified order while less rule-based behavior (e.g. complications during cardiac surgery) may contain sequences that are more sparse or disjointed. This concept has been raised in complex sequence learning by non-rule based strategies (Kelly et al., 2001). The first approach to data compression has to result in a workable representation of the performance by taking two-dimensional data and making it linear or oneA
B
Figure 2: Data compression representing type or sequence data. In A we see a performance compressed by type. Rows correspond to performances, columns to unique test items. Towards the right of the blow-up, within the dotted box, a group of test items that were used in most performances can be observed. In B, the problem has been represented as a compressed sequence. Again, the rows correspond to performances. The items are placed in the order in which they were used by the examinee, so the longer rows mean that the examinee performed a greater number of actions to solve the problem.
dimensional. In the following scheme, spatial information compressed into a more compact space, the sequence of steps taken can be encoded in a hexadecimal value represented by a color (Fig. 2). The resulting pattern is a series of pixels: each row represents a performance and each column represents a unique test.
9
Casillas, A. M. AERA 2002
Cataloging the entire set of student performance data for rapid retrieval
Prior use of linked lists and database queries proved unable to deal with large amounts of data in a reasonable amount of time. A data structure known as a “tree” provides an ideal solution for large quantities of data due to its speed and reliability in cataloging and retrieval (Sedgewick, 1998). These data-organizing structures are made up of a series of connected nodes (Fig. 3), which are composed of a pair of values: a key that
8
Parent node
Child node
1
2
Root Node
4
Child node
3
5
6
12
(Non-leaf) Node
10
7
9
14
11
13
15 Leaf Node
A 2-3-4 tree. The left panel shows the relational key-data structure. The middle panel describes the different node types employed: an n-node may be connected to n child nodes. On the right is an example of a balanced tree, with key values 1–15 shown.
Figure 3:
is used for reference and retrieval, and the data itself. In order to find a node, a search is initiated through the tree by making comparisons between the node’s keys, until either encountering the value you are searching for or reaching the end of the tree, in which case the value is not found. In order to address concerns of efficiency and to avoid unbalanced data distribution, which can have pronounced negative effects on data search and insertion times, a balanced or B-tree structure (Sedgewick, 1998) was developed for the NBME data set (Fig. 3). Specifically, a tree structure known as a 2-3-4 tree was programmed using Visual C++ (Microsoft® Corporation) for the data preprocessor. In a 2-3-4 tree, each node can contain up to three key-data pairs. 2-3-4 refers to the number of other 10
Casillas, A. M. AERA 2002
nodes that any other node can be connected to: 2 other nodes when it has one pair, 3 other nodes when it has two pairs, and 4 other nodes when it has 3 pairs. In order to maintain balance in the tree, steps are taken during the insertion of a new key-data pair. The insert follows essentially the same procedure as in a binary tree, with the additional process of “node splitting,” (Fig. 4), by which the tree maintains its The node splitting process.
Figure 4:
A
Panel A shows the tree after a node with key value 10 has just been inserted. Note that this has caused the root to be a 4-node. To maintain balance, the root must be split, as depicted in panel B.
B
balance and efficiency. A special case arises when the root (top level) of the tree becomes a 4-node after an insertion. This is dealt with by creating three new nodes, placing one value in each, and reconnecting the middle value, now the root of the tree. This step increases the height of the tree (by one), and is the only step that does so. This ultimately results in the ability to insert large amount of keyed data for rapid retrieval during the preprocessing stages. Furthermore, when new data, which is not part of previous data sets, is inserted the data structure will remain balanced. This is an important consideration when comparing multiple data sets that may have missing data.
11
Casillas, A. M. AERA 2002
Modeling the NBME rating and classification structure
As an extension of our initial approach to CCS data classification in which certain ratings were predicted by neural network clusters, a characterization of the parameters necessary to build the NBME scoring model on the current CCS data was undertaken. Two important considerations were required to define the modeling characteristics: 1) the consistency of clustering among performances in multiple neural network training runs and 2) the stringency of the group inclusion criteria with which the classification of the performances is made. The first consideration deals with input of data while the second is specific to the output or classification. The optimization of these features was expected to match the most stable groups of performances to a range of scoring criteria. The ability to use unsupervised neural networks as a distance metric to define the relative strength of association of the cluster members has been described (Caruana et al., 1999). The rationale for this approach is that the most similar performances in a data set are expected to cluster consistently, and less similar performances will not be consistent members of a single group. Furthermore, by using the consistent members of a cluster a reliable classification hierarchy can be established to model the performance data. To test this, unsupervised neural networks were trained with Case 166, which was chosen due to the higher level of variability in the performances. (A similar approach was taken for Case 286, but it was not necessary for the analysis as explained in the results below) Four unsupervised neural networks were trained using similar conditions: 500 epochs or iterations of the performances using a Kohonen self-organizing map to cluster sequencespecific input data. Performances that co-clustered (i.e. same group of performances were retained in a single cluster) across all four networks were designated as Class 1 while 12
Casillas, A. M. AERA 2002
performances that co-clustered across some networks or that never co-clustered were designated Class 2 and 3, respectively. Depending on the minimum size of the performance group clusters, a range of Class 1 performances were generated as shown in Table I. Table I: Performance group clusters by class No minimum size (group n>1) Minumum = 3% (group n>90) # of clusters (no. exemplars) # of clusters (no. exemplars) Class 1 80 (3230) 6 (2477) Class 2 5 (15) 7 (768) Class 3 n/a (2) n/a (2)
Minimum = 5% (n>151) # of clusters (no. exemplars) 4 (2221) 7 (1024) n/a (2)
Minimum = 10% (n>302) # of clusters (no. exemplars) 2 (1838) 7 (1407) n/a (2)
These clusters served as the basic training data set for a classification model based on the NBME’s scoring system. The input cluster size was selected based on a range of inclusion criteria from no constraint to very “tight” constraining rules. This enabled testing the possibility that the best model to fit data to a pre-defined scoring rubric would be based on the most stable members within groups of performances. The second consideration, defining the output classification, was also processed in a similar way, although the criteria for scoring were already represented by a scoring rubric that did not require further compression or major preprocessing. In this case, the number of output classification to be used as the “desired” output was based on a range of classification sizes determined by K-means clustering of the scores. Distinct classifications were found using between 10 and 40 classifications for the scoring. For the purposes of classification in a high-stakes outcome (pass or fail) it was postulated that the most consistent performance clustering or the “tightest” groups could best be used to train a neural network based on a desired classification that was liberal (fewer classifications) or stringent (more classifications). 13
Casillas, A. M. AERA 2002
Sequential ordering of steps to predict classification
Several experiments were conducted in which a range of input size clusters (Table I) were used as the training data to classify the performances based on a less strictly defined set of output classification (10 classifications) and a smaller number of more rigid scoring criteria (40 classifications) using supervised neural networks (Fig. 5). Based on the sequence of test items ordered to represent the performances, the data set was used to train supervised networks to “learn” by associating the input to the desired output, which was the NBME scoring classifications (Principe et al., 2000). A percentage of the entire data set for each case was used for training four supervised networks for each series of tests. For Case 286 (Fig. 5a) only one series of networks was used in which the performances used for training were derived from unsupervised network clustering based on all groups of performances (i.e. any group > 1 member was considered suitable) The output classifications used as the desired output were based on a k means clustering of the NBME scores for the specific cases clustered as 40 individual groups (40 output classification). The percent of correct predictions is shown for each network trained with a subset of the available performance exemplars. This showed that 50% of the exemplars (approximately 1500 performances) was sufficient to predict classification of performances not used in the training set (Fig. 5a). A similar initial approach was taken for Case 166 (Fig. 5b), which showed poor predictability (open circles in Fig. 5b). The input was varied subsequently so that progressively larger clusters (from 3% to 10% of the data set) were considered suitable for use in training. The output clusters (40) remained the same throughout. Poor performance was observed. When these same input groups were tested using a more 14
Casillas, A. M. AERA 2002
A
Case 286 40 Output classification preproc essed by sequence
Predictions (testing/training * 100%)
100 90 80 70 60 50 40 30 20 10 0
10
50
75
90
% exemplars used in training Case 166 40 Output Class ification preproces sed by sequ ence
B 110
Predictions (testin g/traini ng * 100% )
100 90 80 70 60 50 40 30 20 10 0 0
20
40
60
80
100
% exem plars used in training
5% (>151 ex emplars ) 0% (>1 exemplars)
10% (>302 ex emplars ) 3% (>91 exemplars )
Predictions (testing/training * 100%)
C
Case 1 66 10 Output Clas sif ication preproces sed by s equenc e
110 100 90 80 70 60 50 40 30 20 10 0 0
20
40
60
80
% e xemplars use d in training
10% (> 302 exemplars ) 3% (>9 1 exemplars)
5% (>151 exe mplars) 0% (>1 e xempl ars)
15
100
Figure 5: Cases 286 (A) and 166 (B and C) preprocessed by sequence of actions. A percentage of the entire data set for each case was used for training four supervised networks for each series of tests. For Case 286 only one series of networks was used in which the performances used for training were derived from unsupervised network clustering based on all groups of performances (i.e. any group > 1 member was considered suitable) The output classifications used as the desired output were based on a k means clustering of the NBME scores for the specific cases clustered as 40 individual groups (40 output classification). The percent of correct predictions is shown for each network trained with a subset of the available performance exemplars. This showed that 50% of the exemplars (approximately 1500 performances) was sufficient to predict classification of performances not used in the training set. A similar initial approach was taken for case 166 (B) which showed poor predictability (open circles in B). The input was varied subsequently so that progressively larger clusters (from 3% to 10% of the data set) were considered suitable for use in training. The output clusters (40) remained the same throughout. Poor performance was observed. When these same input groups were tested using a more general grouping scheme so that the NBME scores were limited to only 10 output clusters (C), better performance could be demonstrated using the same input criteria.
Casillas, A. M. AERA 2002
general grouping scheme so that the NBME scores were limited to only 10 output clusters (Fig. 5c), better performance could be demonstrated using the same input criteria. The data represented the ability of neural networks to predict a performance classification based on an NBME scoring rubric. Where the more limited or stringent grouping and clustering was used (Fig. 5b), there was poor performance in terms of a predictive model since small clusters (groups of 2 or more performances) trained with a large number of classifications lead to less than 10 % accuracy. In expanding the cluster size by excluding small groups of performances did lead to better performance, but the best prediction was less than 78%. A significant improvement was observed when the output classifications were made larger to include a more liberal representation of the scoring rubric (Fig. 5c). The classification criteria, based on the number of output clusters, were relaxed by creating fewer output classifications. This would have the effect of sorting the performances with broader class inclusion criteria, and this is more likely to fit with the intended model of outcomes limited to pass or fail. The data demonstrated that this modification resulted in good performance where the model predicted classification with 100 percent accuracy (Fig 5c).
16
Casillas, A. M. AERA 2002
Non-sequential item ordering for classification predicts a more complex performance model
The direct sequence of steps may not depict complexity reflected in the performance if the ordering of the input in a linear fashion (as with straight sequence) results in too much deviation form the optimal output, especially if the optimal model is truly
nonlinear
Case 286
A
preprocessed by type
(Dorffner et al., 2000).
Percentage Output Matching Desired
100 90
y = -0.01x + 96.344 R2 = 0.8556
80 70
In order to address the possibility
60
that
50
noncontiguous
40 30
y = 0.0017x + 35.189 R2 = 0.0082
20
sequences within the
10 0 0
500
1000
1500
2000
2500
3000
performance
were
Number of Exemplars used in Training
Training
Testing
better able to predict
Case 166
B
preprocessed by type
100 90 80 70 60 50 40 30 20 10 0
the
performance
model, the data input
y = -0.0014x + 99.267 R2 = 0.9752
was reprocessed using type as shown in Fig.
y = 0.0178x + 20.074 R2 = 0.9409
2A 0
500
1000
1500
2000
2500
3000
Number of Exemplars Used in Training
Training
Testing
Figure 6: Case 286 and 166 preprocessed by type with increasing numbers of exemplars used for supervised training. The desired output classifications used were the NBME scores represented as a binary value for classification. The training and testing values represent the percentage of exemplars matching the output (correct classifications) for each supervised network.
above.
The
method selected was chosen
to
classify
performances characterized by the unique tests ordered
17
Casillas, A. M. AERA 2002
as the training set of performances, and the desired output was the NBME scoring criteria represented as a binary value. The scoring criteria directly reflected the scoring rubric used by the NBME and were not preprocessed further.
An increasing number of
performances was used for training in an attempt to determine the minimum training set required. The remainder of the exemplars was used for testing, and the neural networks ability to classify the testing set was examined. A range of training exemplars from 300 to 3000 performances (Fig. 6) was used for Case 286 (Fig 6a) and Case 166 (Fig. 6b). The ability of supervised networks to accurately classify performances according to the NBME rating criteria when a non-sequential representation of the data was used differed greatly between the cases. For Case 286 (Fig. 6a), the non-sequential representation was poor despite increasing the number of training performances, which was unexpected since large training sets had been noted to improve the predictions of other supervised networks. Even using approximately 2500 performances for training did not enhance predictability of the model better than 52% (Fig. 6a). Case 166 (Fig 6b) using a similar approach did reveal a better performance model. Initially, with a small training set there was less than 30% predictability, but this consistently improved as the training set became larger (Fig. 6b). The best accuracy that could be obtained by a supervised neural network was observed with a training set of 3000 performances, which could accurately classify 80 percent of the training set. According to this model, approximately 4000 training performances would be required to achieve the best training for classification in Case 166.
18
Casillas, A. M. AERA 2002
Conclusion and Discussion
A performance-based model of the CCS data set through alternative, nonparametric approaches that rely on the data usage or the sequence of those actions can describe different performance-based models. One of the key features of this approach requires data compression in the preprocessing phase. By preserving the sequential nature of the test item selection, a more efficient representation of performance data set can be preprocessed compared to an approach that uses the unique test item usage or type-specific preprocessing (Fig. 2). In sequence preprocessing, the length of the data
input string was dictated by the longest performance. This is a practical consideration when very large data sets are used, but should not be the sole criterion for choosing a form of preprocessing. While it is intuitive that the sequence of items used may be the best way to depict a performance, it may result in a model that is too simple thereby not allowing for depiction of the best model for the data. In particular, when the nature of the case poses a particular challenge to the examine, the sequence of steps alone may not reflect the student model well. In this study, Case 166 was more difficult requiring 57% more test item selections than Case 286 (Fig .1). Additionally, Case 286 clustered more uniformly about the mean than Case 166 (kurtosis of 2.136 and 0.424, respectively) suggesting that Case 286 was more straightforward for the examinees. The analysis of the individual cases was carried out in through preprocessing by sequence as a first approach. This proved to be a relatively simple process for Case 286 in which the predicted classification, based on the NBME scoring model, achieved greater than 90% accuracy with relatively few performances (Fig. 5a). On the other hand, Case 166 posed greater challenges since under similar training conditions very poor 19
Casillas, A. M. AERA 2002
performance was achieved (Fig. 5b). By limiting the output classification size to include ten classifications (one fourth of the previous classification size), the performance of the supervised networks improved dramatically (Fig. 5c) and suggested that relaxing the scoring classification criteria would be necessary if a linear representation of the data was used. This model may prove to be even simpler, and quite adequate, when considering a limited output classification scheme such as pass or fail, competent or incompetent, etc. The main issue at this stage was whether or not a more complex model of the performance existed to explain why the examinee performance model for Case 166 had to be simplified when a non-biased neural network model was applied. When a different representation of the data was used to preprocess the performance data by type, a different model was applied to the data set. This model was not initially well suited for Case 286, as the network generated was poor in its predictive capacity (Fig. 6a); however, this was not so with Case 166 where the model began to predict with good accuracy (Fig. 6b). The limiting factor was the necessity for a larger number of training performances since nearly 3000 training exemplars were required to produce 80% accuracy of classification prediction when tested (Fig 6b). The model that emerged was one that was better explained through a type-specific representation of the performance data that suggested the inherent complexity of the case as well as the examinee model of the case. These differences could be explained by considering two scenarios, one in which the requirements of the task are relatively simple and the examinee perceives it as an easy task and the other situation exists when the requirements of the task are more challenging to the examinee. Where the examinees’ model is complete for the requirements of the 20
Casillas, A. M. AERA 2002
task, there is agreement in the type of strategy to be undertaken, and will be well represented by a sequence-specific clustering of the performance data. When a model that is too complex is used to test a simple examinee model, its performance is poor such as when Case 286 was preprocessed by type (Fig 6a). Where the task becomes more difficult as in Case 166, the examinee model is more diffuse requiring different modeling approaches. This was accomplished by restricting the classification criteria so that performances could be assigned to more liberal groups which was basically a method of simplifying the performance model when sequence of action was used (Fig. 5c). Alternatively, a model that can deal with a more diffuse, less straightforward approach to the problem-solving task (a condition which is predicated by the examinees’ understanding of the task) was found with the type-specific model (Fig. 6b). This model predicted more complexity in the examinee model of the task and did not restrict the classification group criteria. In seeking alternative approaches to analyzing complex performance data, the context of the task for the intended examinees must be taken into account. More than one model of the performance behavior may exist and could be explained with different views of the data, which should ideally be reconciled with each other. Ultimately, an approach to complex performance analysis will require multiple variations of data preprocessing and output classification depending on the intended purpose of the examination and the behaviors being studied.
21
Casillas, A. M. AERA 2002
References
Andrews,R., Tickle,A.B., & Diederich,J. (2000). A review of techniques for extracting rules from trained artificial neural networks. In R. Dybowski & V. Gant (Eds.), Clinical Applications of Artificial Neural Networks. Cambridge: Cambridge University Press. Baldi,P., Brunak,S., Frasconi,P., Soda,G., & Pollastri,G. (1999). Exploiting the past and the future in protein secondary structure prediction. Bioinformatics., 15, 937-946. Bishop,C.M. (1995). Neural Networks for Pattern Recognition. Oxford: Clarendon press. Caruana,R., Kangarloo,H., Dionisio,J.D., Sinha,U., & Johnson,D. (1999). Case-based explanation of non-case-based learning methods. Proc.AMIA.Symp., 212-215. Casillas,A.M., Clyman,S., Fan,Y.V., & Stevens,R. (2000). Exploring Alternative Models of Complex Patient Management with Artificial Neural Networks. Advances in Health Sciences Education, 5(1), 23-41. Clauser,B.E., & Clyman,S.G. (1994). A contrasting-groups approach to standardsetting for performance assessments of clinical skills. Academic Medicine, 69(10), S42-S44 Clauser,B.E., Clyman,S.G., Margolis,M.J., & Ross,L.P. (1996a). Are fully compensatory models appropriate for setting standards on performance assessments of clinical skills. Academic Medicine, 71 (1), S90-S92 Clauser,B.E., Ross,L.P., Fan,V.Y., & Clyman,S.G. (1998). A comparison of two approaches for modeling expert judgment in scoring a performance assessment of physicians' patient- management skills. Academic Medicine, 73(10), S117-S119 Clauser,B.E., Ross,L.P., Nungester,R.J., & Clyman,S.G. (1997). An evaluation of the Rasch model for equating multiple forms of a performance assessment of physicians' patient-management skills. Academic Medicine, 72(10), S76-S78 Clauser,B.E., Subhiyah,R.G., Piemme,T.E., Greenberg,L., Clyman,S.G., Ripkey,D., & Nungester,R.J. (1993). Academic Medicine, 68(10), S64-S66 Clauser,B.E., Swanson,D.B., & Clyman,S.G. (1996b). The generalizability of scores from a performance assessment of physicians' patient management skills. Academic Medicine, 71(10), S109-S111
22
Casillas, A. M. AERA 2002
Dorffner,D., Sykacek,P., & Schittenkopf C. (2000). Modelling Uncertainty in Biomedical Applications of Neural Networks. In H. Malmgren, M. Borga, & L. Niklasson (Eds.), (pp. 18-36). London: Springer-Verlag. El Deredy,W., Branston,N.M., Samuel,M., Schrag,A., Rothwell,J.C., Thomas,D.G., & Quinn,N.P. (2000). Firing patterns of pallidal cells in parkinsonian patients correlate with their pre-pallidotomy clinical scores. Neuroreport 2000.Oct.20.;11(15.):3413.-8., 11, 3413-3418. Hogge,J.P., Artz,D.S., & Freedman,M.T. (1997). Update in digital mammography. Crit Rev.Diagn.Imaging, 38, 89-113. Hurst,K., Casillas,A.M., & Stevens,R.H. (1997). Exploring The Dynamics of Complex Problem Solving with Artificial Neural Network-Based Assessment Systems. Los Angeles: University of Californa, National Center for Research on Evaluation, (387) Johnson,M.R., Good,C.D., Penny,W.D., Barnes,P.R., & Scadding,J.W. (2001). Lesson of the week: Playing the odds in clinical decision making: lessons from berry aneurysms undetected by magnetic resonance angiography. BMJ 2001.Jun.2;322.(7298.):1347.-9., 322, 1347-1349. Kelly,S.W., & Burton,A.M. (2001). Learning complex sequences: no role for observation? Psychol.Res.2001.;65.(1):15.-23., 65, 15-23. Kennedy,R., Van Roy,B., Reed,C.D., & Lippman,R.P. (1998). Solving Data Mining Problems Through Pattern Recognition . Upper Saddle River, New Jersey: Prentice Hall. Kohonen,T. (1982). Self-organizing formation of topographically correct feature maps. Biological Cybernetics, 43, 59-69. Mislevy,R.J., & Gitomer,D.H. (1995). The role of probability-based inference in an intelligent tutoring system. User Modeling and User-Adapted Interaction, 5(3-4), 253-282. Mislevy,R.J., Steinberg,L.S., Breyer,F.J., Almond,R.G., & Johnson,L. (1999). A cognitive task analysis with implications for designing simulation-based performance assessment. Computers in Human Behavior, 15(3-4), 335-374. Penny,W.D., & Frost,D.P. (1997). Neural network modeling of the level of observation decision in an acute psychiatric ward. Comput.Biomed.Res., 30, 117. Principe,J.C., Euliano,N.R., & Lefebvre,W.C. (2000). Neural and Adaptive Systems Fundamentals Through Simulations . New York, NY: John Wiley and Sons, Inc. 23
Casillas, A. M. AERA 2002
Riis,S.K., & Krogh,A. (1996). Improving prediction of protein secondary structure using structured neural networks and multiple sequence alignments. J.Comput.Biol., 3, 163-183. Sedgewick,R. (1998). Algorithms in C++. (Third ed.). Addison-Wesley.
24