Exploring the Notion of Spatial Lenses Christopher Allen2 , Thomas Hervey1 , Sara Lafia1 , Daniel W. Phillips1 , Behzad Vahedi1 , and Werner Kuhn1 1
Department of Geography, University of California Santa Barbara (UCSB), Santa Barbara, CA, USA,
[email protected], http://geog.ucsb.edu 2 Department of Geography, San Diego State University (SDSU), San Diego, CA, USA
Abstract. We explore the idea of spatial lenses as pieces of software interpreting data sets in a particular spatial view of an environment. The lenses serve to prepare the data sets for subsequent analysis in that view. Examples include a network lens to view places in a literary text, or a field lens to interpret pharmacy sales in terms of seasonal allergy risks. The theory underlying these lenses is that of core concepts of spatial information, but here we exploit how these concepts enhance the usability of data rather than that of systems. Spatial lenses also supply transformations between multiple views of an environment, for example, between field and object views. They lift these transformations from the level of data format conversions to that of understanding an environment in multiple ways. In software engineering terms, spatial lenses are defined by constructors, generating instances of core concept representations from spatial data sets. Deployed as web services or libraries, spatial lenses would make larger varieties of data sets amenable to mapping and spatial analysis, compared to today’s situation, where file formats determine and limit what one can do. To illustrate and evaluate the idea of spatial lenses, we present a set of experimental lenses, implemented in a variety of languages, and test them with a variety of data sets, some of them non-spatial. Keywords: conceptual lenses, core concepts of spatial information, spatial analysis, data usability, format conversions
1
Introduction
There is an implicit assumption underlying most work with GIS, namely that a data set encodes a certain view of an environment and should therefore be analyzed with tools conforming to that view only. For example, a raster data set is normally seen as encoding a field view of space, consequently admitting map algebra operations, while a set of polygons would be seen as encoding an object view of space, and a literary text would in itself not be considered spatial data. While this assumption can guide the choice of analysis tools, it can also stand in the way of more flexible uses and richer interpretations of data. It limits the use
of mapping and spatial analysis tools to certain data formats that these tools can handle and it prevents the exploitation of spatial references in data that are not in a GIS format. Furthermore, the assumption can lead to unnecessary data format conversions and information loss. In this paper, we challenge this assumption by decoupling data from world views. We introduce the notion of spatial lenses for data, which we define as pieces of software that interpret data sets in terms of a chosen world view. For example, a field lens interprets a data set as a representation of an environment viewed as a field. The data set to be interpreted in this way can be an image, a set of point measurements, a live sensor network, or anything else that may be interpreted as representing a continuous function from positions in spacetime to values (in other words, a field [1]). Spatial lenses defined in this way would normally be built by application programmers or software developers, according to specifications produced by geographic information scientists, ideally in consultation with domain scientists (such as climatologists, archaeologists, or historians). The decoupling of data from views of environments also allows for (and often requires) introducing some auxiliary information. To interpret a set of point measurements as a field, for example, one obviously needs to supply an interpolation function. If a literary text is to be seen as representing a social network, the nodes (for example, literary characters) and links (for example, their kinship) need to be defined in computable form. Spatial lenses also reduce the need for explicit data format conversions by users. Spatial analyses often involve multiple switches between different views of space, based on the formats of data sources. With a dedicated choice of how to conceptualize an environment, there is no need to change that lens for computational reasons only, no matter what format the data sources are in. For example, an analysis of night-time lights in certain areas and at multiple levels of granularity does not require alternation between field and object views, though this is often done in practice [2]. Aggregation is handled as a granularity lens operation, which can be layered on top of other content lenses to answer questions about data quality. Similar to the idea of constructor and observer operators, which are wellknown from abstract data types in programming and software engineering [19], using the spatial lens idea allows for separation of analysis from pre-processing. Spatial lenses are constructors that generate instances of core concept representations to which observers can subsequently be applied in order to answer spatio-temporal questions. Our main goal is to allow for a more flexible view of what is considered “spatial data”. A large proportion of data has implicit or explicit spatial references and is therefore in principle amenable to mapping and spatial analysis. However, the gap between the data and the tools is often too large to bridge for those without solid technical GIS expertise. Spatial lenses lift mapping and spatial analysis from the implementation level of data formats and GIS commands to the level of questions about spatial phenomena [5]. Each of the lenses comes with a set
of questions they answer. For example, a network lens answers questions about connectivity, centrality, and paths, while an event lens answers questions about temporal sequencing and possible causation. The paper first surveys previous work in several information sciences, then presents five case studies, each of them proposing and implementing a set of lenses, and ends with conclusions.
2
Previous Work
We take the seminal work of Edgar F. Codd on databases in the early 1970s [3] as inspiration for the (admittedly harder) task of creating a higher-level understanding of spatial information. Codd’s relational algebra essentially defined a lens on the world in terms of tables. Once one understands the world as consisting of phenomena that one can represent in rows of tables with columns for their attributes, the power of relational algebra unfolds without a need to understand how the tables are stored and manipulated in a database. The first sentence in Codd’s CACM article says it all: “Future users of large data banks must be protected from having to know how the data is organized in the machine (the internal representation)” [3]. Replace “large data banks” with “GIS” (or any other type of spatial computing platform) and ask yourself what you can do without knowing how a system organizes the data internally. Here we do not mean the physical level of data organization, but the logical one, i.e. the data structures. Whole curricula are in fact built on the assumption that you cannot and should not do much without that knowledge. While this assumption creates a cast of GIS experts (generally recognized to be too small, and likely to stay so), it misses out on the vast potential that GIS has for users without the technical skills, time, or financial resources to acquire a thorough understanding of GIS internals before asking a spatial question. In this paper, we do not address the usability of GIS and other tools, but the usability of data, improving the means to interpret any data spatially. A case similar to that about databases could be made for the power (and limitations) of seeing everything stored in a computer as a document of some type (text, table, graphic etc.) or for the idea of Linked Data, built on the simplest possible data model of subject-predicate-object triples [4]. Both paradigms have lifted data manipulation from the level of dealing with data structures to that of dealing with real-world concepts (documents and statements). GIScience has not yet reached similar levels of simplicity and clarity in describing what it is (and GIS are) about. The core concepts of spatial information have been defined previously to bridge the gap between spatial thinking and spatial computing [18, 5]. The following six of them are now explored as concepts to interpret spatial data: 1. Object – An individual that has properties and relations with other objects. 2. Field – A property with a value for each position in space and time.
3. Network – A set of objects (nodes) linked by a binary relation (edges). 4. Event – Something that happens and involves fields, objects, and/or networks as participants. 5. Granularity – The level of detail in objects, fields, networks, and events. 6. Accuracy – The correspondence of spatial information with what is considered a true state of affairs. Note that the core concept of Location underlies the four ”content concepts” (object, field, network, event), in the sense that all of these serve to answer ’where’ questions. The ”quality concepts” of granularity and accuracy, in turn, can be applied to all content concepts. As location is always observed in space and time, all concepts are spatio-temporal (not just the event concept). In the case of spatial lenses as well as in the cases of databases, documents, and linked data, the idea of a conceptual lens should be understood as a means to view reality using some data and software, rather than viewing the data. For example, if one decides to view temperature measurements from a network of weather stations as a representation of a temperature field, this conceptual lens allows for having a temperature value at each position and time of interest (some of which are measured, others interpolated). The field lens is, thus, not applied to the point data set per se (as this would leave out the interpolation function to be supplied), but to the environment, seeing it through the data. Our notion of Spatial Lenses is not directly related to the Urban Lens3 from the Senseable City Lab at MIT, which allows users to extract trends from large datasets through the application of a figurative lens. Unlike this data visualization work, our spatial lens notion applies a computational approach that carries a set of associated questions to help users spatialize data in a particular way. In GIScience, attempts to provide clearer conceptual structure to geographic information have so far mainly focused on organizing GIS commands around the sorts of items manipulated by a GIS [6, 7], or on finding a single general model to deal with the largest possible range of geographic data [8, 1]. Our approach, by contrast, identifies sorts of items or phenomena in the world, together with questions to be asked about them [5]. It then fits the data and operations to these conceptualizations, rather than coercing the understanding of the world to data models.
3
Case Studies
To articulate the flexibility in choosing spatial lenses, we investigate non-trivial domain-specific questions through a set of case studies. These studies highlight lens views of environments based on existing data, spatial or other, taken from diverse sources and mostly available online. The data range from historical newspaper texts through typical GIS data in raster and vector form, to research objects (publications and research data of any kind). 3
http://senseable.mit.edu/urban-lens/
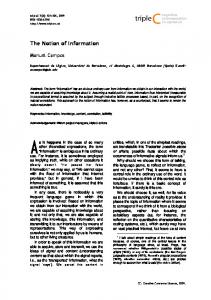
Fig. 1. Spatial lenses applied to a campus environment, illustrating symbolically how a campus can be seen as a set of objects, as observed through various fields, as forming networks, as participating in events, and how all these views come with a certain level of granularity (detail) and accuracy
3.1
Baltimore City Vacant Buildings
Data Source and Uses. Our first data set is an online repository of vacant building features across Baltimore City4 . Updated monthly, the data set keeps track of parcel properties that are not currently on the market, and are condemned or no longer occupied. Each feature contains attributes for several parent administrative jurisdictions including neighborhood and police districts as well as a pair of coordinates and a notice date generated upon initial inspection. Available on the web portal OpenBaltimore, the data can be displayed through online mapping tools, or downloaded in tabular form. We know of no spatial analyses that use this data so far. However, for economists and social scientists, the data could be useful when studying spatial urban dynamics or deciding on investments. Questions and Lens Support. Addressing such possible user perspectives, we can ask the following questions of the data: 4
https://data.baltimorecity.gov
– Where can one find vacancy clusters? – Which neighborhoods contain most clusters? To study clustering, we propose an object lens, viewing clustered vacancies as objects generated from vacant parcel points. A user could then, based on the neighborhood attribute, observe how many clusters are within each neighborhood. This information could be valuable for influencing policy. For example, if a user discovers a large number of vacancy clusters within the SandtownWinchester neighborhood, they could suggest to the respective council members where to focus and how to allocate rehabilitation funds. Note that this is an example that illustrates how objects are not defined by boundaries (there are none, in this case), but by their identity.
Fig. 2. West Baltimore vacancies plotted as cluster objects
Constructing the Lens. Since the vacant lots in this data set have a coordinate pair attribute, generating cluster objects is straightforward (for this data, DBSCAN is appropriate [9]), and a user would only need to supply the data in tabular form along with clustering specifications. Upon applying the object lens twice, to individual parcels as well as to the clusters, the following processing steps constitute the object lens constructor: – Determine and plot point locations based on provided coordinate pairs. – With user defined settings, run the clustering algorithm. – Count clusters within each neighborhood. In our Python implementation, the tabular data is loaded into a matrix, and DBSCAN is run. Several clustering characteristics, including minimum number
of samples (in this case five other vacant parcels) and maximum sampling distance (in this case eight houses away), are supplied by the user. The results in Figure 2 show point objects for each vacant building plotted by location and with clusters differentiated by color. An automated count reveals that the Central Park Heights and Sandtown-Winchester neighborhoods contain the highest number of clusters, with 30 and 22 lots respectively. Secondary Lens. Viewing vacancies through a field lens rather than as a set of objects can provide additional insights. By constructing a field, values could instead represent vacancy density. This ”heat map” view could be used to study the spatial distribution of decay rather than just answering the question, where do discrete vacancy clusters occur? An economist or city planner could then suggest to developers where best to launch demolition and development projects. A similar view of vacancies by density is currently being used by The Johns Hopkins Medical Center, which is looking for opportunities to expand further into east Baltimore5 . 3.2
Santa Barbara Communities of Interest
Data Source and Uses. The data set used here was gathered by one of the authors, Daniel W. Phillips, while conducting research about redistricting in Santa Barbara, California. The data were collected to determine how well residents thought the boundaries of the city council district in which they lived reflect what they believed to be their community of interest. They consist of 114 responses to a survey given to residents during the summer of 2015, collected in three of the six city council districts in the city. One of the items on the survey involved each participant taking a base street map of the city and drawing a line around the area that they believed to be their community of interest, defined as a contiguous group of people with shared values, concerns, and cultural traits. Questions and Lens Support. Analysis of the polygons drawn by residents involved the following questions: – Do residents of a given district roughly agree about the location and extent of their community of interest? – Can one identify an area of highest agreement, which might be considered the core of the community of interest within each district? Applying a field lens supports answering these questions. By overlaying the individual polygons for a given district, one can determine the degree of overlap as a field. While the street map survey instrument might have led respondents into more network-based thinking about their communities than field-based, it identified familiar locations better than an aerial image would have and thus enabled people to make more informed decisions; even still, most drew simple 5
https://hub.jhu.edu/gazette/2013/january/east-baltimore-changes-development
oval shapes that did not conform to the underlying street network. For any given point within this field there is a certain percentage of respondents who included that point in the polygon that they drew. The percentages range from zero to more than 60 percent.
Constructing the Lens. After digitizing all drawings, the resulting polygons were merged into a shapefile that served as the input for the constructor operations6 : – Compute a count of the overlapping polygons at each point in space. – Use that count to create an output raster (with 25 meter cells). Constructing classes for degree of overlap allowed for a simpler representation, with a light yellow to dark red color scheme applied to differentiate four classes of agreement.
Fig. 3. Agreement level of polygons drawn by District 1 residents, with classes from light to dark of 0-39, 40-49, 50-59, and 60+ percent agreement
Secondary Lens. One could apply an accuracy lens, comparing the results of applying different survey instruments. If the survey collectors used a more detailed base map or showed it digitally, allowing for zooming and panning, they might increase the accuracy of the responses obtained. 6
Using a Python script written by Adam Davis, UCSB Department of Geography
3.3
Yucatan Peninsula Research Data Footprints
Data Source and Uses. Universities increasingly curate data repositories to promote the discovery and reuse of research data. The data considered here expose the spatial extents of research projects from different domains. The first data set examined is UCSB archaeologist Dr. Anabel Ford’s archaeological sites and protected areas layer, which contains a collection of point locations and names for 530 archaeological sites on the Yucatan peninsula7 . The second data set examined is Stanford political scientist Tom Patterson’s global disputed border layer, which contains polyline features for disputed areas and breakaway regions derived from the CIA’s World Factbook boundary database8 . Questions and Lens Support. Leveraging the location of researcher data through the creation of footprints for data sets promotes data discovery and integration across disciplines. Researchers working across various domains may have overlapping study areas and would benefit from spatial data discovery. For example, a political scientist interested in contested regions should be able to discover and utilize a relevant protected heritage sites layer contributed by an archaeologist. Applying an object lens to study areas makes it possible to ask questions about their spatial properties and relationships, in particular: – Which data sets overlap with the spatial extent of the area of interest? A generic method is needed to generate a footprint of any research data type. Spatial metadata often includes an extent attribute, which delineates a minimum rectangular bounding box for the object. However, this extent alone is not a desirable data envelope, as the inclusion of an outlying feature can greatly exaggerate the geometry of the object [11]. Some library resources may also include place names, for example, Library of Congress subject headings. These place names need to be turned into footprints using a gazetteer. Constructing the Lens. Convex hulls are constructed from an input researcher data set, such as Ford’s geocoded archaeological site points and Patterson’s disaggregated contested border polylines: – Determine the spatial extent of each research object. – Determine overlap between research objects. Convex hulls are convex sets that contain all points [12] and are constructed for each data object using geoprocessing tools. The intersection of the convex hull shapefiles representing data set footprints reveals overlapping extents. Figure 4 demonstrates the spatial relationships among the constructed convex hulls. A partial intersection reveals a correspondence between protected areas of archaeological interest and a contested border region in Belize, which may 7 8
http://discovery.ucsb.opendata.arcgis.com/ https://earthworks.stanford.edu/
Fig. 4. Convex hulls constructed for research objects reveal intersections in extent.
be of interest to a domain scientist working in the region. Using location as an integrator of contents has potential to enhance the data discovery process, enhancing information retrieval across domains. Secondary Lens. Another lens view on research data sets that enables data discovery is that of a non-spatial network of linked data triples. The connections between nodes of researchers and the data that they produce are represented as edges for the predicate isReferencedBy: – Which research data sets reference publications in the area of interest? – Which publications are authored by researchers in the area of interest? Applying spatial lenses to researcher-generated data sets and to publications authored by researchers exposes undiscovered relationships, providing a basis for data discovery and leading to opportunities for trans-disciplinary research collaboration. 3.4
United States Historical News Archive
Data Source and Uses. The Chronicling America data set9 is an archive that contains newspaper issues published between 1836 and 1922. Although 9
http://chroniclingamerica.loc.gov/about/api
the database includes newspapers from across the United States, some regions appear better represented than others. Large-scale efforts to digitize historical archives are a relatively recent phenomenon and thus researchers are just beginning to explore the possibilities that this new data presents. Scholars, for example, have investigated the temporal dynamics of themes found in the Richmond Daily Dispatch during the Civil War [13]. With respect to the Chronicling America data set in particular, there do not appear to be any studies that approach the data set from a geographic point of view so far. Questions and Lens Support. A network lens can be used to investigate questions about relationships between place names in newspaper text: – Which pairs of place names frequently co-occur in newspaper texts and why? – What place names are most centrally mentioned (i.e., most connected to others)? Such a network can be inspected using traditional network analysis tools. For instance, important nodes (i.e., place names) can be identified using centrality measures, and clusters can be found with community detection algorithms. Moreover, it is possible to visualize this network using programming libraries or software tools such as Gephi (see Figure 5). Constructing the Lens. Pre-processing is a crucial step in applying spatial lenses to natural language data, as these data are unstructured and often noisy. Natural language processing tools are available to normalize and parse text, as well as to identify potential place names in text. Additionally, such data are fraught with misspellings and other formatting issues resulting from scanning. The Natural Language Toolkit (NLTK) for Python has been used to clean and parse text data. We also take advantage of a tool called CLIFF10 to recognize place names in newspaper articles. CLIFF accepts unstructured text as input and returns a list of standardized place names that were found. The key steps for constructing a network in this case are: – Determine proximity parameters for defining co-occurrences. – Identify place names using the CLIFF tool. – Iterate over entire text and maintain a list of place names that occur within the specific proximity. – Create an undirected network using the list of co-occurring place names and weigh each edge by the frequency with which the places co-occur.
Secondary Lens. The Chronicling America data set includes many historical issues of individual newspapers and it is appealing to apply a temporal granularity lens to it. Once the mechanisms for constructing a co-occurence network 10
http://cliff.mediameter.org/
Fig. 5. Cooccurrence network of all 1914 Aberdeen Herald issues
are built, it becomes easy to investigate the data at different temporal scales by aggregating newspaper issues into multiple time windows. Observing changes in the network structure over time can help scholars understand urban processes such as shifting neighborhood demographics or transformations in spatial structure. 3.5
California Wildfires and Land Cover Change
Data Source and Uses. Two sets of data are used in this section. The first is regional land cover data of California in four different years (1996, 2001, 2006, and 2010), produced by the Coastal Change Analysis Program (C-CAP) of the National Oceanic and Atmospheric Administration (NOAA) and updated every five years11 . Landsat TM 5 satellite imagery is used to produce these data, with 25 different land cover classes. The second data set is a list of the 20 largest California wildfires from 1932 to 2015, produced by California Department of Forestry and Fire Protection12 (see Figure 6). Monitoring land cover change is important for policy decisions, regulatory actions and subsequent land-use activities. These data are frequently used to generate landscape-based metrics and to assess landscape condition and monitor status and trends over a specified time interval [14]. Land cover change sometimes is set in motion by individual landowners and sometimes is driven by environmental forces. Over the past few decades, the most prominent land 11 12
https://coast.noaa.gov/ccapftp/ http://www.fire.ca.gov/communications/downloads/fact_sheets/20LACRES. pdf
Fig. 6. Data sources: Land cover in California in 1996 (left); 20 Largest California Wildfires (right) .
changes within the U.S. have been changes in the amount and kind of forest cover. Logging practices, development, urban expansion, and wildfires play the most important roles in this trend [16]. Questions and Lens Support. To analyze the effect of wildfires on land cover change in California between 1996 and 2010, in five-year time periods, we propose to use an event lens to look at the data. Both land cover change and wildfires can be seen as events, allowing users to relate and compare land cover change to wildfires, asking questions such as: – Is there a relationship between the number and the magnitude of wildfires and the amount of land cover change in a given time period? – What time period has experienced the greatest number of wildfires? – In what time period has the area of land affected by wildfires been greatest? Defining environmental phenomena as events enables the users to evaluate the interaction of these phenomena with land cover change and to reason about them. This is not easily done, if at all, with conventional methods. Constructing the Lens. An event lens enables the user to choose the unit on which they want to study change (the whole field, sub-fields, or even a set of objects). Each of these units could be defined in various sizes and forms, applying a granularity lens. To define land cover change events, we consider each satellite image as representing a field. By comparing two consecutive fields in time, an
event is constructed based on whether or not there is a difference between these two fields. The total number of events in which a certain class is changed can then be calculated and this value could give an estimation of the land cover change. Next, each of the 20 wildfires is defined as a separate event that has location (county), name, date, and affected area as properties. To construct events: – Compare land cover fields for all two consecutive pairs. – Create an event (and populate its properties) if there is a difference between two fields at a certain location. – Create wildfire events with corresponding properties. Having these two sets of events, we can observe their overlap, containment, and time of occurrence. The results of applying the overlap observer, for example, shows that the 2006-2010 period, by having six major wildfires and almost 1116 acres of land affected, has by far the greatest number of wildfires and the largest total area affected among the three periods. Secondary Lens. Since the wildfire data are at the county level, an idea for the secondary lens would be to use an object lens. One can then apply the event lens on these objects to assess the effect of each wildfire on its corresponding county and to study their relationship. Objects can be constructed using Geospatial Object Based Image Analysis (GEOBIA) methods such as supervised maximum likelihood classifier [17].
4
Conclusions
The idea of spatial lenses to view environments through data sets is presented here as a counterpoint to considering data sets as implying singular world views. Data are just data, and while they always result from a certain conceptualization, one can often beneficially interpret them in other ways, including ways not intended by their authors. Today’s GIS practice tends to lock users into conceptualizations based on data formats, discouraging the exploration of alternative views of data and, more importantly, of the phenomena under study. Balancing a possible need to restrict what can be done with data against the opportunity to exploit spatiality currently errs on the timid side, i.e. being overly restrictive (while still not really preventing inappropriate uses). Core concepts are a way of thinking about, encoding, and computing with phenomena in a few intuitive spatial ways. Users of spatial data will ideally approach these lenses knowing what questions they want to answer, and these questions will inform the choice of operations and consequently the lens. Therefore, in order to get meaningful results, data sets should be fed to lenses applied to study areas, rather than applying lenses to data sets. The question what data set can inform what lenses remains to be studied. Implementing more generic constructor operations for each lens will make it more specific by admitting certain data types but not others. Switching between different lenses, on the other
hand, appears to be possible even for one and the same data set (for example, seeing point measurements as defining objects or fields). The five case studies presented in this paper explore, illustrate, and test the idea of spatial lenses. They were chosen to represent a broad spectrum of data sets and applications, as well as to cover all four content and two quality concepts of spatial information defined in our previous work [18]. We have arranged them to start with straightforward object and field lens applications and progress to more elaborate or unusual applications. Each case study furthermore illustrates some less obvious aspects of the chosen data sets. Jointly, they demonstrate the versatility of the spatial lens idea, resulting from the decoupling of spatiotemporal question answering from data and file formats. For example, examining land cover time series from an event perspective is conceptually intuitive and powerful, but not possible using traditional techniques. Our lenses were straightforward for GIS savvy users to build. Our ambition in ongoing work is to build six generic lenses, usable by domain experts with little or no GIS expertise. Consequently, the next step in this research is to abstract each lens constructor from peculiarities in the data sets and build pieces of software that can be deployed as libraries or web services. These lenses will be parameterized to become applicable to all data sets that allow for an interpretation through them. For example, a field lens, when fed with a point data set with values from a continuously varying phenomenon, would determine the spatial and temporal domain of the field, ask the user for an interpolation method (or apply a default method), and produce an enriched data set that can then be queried by map algebra tools, used to produce isoline maps, or applied to any other field-based analysis.
Acknowledgments. The work presented in this paper (and the writing of the paper) was part of a graduate research seminar at the Geography Department of UCSB. All authors have contributed equally to the paper and are therefore listed in alphabetical order, with the seminar teacher going last. Additional contributions by Carlos Baez, Andrea Ballatore, Chandra Krintz, George Technitis, and Rich Wolski are gratefully acknowledged. The work was supported by the Center for Spatial Studies at UCSB.
References 1. Camara, G., Egenhofer, M.J., Ferreira, K., Andrade, P., Queiroz, G., Sanchez, A., Jones, J. and Vinhas, L.: Fields as a generic data type for big spatial data. In Geographic Information Science (pp. 159-172). Springer International Publishing (2014) 2. Lowe,M.: Night Lights and ArcGIS: A Brief Guide (2014). http://economics.mit. edu/files/8945; Online, accessed Nov-2015 3. Codd, E. F.: A relational model of data for large shared data banks. Communications of the ACM, 13(6), 377-387 (1970)
4. Kuhn, W., Kauppinen, T., and Janowicz, K.: Linked data-A paradigm shift for geographic information science. In Geographic Information Science (pp. 173-186). Springer International Publishing (2014) 5. Vahedi, B., Kuhn, W., and Ballatore, A.: Question Based Spatial Computing - A Case Study. In AGILE 2016 (in press). Springer International Publishing (2016) 6. Albrecht, J.: Universal analytical GIS operations: A task-oriented systematization of data structure-independent GIS functionality. Geographic information research: Transatlantic perspectives, 577-591 (1998) 7. Tomlin, C. D.: Geographic information systems and cartographic modeling (No. 526.0285 T659). Prentice Hall (1990) 8. Goodchild, M.F., Yuan, M. and Cova, T.J.: Towards a general theory of geographic representation in GIS. International journal of geographical information science, 21(3), pp.239-260 (2007) 9. Ester, M., Kriegel, H. P., Sander, J., and Xu, X: A density-based algorithm for discovering clusters in large spatial databases with noise. In Kdd, vol. 96, no. 34, pp. 226-231 (1996) 10. Montello, D. R., Friedman, A., and Phillips, D. W.: Vague cognitive regions in geography and geographic information science. International Journal of Geographical Information Science, 28(9), 1802-1820 (2014) 11. Hill, L. L.: Georeferencing: The geographic associations of information. MIT Press (2009) 12. De Berg, M., Van Kreveld, M., Overmars, M., and Schwarzkopf, O. C.: Convex Hulls, Mixing Things. in Computational geometry,(pp 243–258) Springer Berlin Heidelberg (2000) 13. Templeton, C., Brown, T., Battacharyya, S., and Boyd-Graber, J.: Mining the Dispatch under Supervision: Using Casualty Counts to Guide Topics from the Richmond Daily Dispatch Cor. In Chicago Colloquium on Digital Humanities and Computer Science (2011) 14. Jones, K. Bruce, Kurt H. Riitters, James D. Wickham, D. Roger Jr, Robert V. O’Neill, Deborah J. Chaloud, Elizabeth R. Smith, and Anne C. Neale: ”An ecological assessment of the United States mid-Atlantic region: a landscape atlas.” (1997) 15. Pielke, R. A., Marland, G., Betts, R. A., Chase, T. N., Eastman, J. L., Niles, J. O., and Running, S. W.: The influence of land-use change and landscape dynamics on the climate system: relevance to climate-change policy beyond the radiative effect of greenhouse gases. Philosophical Transactions of the Royal Society of London A: Mathematical, Physical and Engineering Sciences, 360(1797), 1705-1719 (2002) 16. Brown, D. G., C. Polsky, P. Bolstad, S. D. Brody, D. Hulse, R. Kroh, T. R. Loveland, and A. Thomson: Land Use and Land Cover Change. Climate Change Impacts in the United States. in The Third National Climate Assessment, J. M. Melillo, Terese (T.C.) Richmond, and G. W. Yohe (Eds.), U.S. Global Change Research Program, 318-332 (2014) 17. Walter, V.: Object-based classification of remote sensing data for change detection. ISPRS Journal of photogrammetry and remote sensing, 58(3), 225-238 (2004) 18. Kuhn, W. and Ballatore, A.: Designing a Language for Spatial Computing. In AGILE 2015 (pp. 309-326). Springer International Publishing (2015) 19. Liskov, B. and Guttag, J.: Abstraction and specification in program development. MIT press 1986