Exploring Time Diaries Using Semi-Automated Activity Pattern Extraction Katerina Vrotsou (
[email protected]), Kajsa Ellegård (
[email protected]) and Matthew Cooper (
[email protected]) Linköpings University, SE-581 83 Linköping, Sweden
Abstract Identifying patterns of activities within individuals’ time diaries and studying similarities and deviations between individuals in a population is of interest in time use research. So far, activity patterns in a population have mostly been studied either by visual inspection, searching for occurrences of specific activity sequences and studying their distribution in the population, or statistical methods such as time series analysis in order to analyse daily behaviour. We describe a new approach for extracting activity patterns from time diaries that uses, instead, sequential data mining techniques. We have implemented an algorithm that searches the time diaries and automatically extracts all activity patterns meeting user-defined criteria of what constitutes a valid pattern of interest for the research question. Amongst the many criteria which can be applied are: a time window containing the pattern, and minimum and maximum number of people that perform the pattern. The extracted activity patterns can then be interactively filtered, visualized and analyzed to reveal interesting insights using the VISUAL-TimePAcTS application. To demonstrate the value of this approach we consider and discuss sequential activity patterns at a population level, from a single day perspective, with focus on the activity “paid work” and some activities surrounding it. Questions can be posed such as: Which activities appear frequently in activity patterns related to paid work? Which are the activities surrounding work at different hours of the day? What differences are revealed between the sexes in the patterns? Exploration of the results of each pattern search may result in new hypotheses which can be subsequently explored by altering the search criteria.
Introduction The exploration and understanding of people’s everyday life is a topic of interest within several social sciences. Daily life is created, day by day, by individuals performing activities in order to fulfil the projects that they are involved in. Studying activities in daily life may allow the scientist to gain new insight into human behaviour as well as human relations at the individual, household or population levels. Studying the distribution of performed activities of a single individual or household allows an analyst to make several observations about the rhythm and possibly quality of life of this person or family. Moreover, studying the performed activities of many individuals simultaneously, such as larger groups or populations, allows observations of similarities and differences in the daily life of the group and also tendencies for constellations within a group depending on this behaviour. In this case, the focus is on activity patterns at a population level which is also the focus of this paper. Time use research is an effective approach to gain more knowledge about everyday life which is mostly taken for granted. The use of time diaries in which individuals record detailed information about their performed activities over a period of time is a common means to collect data for time use research. The collection of time diaries can result in huge databases of complex time use data to be studied and analysed and there are several approaches to this issue. One approach is to accumulate the time used for performing the activities according to different general categories and then visualize these using traditional statistical -1-
representations such as bar- or pie-charts. In this way general trends in groups of people are accounted for: this many men spend this much time doing a certain activity while a different proportion of the women spend this much time instead. Time use studies may involve the search for patterns in human behaviour. Whether these patterns are of a general form such as approximate activity trends or of a more detailed form such as sequences of specific activities, the overall goal is the same. The goal is to make sense of why a day looks like it does with respect to performed activities. Is the interleaving of activities important? Do similar people perform activities in the same order? What sequences of activities are more common than others in a population? What conclusions can be drawn about the individuals performing similar sequences? Activity patterns can be found at an individual level, but also at household and group or population levels. An activity pattern in this paper is defined as a sequence of activities performed by an individual which, by itself or together with other activities, aims at accomplishing a more general goal/project. When analysing a single day of diary data, activity patterns identified in a single individual (referred to as an individual activity pattern) are unlikely to be significant but those found amongst a group or population (a collective activity pattern) are of greater interest. Within a collective activity pattern one can detect the different combinations of activities that accomplish the same goal and study the characteristics of the individuals performing them. One can also detect combinations that are similar for many individuals in a population or combinations that occur frequently in a population and then more closely study the similarities of these individuals. Patterns of activities are, therefore, interesting for gaining new insight into everyday life; their detection, however, is not an intuitive task. The collection of time diaries through time use studies can result in a large amount of data that may be difficult to comprehend at first glance. Simply studying the time diaries is a time consuming process, trying to detect patterns within them takes even longer. A visual representation of the time diaries is an advantage in this respect, as images are easier to interpret than the text and figures in the lengthy columns of the time diaries. A standard method to detect patterns in diary data is to predefine an interesting sequence of activities and manually search for this sequence in the diary data. A visual representation is also advantageous here as it may make the patterns easier to distinguish. However detection of patterns by visual inspection is still a time consuming process. Innovative automation is needed both in the study of the diaries themselves but also, and most importantly, in the extraction and exploration of interesting activity sequences and relationships. An automated system would allow a time use researcher to make better use of their time as it would reduce the time spent on locating interesting activity patterns in a set of data, and increase the time available for the actual study of these patterns.
-2-
Apart from the manual extraction of activity patterns in time diaries there are today attempts to automate the process. Optimal matching is an example of such an attempt. Optimal matching, first introduced in the social sciences in 1986 by Abbott and Forrest (Abbott & Forrest, 1986), is a sequence analysis method originally used for similarity analysis of protein sequences. According to this method the similarity of two sequences can be determined by the number of operations needed to transform one sequence into the other (Abbott & Tsay, 2000). The operations used are insertion, deletion and substitution and each operation carries a cost. It is this cost that defines the degree of similarity between the sequences. The resulting weighted sequences can then be analysed using cluster analysis. A drawback with using this method for comparing activity sequences is that the transformation operations used do not preserve the nature of the sequences. Using insertion and deletion is destructive for the timing, since it changes the duration of the sequence, while using substitution is destructive of the actual activities performed (Lesnard, 2006). Furthermore, optimal matching in social science is used to reveal the social rhythm of large groups of individuals and general trends of daily behaviour. In this paper we are interested in studying collective activity patterns of groups or populations while preserving the individuality of the group members in the process. We propose, therefore, an alternative method based on data mining techniques for extracting activity patterns from diary data that preserves the order, timing and duration of the patterns. We have combined sequential pattern mining, visualization and interaction techniques to allow the extraction of activity patterns from diary data in an attempt to assist and simplify the study of the everyday life of populations. The sequential mining algorithm that we have used for the activity pattern extraction is an “AprioriAll” algorithm which we have adapted to the time diary data. We have introduced interaction to its computation to give the user the power to control the process. And finally we have visualized the resulting activity patterns with a time geographical representation that allows their study in the context of the everyday lives of the individuals. So far the method has been used on a single day basis but it can be easily applied over longer time periods. The activity pattern extraction has been integrated into a visual activity-analysis tool called VISUAL-TimePAcTS, introduced at last years IATUR conference (Ellegård & Vrotsou, 2006). This paper is arranged as follows: first a short description of the time geographical representation used in VISUAL-TimePAcTS will be given. A definition of the activity patterns considered here will follow as well as a motivation for why they are interesting for time use research. In the next section the activity pattern extraction will be explained followed by an example of the pattern extraction process and the extracted patterns. Finally some comments on the performance of this activity pattern extraction implementation will be given and a discussion of the retrieved patterns and the value of these results.
Time Diary Visualization The research work presented in this paper has been developed as a feature in the visual activity-analysis tool, VISUAL-TimePAcTS (Ellegård & Vrotsou, 2006), which is a visualization application for interactively studying time diaries of individuals, groups and whole populations. The representation used within VISUAL-TimePAcTS is inspired by the time geographical conceptual framework, formulated by Professor Torsten Hägerstrand (Hägerstrand, 1970). This conceptual framework considers populations as groups of individuals and not as indistinct aggregate masses. Each individual is unique and his/her spatial behaviour is -3-
uniquely defined and constrained by their geographical location, by socioeconomic rules and conventions and by past experiences and knowledge. Time is a continuously changing variable that constrains the individuals’ behaviour, as an individual can be at only one place and perform a single activity at each point in time. An individual’s movement in space and time can therefore be represented by a single continuous vertical trajectory called a space-time path (figure 1). This original time geographic concept is mainly concerned with the spatial movement of an individual over time while the activities performed by the individual – if considered – are implicitly derived from the places visited during this space-time movement. The activities an individual performs over time, however, can be described in a way that resembles their spatial movement over time. Activities, similar to the space-time movement, take time to perform, they have a start time and a duration and occur in time after each other. The original time geographical concept was therefore extended to consider also every day life activities (Ellegård, 1999) and these activities too can be represented by a single continuous vertical trajectory called in this case the “activity path” (figure 2). These activity paths make up the main representation of time diaries used in VISUAL-TimePAcTS.
Figure 1: The “space-time path” is the time Figure 2: The “activity path” is an extension geographical representation of an individual’s of the time geographical concept and is used movement in space over time. to represent an individual’s performed activities over time. The activities in this representation are divided into seven generalized activity categories each represented by a unique colour (figure 3).
Figure 3: Colour legend used in VISUAL-TimePAcTS. Each generalized activity category is represented by a unique colour. -4-
Individuals’ activity paths in the application seen from the side represent the change from one activity to another over time (figure 4a). The side and the rotated (figure 4b) views allow the observer to see the breakdown of the activity categories in more detail. Seen from the front only the general division of activities in the seven main categories can be detected (figure 4c). At a quick glance, the activity path seen from this view may resemble a bar chart holding information about the time spent by the individual on each activity category, there are significant differences, however. Traditionally representing the performed daily activities with a bar chart involves accounting for the accumulated time spent by an average individual on each daily activity or group of activities. This representation, however, hides important information, such as the time of a day when activities are performed, their duration and the number of times activities occur in the course of the day. This is information that is constantly available to the viewer of the activity path.
(a) Side View (b) Rotated View (c) Front View Figure 4: Visualization examples of the activity paths of two household members in VISUALTimePAcTS (man at position 1 and woman at position 2). Time is shown in the y-axis and colours represent the 7 activity categories. (a) Represents the activity paths of the two individuals viewed from the side. This view allows the observer to see the breakdown of the activity categories into more detailed descriptions. (b) Shows a slightly rotated view of the activity paths and the ‘movement’ between the activities so that the similarity to the original ‘space time path’ becomes clear. (c) Shows the front view visualization, where only the general division of the activities can be detected through the use of colour.
-5-
The use of activity paths in the study of everyday life is useful as it allows the study of groups of individuals simultaneously while at the same time preserving the uniqueness of each individual. Drawing the activity paths of a group side by side in a box-like configuration (figure 5), gives the researcher the opportunity to access information about the character and actual timing of the activities of whole populations in a single representation.
Figure 5: Front view visualization of a weekday of women aged 22 – 33 in VISUALTimePAcTS. The activity paths of a group of individuals can be drawn side by side allowing a detailed overview of the time use of this group. Time is shown in the y-axis, individuals are ordered by age on the x-axis and colours represent the 7 activity categories.
Diary Data The time use data used for the examples in this paper has been collected by the national statistics bureau of Sweden, Statistics Sweden (SCB) 1 , in a pilot study performed on 179 households consisting of 463 individuals. The raw data consists of handwritten time diaries in which the performed activities are logged. These activities are then translated into a predefined hierarchical set of some 600 numerical codes with 5 levels of detail and grouped into 7 main categories: care for oneself, care for others, household care, reflection/recreation, transportation, procure and prepare food, and gainful employment or school. Each level of detail, n , is broken down into more detail at level, n − 1 , so level 5 is the most general level while level 1 is the most detailed.
1
http://www.scb.se
-6-
Activity Patterns An activity pattern is defined as a sequence of performed activities which, by itself or together with other activities, aims at accomplishing a more general goal/project. This sequence may occur at the individual or the various collective levels. Each particular researcher may have different criteria which determine whether a sequence is a valid pattern depending on the specific research they are conducting. “Prepare food” followed by “eating” is a simple activity sequence and may be considered, by one researcher, to be an activity pattern if it appears regularly more than once in a period of time, perhaps a day or a week or a month, at the single individual level. Another researcher may be interested only in sequences which occur within a period of time for all or many of a larger number of individuals, that is as a collective activity pattern. The diary data appropriate to the various kinds of research interest may vary, for example according to the level of detail and length of time period across which the data is recorded. The data we are analysing in our studies consists of single day diaries and so searching for patterns at the single individual level is of less interest. We are, therefore, focussed on the identification of collective activity patterns and hence the examples we will use relate to one day at population level. The same analytic techniques described can, however, be applied equally well to both individual and population levels and for longer or shorter time periods of diary data (several subsequent day diaries for example). A collective activity pattern might be searched for by identifying an activity sequence forming a project like “getting ready for work” in the morning. It might consist of the following activities: “have breakfast, read newspaper, travel by car, work”. We have found this activity pattern to be interesting within our data and will use it as an example in this paper. The identification of activity patterns and their subsequent analysis forms a useful technique for understanding how individuals carry out projects within their daily lives and, in order to enable the location of activity patterns in time diary data, an automatic pattern extraction feature has been added to the VISUAL-TimePAcTS application and is described in the next section.
Semi-Automatic Activity Pattern Extraction Algorithm An automatic pattern extraction algorithm as mentioned before would assist the time use researcher in two ways. First, it would allow the researcher more time to analyse the resulting activity patterns of a population. And second, such an algorithm would open up the possibility of new discoveries. The researcher may come across activity patterns that were unexpected and gain new insight about the time use of populations. This has been our motivation for attempting to use sequential pattern mining for finding interesting relationships in social science diary data.
Sequential Pattern Mining Sequential pattern mining is a technique for finding frequently occurring sequences of events in large databases. This technique has previously been used in applications such as retail databases for merchandise placement in stores, so called ‘market basket analysis’, and other targeted marketing tasks but could also be used for mining ordered event sequences in any categorical data, for example weather data, telecommunication data or internet access data. An example application of sequential pattern mining is in the analysis of internet transaction data. Data on internet purchases of films include which movies are bought by buyers on
-7-
different occasions. Each transaction is considered a unique event in time and a record may be kept of the items included in every transaction. The successive transactions that a customer makes over a period of time are then considered to be a sequence of events which can be logged and analysed in order to better meet the needs of the customers. Similarities can be found in the data concerning the order and the timing of purchases of certain movies, for example sequels, and a measure of similarity (a support) can be applied to the event sequences (successive purchases by a customer). Rules can then be determined based on this support, so called association rules, and suggestions can be given to customers based on these rules. If, for example, 6 out of 10 people that bought the movie “The Bourne Identity” also bought the movie “The Bourne Supremacy” within a two month period, then a rule can be defined from this data that if a person buys the first movie the support for buying the second one is 60%. Having this information at hand the next time a buyer chooses to buy “The Bourne Identity” a suggestion can be made by the seller to buy the sequel, saying that most people that bought the first one also bought the second one. The nature of the time use diary data that we deal with here is similar to that of the transaction categorical data described previously. A performed activity is a performed event in time. An individual performs several activities during a day in a certain order, these make up different activity sequences. The ordering of each of these sequences, their frequency of occurrence and the manner of their repetition within a population are of interest to the time use researcher as they may reveal interesting categorizations or characteristics within this population. However, the individuals’ diary data are more complex to handle than simple purchase data. The researcher should be able to define the attributes that these sequences must have in order to make them interesting patterns to study. Hence, the same technique can be used for the extraction of the patterns but it must be able to include other criteria than just the frequency of their occurrence. A common algorithm used to perform association mining is the “Apriori” algorithm introduced in 1994 (Agrawal & Srikant, 1994). This algorithm was extended to apply to sequential data in 1995 and the “AprioriAll” algorithm was formulated (Agrawal & Srikant, 1995) and refined in 1996 (Srikant & Agrawal, 1996). The algorithm is based on the assumption that if an event sequence does not satisfy the user defined minimum support then it is not frequent and any higher order sequences will not be frequent either. The algorithm searches for events that satisfy the minimum frequency support in a database. Higher order candidate event sequences are then created incrementally, using only the frequent events/sequences, and tested against the data. In this way the algorithm considers only the sequences that are most likely to be frequent, reducing the search space dramatically. Further development has been carried out on sequential mining algorithms to improve and optimize the search (Garofalakis et al, 1999, Masseglia et al, 2004) and refine the constraints which can be applied (Pei et al, 2002, Xiong & Zhu, 2005).
-8-
Introducing the algorithm In the pattern extraction process we consider the diary activities as events and a sequence of events is then a sequence of two or more ( n ) activities which will also be referred to as an n − tuple . When a pattern, n − tuple , is located in an individual’s diary the pattern activities may occur immediately after each other leaving no gap between them ( gap = 0 ) or other activities may intervene between the pattern activities creating a gap between them ( gap > 0 ). This can be seen in figure 6 where the pattern {“cook dinner”; “eat dinner”; “wash dishes”} has been located in two different individuals’ activity paths. In figure 6a the individual washes the dishes immediately after having finished dinner, while the individual in figure 6b takes a pause to smoke before washing the dishes.
(a) a zero gap match of the activity pattern (b) a gap = 1 gap match of the activity pattern {“cook dinner”;“eat dinner”;“wash dishes”} {“cook dinner”;“eat dinner”;“wash dishes”} Figure 6: Examples of two different activity patterns in VISUAL-TimePAcTS.
-9-
We have used the “AprioriAll” algorithm as a starting point for the pattern extraction and adjusted its computation and constraints to match the time diary data that we deal with. We use the lower order event sequences to create higher order ones depending on the constraints that define the interesting attributes in an activity pattern. We have introduced a lot of user control to the computation of the algorithm as the main goal isn’t simply to find frequently occurring activity sequences. The user should also be able to decide on the character of the extracted patterns.
Figure 7: Overview of the activity patterns extraction algorithm The activity pattern extraction algorithm principally iterates over three steps (figure 7): 1. candidate activity patterns are generated 2. the candidates are located in the dataset 3. the located candidates are filtered according to user constraints The pattern extraction process is at all times steered by user defined constraints specifying the attributes that make an extracted pattern interesting for study. These constraints, which will be explained in detail later, are: 1. a minimum and maximum pattern duration 2. a time window within which the pattern must occur 3. a minimum and maximum gap between adjacent pattern activities 4. a minimum and maximum number of occurrences of the pattern 5. a minimum and maximum number of people (or a percentage of the population) that should be performing the pattern This list of criteria is that which we have found useful so far but it is being extended as required. After the algorithm has run to completion the resulting extracted patterns become available to the user for interactive visual analysis.
- 10 -
Candidate Pattern Generation The first step of the activity pattern extraction algorithm is the candidate pattern generation. In the first step of the first iteration all the single activities of the population are counted and the ones that don’t fit the constraints are ignored while the others go on to the next step of the iteration. In the second iteration all the remaining single activities are joined together (denoted by ⋈) to create pairs of activities ( 2 − tuples ). All pairs that satisfy the constraints are then sent to the next step in the algorithm while the others are discarded. The remaining iterations continue similarly, pairs are joined to create triples ( 3 − tuples ), 3 − tuples are joined to create 4 − tuples etc. until no more candidate n − tuples can be generated. Due to the sequential nature of the data there are only four ways that two n − tuples can be joined together. They have to have n − 1 elements exactly identical and can result in at most two ( n + 1) − tuples . There are 4 separate ways in which n − tuples can be joined together. If a, b, c, d are the activities in 3 − tuples then the different joins to create the 4 − tuples are: 1. ( a, b, c ) ⋈ (a, b, d ) → (a, b, c, d ) → ( a , b, d , c ) 2. ( a, b, c ) ⋈ (b, c, d ) → (a, b, c, d ) 3. ( a, b, c ) ⋈ (d , a, b) → (d , a, b, c ) 4. ( a, b, c ) ⋈ ( d , b, c ) → (a, d , b, c ) → ( d , a , b, c ) A candidate ( n + 1) − tuple is valid if and only if it is composed of subtuples that have survived the previous iterations’ filtering. Because of this many generated candidates can be immediately eliminated from the process thus reducing the search. When the candidate patterns have been generated they are sent to the next step of the algorithm; the pattern location.
Pattern Location The algorithm steps through the generated candidate patterns one at a time and matches each of them to the diary data. The constraints on the patterns are considered during this search and the matches that don’t satisfy these constraints are ignored, while the ones that do are considered to be the extracted patterns. A record is kept of the number of occurrences of each valid extracted pattern, the individuals performing them, and the patterns’ location in the dataset. This information is saved for every iteration of the algorithm in a data structure and is then used in the study and visualization of the patterns. If no matches are found for the generated candidate patterns then the algorithm terminates otherwise the extracted patterns are filtered.
- 11 -
Pattern Filtering In the filtering step the extracted pattern matches are tested against the user specified constraints. Let us take a closer look at these constraints. 1. The user can specify a minimum and maximum duration that a sequence of activities in the activity diaries should have in order for it to be classified as an interesting activity pattern. A user can, for example, decide that only short activity patterns that complete within 2 hours are interesting to study. 2. A time window deciding the time of day of occurrence for the activity pattern can be specified. A user may, for example, be only interested in studying activity patterns that occur in the evening. 3. A minimum and maximum gap between the activities of a pattern can also be defined. This means that a user can choose the number of other activities that are allowed to interrupt two pattern activities. The user may want to study patterns in which activities follow one another immediately in the individuals’ days, as in figure 6a, or may regard the activity pattern in figure 6b as equally valid. 4. The minimum and maximum number of occurrences of each extracted pattern can also be set by the user. The user can select to study only frequently occurring patterns for example. 5. And finally the minimum and maximum number of people (or a percentage of a population) that should be performing the extracted pattern can be set. The user for example may be interested only in patterns that are performed by the majority of the population. Some of the constraints are applied during the candidate generation and the pattern location in order to speed up the process. The time window constraint, for example, is applied when initiating the algorithm and counting the single activities. There is no need to take into account activities that are outside of the specified time window as these will be eliminated in the filtering step either way. The time window, the pattern duration, and the minimum and maximum gap are considered in the pattern location step and pattern matches that exceed these limits are not recorded. Finally, in the pattern filtering step the remaining limits are tested for all the extracted patterns. When the filtering step of an iteration has finished an occurrence graph is drawn showing the number of occurrences of each extracted pattern. The user can at this stage choose to define new constraints that will apply to the next iteration or continue the pattern extraction with the same settings. The user can also choose to terminate the algorithm calculation. If no extracted patterns survive the filtering then the algorithm terminates and the results are ready to be visualized otherwise it continues to the next iteration and the generation of new higher order candidate patterns.
- 12 -
Visualization & Interaction The extracted patterns are listed, by order, in the graphical user interface of VISUALTimePAcTS and made available to the user. The user can select one or more extracted patterns to be displayed in the visualization window. The extracted patterns are highlighted within the context of the individuals’ activity paths in the population. They are brought into focus by being drawn in colour while the surrounding activities are drawn in grey. The pattern activities are coloured depending on the activity category that they belong to, each of which is assigned a unique colour. The user can, at any time, switch between the default visualization and the pattern visualization and also switch between the different levels of the extracted patterns. The pattern extraction algorithm finds all the patterns in the data that match the user specifications. This can result in large numbers of activity patterns, that aren’t always as easy to examine. For this reason further filtering of the identified patterns has also been added to the pattern extraction feature. A scripting language has been implemented that allows the user to write commands applying logical operators on the resulting pattern set of a specific order. The operators available to the user are: 1. AND operator. The user can apply this operation to one or more activities and all of these must be present in the patterns one wishes to study 2. OR operator. The user can apply this operation to one or more activities and at least one of these must be present in the patterns one wishes to study 3. RANGE operator. The user can select an activity range that the pattern activities should lie within. A range can be decided for all the activities or for a position in the pattern. For example the user can search for patterns with the first pattern element within the code range 0-100 (care for oneself activities). 4. FOLLOWED BY operator. The user can select to search for patterns where certain activities or ranges of activities succeed one another. For example the user can search for result patterns in which a travel activity is followed by a work activity. The different operators can, of course, be combined and longer filtering commands can be applied. The user can at any time interact with the visualization by rotating, moving and zooming into it. Information about the individuals is also available to the user on demand. Clicking on an individual with the mouse displays details about the individual and the activity they are performing at the point of contact. The user can also make a snapshot of the displayed visualization for future comparison of several pattern visualizations with each other. In the next section an example will be given of the pattern extraction algorithm computation and all the steps will be explained and seen in practice. Some of the resulting extracted patterns will then be discussed in more detail.
- 13 -
Example of Pattern Extraction Algorithm An example will be gone through step by step in order to demonstrate how the pattern extraction feature works in the VISUAL-TimePAcTS application. The resulting extracted patterns will be then explained and compared.
Figure 8: Front view visualization in VISUAL-TimePAcTS of a group of individuals aged 20 – 65. Time is shown in the y-axis and the individuals are ordered along the x-axis by age and gender. Colours represent the 7 activity categories. For the example a group of individuals aged 20 to 65 was chosen to be studied on a weekday and with an activity level of detail of 2; a quite high level of detail. Figure 8 shows the front view visualization of the activity paths of this group within VISUAL-TimePAcTS and table 1 shows some numerical information concerning the selected group in comparison with the total database population. We are interested in looking at activity patterns in the population which concern the activity context of work in daily life.
- 14 -
Selected group
Total Population
20 – 65 10 – 97 Age 289 463 No of individuals 150 233 Women 139 230 Men 10514 15477 Diary entries 262 270 No of unique activities Table 1: Numerical information about the selected group of individuals compared with the total population. The pattern extraction algorithm was run twice with two different sets of constraints. The specified constraints of the first run were: a maximum pattern duration of 8 hours, no gap between the adjacent pattern activities and a minimum of 15 individuals performing the pattern (see table 2). Minimum
Maximum
1. Pattern Duration 0 8 (hours) 00:00 24:00 2. Time Window 0 0 3. Activity Gap 1 ∞ 4. Pattern Occurrences 5. No of Individuals 15 283 performing the pattern Table 2: User specified constraints applied to the first example run of the pattern extraction algorithm.
Figure 9: User specified constraints applied to the first example run of the pattern extraction algorithm as seen in the user interface of VISUAL-TimePAcTS.
- 15 -
After having defined the constraints that the extracted patterns should meet through the user interface (figure 9) the first iteration of the algorithm can start. The unique single activities ( 1 − tuples ) are first found in the diary data. These are matched in the individuals of the group, their occurrences counted and a record of the activities’ location in the data and of the individuals engaging in them is created. The 1 − tuples are then filtered according to specified constraints and a graph showing their occurrence frequency is drawn (figure 10a). This concludes the first iteration of the algorithm and the system is now ready to start the second. The user can at this point choose to alter the constraints that will apply to the second iteration or continue with the same ones.
(a) Occurrence Frequency Graph of order 1 (b) Occurrence Frequency Graph of order 2 Figure 10: Examples of occurrence frequency graphs in the VISUAL-TimePAcTS application. At each iteration of the pattern extraction algorithm after candidate patterns are generated, located and filtered, a graph of the resulting extracted patterns is drawn. Starting the second iteration with the same constraints will first create candidate pairs ( 2 − tuples ) of activities by joining together all 1 − tuples . These candidate 2 − tuples will then be matched to the diary data of the selected group of individuals and a record of information will be created for the matched 2 − tuples . These matched 2 − tuples will then be filtered against the constraints and an occurrence frequency graph of these will be drawn (figure 10b). The algorithm in response to a user command will go on to join 2 − tuples in order to create, match and filter 3 − tuples and then continue similarly until no more candidate patterns can be generated or until no more matched patterns survive the filtering.
- 16 -
When the algorithm has run to completion the resulting extracted patterns are listed and made available to the user (figure 11a). The user can select from the list the order of patterns to study and list all the extracted patterns of this order (figure 11b). One can, for example, choose to study the patterns of order four, 4 − tuples .
(b) List of extracted quadruples ( 4 − tuples ) which include the activity “paid work” (900) Figure 11: Results of the first run of the pattern extraction algorithm as seen in the VISUAL-TimePAcTS user interface. (a) Overview list of all extracted patterns
- 17 -
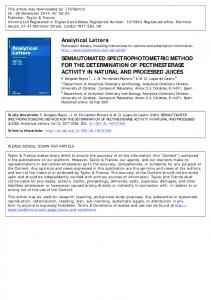
Selecting one or more 4 − tuples from the list of extracted tuples will result in a highlighting of these patterns in the context of the days of the individuals in the population. Figure 12 shows an example of choosing to inspect the distribution of the pattern {“have breakfast”; “read newspaper”; “travel by car”; “work”} (). This pattern appears 15 times in the population and is a strong candidate for the project of “getting ready for work” although, of course, many other sequences may be present which other individuals follow in the process of getting to work.
Figure 12: Visualization of the 4th order pattern {“have breakfast”; “read newspaper”; “travel by car”; “work”} () in VISUAL-TimePAcTS. The constraints applied in the pattern extraction algorithm are: minimum of people 15 performing the activity pattern, maximum gap of zero between adjacent pattern activities and maximum pattern duration of 8 hours.
- 18 -
Looking at the distribution of this activity pattern in the population (figure 12) we can see that it is almost only performed by men aged 35 and older. If we go deeper into the analysis and look at a lower order patterns including only three of the activities in the previous activity sequence, {“read newspaper”; “travel by car”; “work”} () for example (figure 13), we notice that one more (older) woman is added to the individuals in the population engaging in this pattern. Since it is reasonable to think that women and younger men will also indulge in these activities we might suspect that they do so but that the activities in the sequence are not performed immediately one after the other. Perhaps, for women and younger men, the sequence is interrupted by, for example “go to the day care centre with a child” or “wash the dishes”.
Figure 13: Visualization of the 3rd order pattern {“read newspaper”; “drive car”; “work”} () in VISUAL-TimePAcTS. The constraints applied to the pattern extraction algorithm are: minimum of 15 people performing the pattern, maximum gap of zero between adjacent pattern activities and maximum pattern duration of 8 hours. We can explore this new hypothesis that young men and most women are doing other activities that interrupt the project “getting ready for work”, comprising the activities {“eat breakfast”, “read newspaper”, “travel by car”, “work”}, by running the algorithm again but altering the constraints. We permit a gap, here of maximum 4, other activities between the adjacent pattern activities (table 3).
- 19 -
Minimum
Maximum
1.
Pattern Duration 0 8 (hours) 00:00 24:00 2. Time Window 0 4 3. Activity Gap 1 ∞ 4. Pattern Occurrences 5. No of Individuals 15 283 performing the pattern Table 3: User specified constraints applied to the second example run of the pattern extraction algorithm. Reanalysing the data with this reduced constraint (maximum activity gap = 4) we find the expected results: more young men (6 additional) and more women (10 additional) are performing this pattern. Now 39 individuals carry out the pattern, compared to 15 in the example with no interruptions allowed (maximum activity gap = 0). However, it remains the case that few younger women perform this collective activity pattern. Further analyses can be performed to determine which are the activities that interrupt the pattern and study them.
Figure 14: Visualization of the 4th order pattern {“breakfast”; “read newspaper”; “drive car”; “work”} () in VISUAL-TimePAcTS. The constraints applied on the pattern extraction algorithm are: minimum of 15 active in the pattern people, maximum gap of 4 between adjacent pattern activities and maximum pattern duration of 8 hours. In total 39 individuals (12 women and 27 men) perform this activity pattern at the population level.
- 20 -
Results & Discussion We have presented the adaptation of a sequential mining algorithm to time diary data which was implemented as a feature in the visual activity-analysis tool VISUAL-TimePAcTS. The algorithm and the visualization framework are implemented in C++, OpenGL and using wxWidgets for the graphical user interface. Table 4 shows results from running the algorithm on a laptop PC with a dual core 2GHz Centrino CPU and 2GB RAM, for the dataset described in the examples (289 individuals performing, in total, 10514 activities) and applying different constraints to the pattern extraction. The results show that activity patterns can be extracted in interactive times for large subsets of the population, as long as constraints are set on the pattern extraction. The goal of the pattern extraction feature has been to facilitate the automated identification of collective activity patterns in a population of individuals while preserving the group members’ individuality when studying the identified activity patterns. The results from using the feature and analysing the extracted activity patterns appear promising with respect to this goal. The pattern extraction algorithm identifies all activity patterns that meet the user specified constraints while maintaining the ordering and duration of the activities in these activity patterns. The user has control of the calculation of the algorithm which implies flexibility in the specification of what constitutes an interesting activity pattern. The definition of what is interesting varies depending on the research question asked or the population under study. Flexibility and ability to meet varying conditions and restrictions is therefore important in time use studies. Furthermore, the analyst using the pattern extraction feature of VISUALTimePAcTS has freedom in the study and analysis of the extracted patterns. The extraction algorithm may result in a number of activity patterns so large that it can be difficult to interpret. The filtering script language implemented allows the analyst to narrow the results list and look at fewer at a time. Also, the user can click down the list of resulting patterns and see their distribution over the population while doing so. In this way an analyst can get an overview of the extracted activity patterns in the population and quickly notice interesting distributions amongst these patterns and then go back and study them more closely. The extracted activity patterns, as discussed earlier in the paper, are visualized in the context of the daily lives of the individuals in the population under study. This visualization allows the user to interactively explore the extracted patterns in context and to see how the activity patterns are distributed throughout the day, how different individuals perform them, and which activities are likely to interfere with and interrupt the carrying out of the larger projects which these activity patterns represent. This has proven to be an effective way to discover interesting new and unexpected features in the everyday lives of the individuals in a population. The visualization of the results facilitates the understanding of the activity patterns and gives a concrete picture to use as a common ground for discussions and analyses. Age and gender specific collective patterns are revealed. The opportunity to look at activity sequences allows a rich knowledge about collective activity patterns. Future work includes the extension of the search and filtering criteria to support new users and new types of activity patterns in the data. Each new kind of task and new type of data being considered requires modifications to the search criteria and the list is becoming - 21 -
extensive to support the many types of user who may be interested in this type of searching. The scripting language for the combination of filtering criteria also needs to be made more user-friendly, perhaps through a graphical user interface, to make it easier for users to make better use of the available logical combinations. While the methods implemented appear promising and early feedback from users has been supportive we are also conducting evaluations of the visualization methods and interaction to objectively determine how effective they are in supporting the users while attempting to assimilate the large and complex data which the diaries represent. These results will be presented in future publications.
Order (n)
Example 1
2
3
4
1 2 3 4 1 2 3 4 5 1 2 3 4 5 1 2 3 4 5 6 7
Level Of Detail
Min People
Max Pattern Duration
Max No of Pattern Activities Gap
2
15
4
0
2
15
8
0
2
15
4
4
2
15
8
4
80 38 20 9 80 39 22 10 3 80 58 42 26 16 80 58 45 29 18 13 5
No of Patterns 80 98 24 5 80 101 29 10 1 80 385 351 121 12 80 424 571 350 97 12 1
No of TIME Occurrence (sec) s 8819 3289 721 91 9168 3563 883 197 18 8819 18770 14463 4680 448 9168 21914 25770 15494 3988 411 23
0.58 2.39 0.70 0.36 0.58 2.44 0.67 0.38 0.38 0.53 6.14 4.56 1.05 0.39 0.56 6.42 5.53 1.86 0.59 0.36 0.39
Table 4: Results from running the pattern extraction algorithm on a laptop PC with a dual core 2GHz Centrino CPU and 2GB RAM and applying different constraints to it.
- 22 -
References Abbott, A. and Forrest, J. (1996): “Optimal Matching Methods for Historical Data.” In Journal of Interdisciplinary History, 16:473-96. Abbott, A. and Tsay, A. (2000): “Sequence Analysis and Optimal Matching Methods in Sociology.” In Sociological Methods and Research, 29:3-33. Agrawal, R. and Srikant, R. (1994): “Fast Algorithms for Mining Association Rules.” In Proc. of the 20th Int'l Conference on Very Large Databases, Santiago, Chile. Agrawal, R. and Srikant, R. (1995): “Mining Sequential Patterns.” In Proc. of the 11th Int'l Conference on Data Engineering, Taipei, Taiwan. Ellegård, K. (1999): “A time-geographical approach to the study of everyday life of individuals - a challenge of complexity”. In Geojournal, volume 48, no 3. Ellegård, K. and Vrotsou, K. (2006): “Capturing patterns of everyday life - presentation of the visualization method VISUAL-TimePAcTS.” In IATUR - XXVIII Annual Conference, Copenhagen, Denmark, August 16-18. Garofalakis, M. N., Rastogi, R. and Shim, K. (1999). “SPIRIT: Sequential pattern mining with regular expression constraints.” In The VLDB Journal, pages 223–234. Hägerstrand, T. (1970): “What about people in regional science.” Regional Science Association Papers, 14:7-21. Lesnard, L (2006): “Optimal Matching and the Social Sciences.” In IATUR - XXVIII Annual Conference, Copenhagen, Denmark, August 16-18. Masseglia, F., Poncelet, P., and Teisseire, M. (2004). “Pre-processing time constraints for efficiently mining generalized sequential patterns.” In TIME ’04: Proc. of the 11th International Symposium on Temporal Representation and Reasoning, pages 87–95, Washington, DC, USA. IEEE Computer Society. Pei, J., Han, J. and Wang, W.(2002). “Mining sequential patterns with constraints in large databases.” In CIKM ’02: Proc. of the Eleventh Int'l Conference on Information and Knowledge Management, pages 18–25, New York, USA. ACM Press. Srikant, R., & Agrawal, R. (1996). ”Mining sequential patterns: Generalizations and performance improvements.” In Proc. of the Fifth Int'l Conference on Extending Database Technology (EDBT). Avignon, France. Xiong, Y. and Zhu, Y.(2005). “A multi-supports-based sequential pattern mining algorithm.” In Proc. of the Fifth Int'l Conference on Computer and Information Technology, pages 170–174, Shanghai, China. September 21-23. IEEE Computer Society.
- 23 -