#mytweet via Instagram: Exploring User Behaviour across Multiple Social Networks
arXiv:1507.03510v2 [cs.SI] 14 Jul 2015
Bang Hui Lim1 Dongyuan Lu1 Tao Chen1 Min-Yen Kan1,2 1 School of Computing, National University of Singapore 2 NUS Interactive and Digital Media Institute, Singapore
[email protected] {ludy,taochen,kanmy}@comp.nus.edu.sg Abstract—We study how users of multiple online social networks (OSNs) employ and share information by studying a common user pool that use six OSNs – Flickr, Google+, Instagram, Tumblr, Twitter, and YouTube. We analyze the temporal and topical signature of users’ sharing behaviour, showing how they exhibit distinct behaviorial patterns on different networks. We also examine cross-sharing (i.e., the act of user broadcasting their activity to multiple OSNs near-simultaneously), a previouslyunstudied behaviour and demonstrate how certain OSNs play the roles of originating source and destination sinks. Keywords—Online Social Networks, cross-sharing, user behaviour
I.
I NTRODUCTION
Reading and posting from social networks has become a staple part of daily activities for many. The Pew Internet Project’s January 2014 research reported that 74% of online adults use social networking sites1 . More recently, the Global Web Index’s January 2015 Social Report monitored engagement with close to 50 online social networks (OSN) observed an average of 5.54 social media accounts per user, with 2.82 being used actively2 . Even with so many social network activity and the wide variety of networks, the published literature reports little about their usage. We know precious little about what users actually do on OSNs, aside from our own individual use. Even less is known about how individuals interact across multiple OSNs. Many functionalities across networks are similar. So why do people find themselves using more than one? Are what individuals do on one network the same as their behavior on another? Does participation in one network impact their activity on another? These questions are important, but yet remain unaddressed by existing literature. With many of today’s users being engaged on multiple platforms, do studies limited to individual social network platforms provide a good picture of user behaviour in general? To date, there has not been a definitive answer to this question. The above are all questions about single networks, but users can use several OSNs simultaneously. One artifact of this is cross-network sharing (akin cross-posting in mailing lists) – when people post about their activities on more than 1 http://www.pewinternet.org/fact-sheets/social-networking-fact-sheet/ 2 http://www.globalwebindex.net/blog/internet-users-have-average-of-5social-media-accounts
one network. To our knowledge, why and how do people do such cross-sharing has not previously been investigated. We aim to address both issues of multi- and cross-OSN behavior in part in this work. We present an exploratory usercentric study on a large sample of users that participate in multiple OSNs. In particular, we analyse over 15,000 individuals that participate and link their accounts on six platforms – Flickr, Google+, Instagram, Tumblr, Twitter, and YouTube – through their publicly-available profile descriptions and public sharing activity on these networks. Through our study of this dataset on macro-, meso- and micro-scale analyses, we conclude that single network analyses is limited and does not yield representative holistic patterns. Even though we only study public data, we find support for the claim that each network is different and has a particular social networking niche to fill. We first review related work in Section II and then describe our dataset in detail in Section III. We then analyse user profiles, posting time, post topic and professions with respect to multiple networks in Section IV. Finally, in Section V we turn to cross-network interactions, discovering a clear topology of source and sink network relationships among public OSNs. II.
R ELATED W ORK
Structure, content and user behavior are three major aspects that can be said to characterize research on social networks. Leveraging the user relationship graph, early studies [1], [2] investigated the structural properties among networks such as Flickr, YouTube and Myspace. They confirmed several empirical observations true of other netowkrs: that they follow a power law distribution and exhibit both small-world and scale-free properties. More recent work examined how the user generated content can be leveraged for knowledge discovery and by examining networks over time, topic evolution. For example, Althoff et al. presented a comprehensive study about the evolution of topics across three online media streams [3]. The third aspect, user behavior, plays a key role. Understanding user behavior is a key modeling problem as it affects the social network structure as well as attempts to best model users themselves. For example, Lerman et al. conducted empirical analyses of user activities on Digg and Twitter to assess how it affected dissemination patterns [4]. Other user activities, such as social connection [5], content generation [6], participation in conversation [7], have also been studied to gain better understanding of OSNs.
However, a major shortcoming of these works is that they are limited to macroscopic analyses from a network (graph) perspective. Most works have neglected any analysis of micro(individuals) or meso- (small aggregrates) levels. In contrast, we perform a user-centric analysis: following the same users across their multiple social networks to uncover how and why users participate in and interact among their multiple social networks. To understand how user interact with multiple OSNs, early studies exploited user clickstream data from passively monitored network traffic [8] or a social network aggregator [9]. However, clickstream data is difficult to obtain for crossnetwork analysis due to privacy reasons, rendering such techniques difficult to execute in practice. While user generated content in part overcomes these problems (unlike web search history, user generated content in OSNs is often created by users voluntarily and for public consumption, alleviating privacy concerns), the additional problem of user linkage needs to be solved. Automated user linkage aims to link user accounts among different social networks that belong to the same person in the real world [10], [11]. Given the associated user accounts and collected usergenerated content (UGC) among different networks, works can then address the subsequent analysis and build downstream application. For example, Kumar et al. introduced a pioneer analysis work on users’ migration patterns across seven OSNs, which provides guidelines to prevent or encourage social media traffic [12]. Chen et al. examined the extent of personal information revealed by users across multiple OSNs, and found the amount of revealed information in profile is correlated with occupations and the use of pseudonyms [13]. There are relatively few studies on cross-posting. Many OSNs provide a cross-site linking functionality – linking two accounts on different platforms so that information can be (automatically) shared between them. This is often a mandatory step for users to perform cross-posting. Chen et al., using a data-driven approach, investigated how users cross-linked their Foursquare accounts to other OSNs, namely Facebook and Twitter [14]. Most relevant to cross-posting is work by Ottoni et al. [15]. They studied the correspondence and discrepancy in user activities across Twitter and Pinterest. Their key findings are that 1) users often generate content on Pinterest and then share them to Twitter, and that 2) users exhibit more focused interests on Pinterest than Twitter. In contrast, our research is based on six OSNs that span a more diverse set of media, and correlates these with analyses from other perspectives (e.g., temporal, profession). III.
DATASET
A user-centric study of cross-OSN behavior requires a collective study of many individual users, each of whom use multiple OSNs. We purposefully sidestep the issue of user linkage to focus our attention on user behavior. We leverage an OSN aggregation service called About.me3 , which enables people to easily create a public online identity that unifies a self-described short biography with prominent 3 http://about.me/
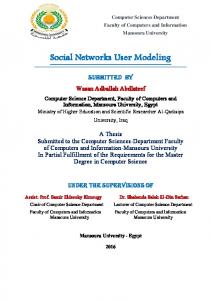
Fig. 1.
A sample About.me profile linking to 10 of the user’s websites.
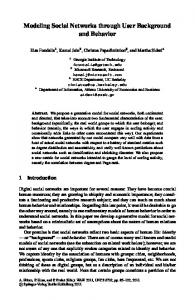
links to the person’s other OSN accounts and personal websites. According to web analytics provided by Alexa Internet4 , About.me is ranked as the 1,731th most popular website worldwide, which is more popular with female users, users completing graduate education, and with a worldwide user base with a prominent number of visitors in the U.S., India, Spain and Canada, among others. In our own informal analysis of About.me users, we find that they are often people who may benefit from having a stable, open, public and visual presence on the Web for professional reasons: creative, freelancing and marketing types are common job profiles of About.me users. While About.me users are clearly atypical Web users, they do represent an important subset of OSN users that use multiple OSNs and benefit from having a central point to aggregate their activities and give an overarching biographical sketch of themselves. We argue that such users are important to study as they represent key aggregators and disseminators of information on OSNs, by virtue of needing a service like About.me to manage their distributed activities and identity. Aside from solving the user linkage problem manually for us, About.me importantly 1) offers an application programming interface (API) and 2) ensures that the data captured by their site is publicly available, which are both considerations for programmatic and reproducible analyses. Using the About.me API, we collected a set of more than 180, 000 registered user profiles. Fig. 1 shows the profile of Jane Doe (not her real name), which links to her OSN accounts and websites (including Twitter, Linked.In and Wordpress). From the cumulative distribution of the number of linked OSN accounts per user, we see that the a slight majority of users list four or more accounts (Fig. 2(b), red line). We further limit the dataset used in this paper to users that link to certain OSNs meeting three criteria for inclusion. To ensure our results are representative, we limit our study to the twelve most frequently linked OSNs (Fig. 2(a)). We further require that the OSN expose most user information publicly through an API, so that we could retrieve user activity; and that the final OSNs chosen represent the breadth of media and functionality common in today’s Web 2.0 ecology. With these selection criteria, we selected the 15, 595 users that linked at least the average (n = 4, n ¯ = 3.7) number of OSNs from the set of six OSNs: Flickr, Google+, Instagram, Tumblr, Twitter and YouTube. Here, we note that Flickr, Instagram 4 http://www.alexa.com/siteinfo/about.me,
retrieved on 27 April 2015.
TABLE II.
% OF USERS OF ONE OSN WHO ALSO PARTICIPATE IN ANOTHER OSN IN OUR A BOUT. ME DATASET.
% of Twi % of G+ % of Ins % of Tum % of Fli % of YT
Twi – 96.4 96.7 96.0 96.0 95.5
G+ 79.4 – 76.8 74.9 74.8 84.1
also Ins 76.4 73.5 – 78.8 71.0 68.4
use Tum 65.2 61.7 68.5 – 60.1 56.6
Fli 64.4 61.0 60.4 59.4 – 60.9
YT 56.2 65.0 51.0 49.2 53.3 –
(a) # of users per OSN
(b) CDF of # of accounts per user Fig. 2.
# of About.me users linked to the 12 most frequently-linked OSN.
TABLE I.
D EMOGRAPHICS OF OUR COMPILED A BOUT. ME DATASET.
OSN Twitter (Twi) Google+ (G+) Instagram (Ins) Tumblr (Tum) Flickr (Fli) YouTube (YT)
# Users 15,103 12,445 11,922 10,259 10,139 8,883
Activity Type microblog post photo (upload) post photo (upload) feed (upload)
# Activities 43,042,857 2,522,873 1,054,047 8,171,592 11,266,954 180,618
and YouTube focus on photo and video sharing, Twitter and Tumblr are microblogging providers, and Google+ is a typical social networking site. To compile the dataset used in this study, we crawl each user’s publicly accessible activities via the respective APIs on 15 August 2013. Since all of the data we have obtained is public, and since we believe that the compiled dataset is a valuable resource for studying multiple OSN behavior, we have released our dataset for others to conduct further study5 . Table I gives statistics on the resultant dataset. A. Statistics We first calculate the degree of overlap of users of one OSN with the others in our dataset using Jaccard similarity (Table II). Our figures are largely consistent with the previous Pew Internet study that was performed over a global sample of online adults [16]. We see that Twitter has the largest overlap, followed by Google+, revealing their popularities among active social media users who interact with multiple OSNs. Among pairs, we see that YouTube shares 84.1% users with Google+, likely explained by their unique affiliation to Google and easy cross-sharing mechanism; and that overlaps between Instagram and Tumblr are also high (78.8% and 68.5%), which validates previous survey work [17] demonstrating that users prefer OSNs that better support visual media. Merely linking an OSN account does not necessarily imply that the user actively participates. To gain deeper insight, we 5 http://to.be.made.public/if
accepted.
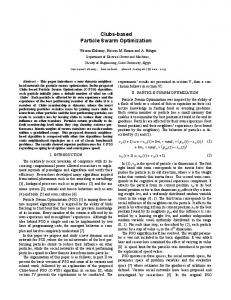
Fig. 3. Cumulative distribution of users’ average daily OSN visits (excluding zeros).
filter away dates where users did not use one of the examined OSN. We plot the average number of networks visited daily as a cumulative distribution function (Fig. 3), where a single user’s different days of use each contribute one data point. We see that involvement on multiple networks is quite common – ∼ 40% of all users in our dataset are active on any given day, interacting with an average of 1.5 networks. We further examine that on highly active days – e.g., the days with over 10 activities – the average number of networks utilized is also correspondingly larger (dashed line in Fig. 3). IV.
M ULTI - NETWORK PARTICIPATION A NALYSIS
Many online social network platforms have similar functions. Being able to follow individuals, post media and comment are pretty much ubiquitous activities that all OSN expose to users. Given this common functionality, why do users choose to use different OSNs? Is it due to their personal social networks (sharing things with different people who serve different social roles), or due to differences in functionality? Our dataset also records users’ self-reported profile description (on each network and About.me as well), in addition to historical activity logs of the users’ interaction with each OSN. These two data sources allows the analyses to be done on each source, which can be used to triangulate support for conclusions and yield complementary perspectives. Our results from both source corroborate that different OSN platforms are utilised differently, and serve distinct purposes collectively. A. User Profiles Online social networks often encourage users to maintain and complete their profiles, possibly to increase the user’s vested interest in using their network. These optional profiles are typically short sentences (e.g., a tagline) or paragraphs and are publicly accessible, making them a good source of free text demographic information. Here we seek to answer the question: How do profile descriptions differ across multiple OSNs?
TABLE III. U SER PROFILES FOR TWO USERS WHO PARTICIPATE IN ALL SIX OSN S . N OUNS USED IN SIMILARITY CALCULATION ARE BOLDED .
User 1 Twitter Google+ Instagram Tumblr Flickr YouTube
I’m a Digital Media Specialist passionate about self education, lifelong learning... Knowledge is freedom. I run a website called DIY Genius that helps young people self education. Explore Dream Create. I’m interested in digital media, adventure sports, and mountains. All my photographs are posted under the creative commons non commercial attribution... A collection of videos I’ve filmed on my iPhone while hiking skiing and biking in the mountains.
User 2 All 6 networks
Web Geek?, Senior Digital Strategist in Melbourne, social media maven, Google-aholic, simplicity and UX advocate...
common threshold for sentential similarity in prior work [18]. In fact, the majority users’ profile similarity score is lower than 0.15 (left labeled dot), indicating that most users describe themselves very differently across different OSNs. Our followup manual sample analysis confirms this hypothesis. We thus posit that social networks are distinct to users based on their functionality, and that the functional difference manifests itself in the users’ self-description in the user profiles. B. Post Time Being habitual beings, timing describes the way we behave in our daily lives: activities such as eating, sleeping and working. Correspondingly, post timing gives us a way to ascertain how users behave on each OSN. In this subsection, we analyse user behaviour by looking at temporal metadata of all posts shared by the user. We study a larger pool of 27K About.me users that provide their locale information, from which we are able to find out the local time of each post. For this section, we ansswer the question: How does user sharing behaviour vary with time? 1) Time of Day Analysis: To begin, we analyse the time of day users are most active in sharing content on social networks. We first divided the hours of a day into 8 intervals of 3 hours each and distinguishing between weekdays and weekends. For each user, we aggregate his/her sharing activity on each social network into a distribution over the 8 intervals. After summing and normalizing the distributions for all the users, we plot the resultant aggregated distributions as seen in Fig. 5
Fig. 4.
Cumulative user distribution for self-description similarity.
The user profile function is a common feature in OSNs, which is usually optional (as in the case of the studied six OSNs). We expect that some users reuse the same textual description over all of their OSN accounts. This is observed in our dataset (e.g., User 2) but actually make up a relatively small percentage of cases; of the users that filled all six OSNs profiles, 3% used the same descriptions throughout. More common were user profiles that hinted about the user’s identity with respect to the common functionality of the OSN. User 1 illustrates this case where each profile description is different, and customizes it towards the main functionality of the OSN; disclosing their job title in Google+ and Twitter, introducing personal interests in Tumblr, and summarizing their media contributions in Flickr and YouTube. To examine this issue further, we collected all users who had populated profiles in all six networks (inclusive of Users 1 and 2). We further filtered out users whose descriptions were too short (less than 5 words), to lessen the impact of word sparsity. On this final set of 190 users, we first preprocess their profile descriptions in each network by retaining only frequent non-stopword nouns (as bolded in Table III). We employ the standard Jaccard coefficient over the two sets of remaining single-word nouns from the pairs of the user’s profile descriptions, to calculate the average pairwise similarity of each user’s profiles. We plot the cumulative distribution of the average pairwise Jaccard profile description similarity in Fig. 4. We see most users have an average pairwise similarity significantly less than 0.5 (∼ 95%, top labeled dot), which is considered a
(a) Weekend
(b) Weekday Fig. 5. Distribution of user sharing activity over 24 hours for each social network
Macroscopically, the results show that activity across all
TABLE IV.
6 social networks follow a similar general trend. Low levels of activity are observed in the wee hours of the night, and higher levels of activity during the waking hours of the day and evening.
OF
Q\P Twi 0 0.0021 0.0340 0.0019 0.0164 0.0022
Twi G+ Ins Tum Fli YT
Taking a closer look, we notice that Google+ exhibits higher levels of activity during working hours (0900-1800) on weekdays, however, lower more evenly distributed levels of activity during and after working hours on weekends. Interestingly, Instagram shows an opposite trend, peaking in activity after working hours (> 1800) on weekdays, and showing a decline after working hours on weekends. This hints, albeit subtly, at the contrasting nature of these two social networks – Instagram is a platform more frequently used during non working hours, while Google+ during working hours. 2) Day of Week Analysis: We see a clearer duality between OSN’s usage during working times and non working times when we perform the same analysis over days of the week. Fig. 6 shows the distribution of sharing activity over days of the week and provides us with several key insights. Image based social networks (i.e., Flickr and Instagram) show a different trend throughout the week, peaking on the weekends, in comparison with the other video based, text and mixed media social networks that peak during the middle of the week - Wednesday. One possible reason for this is that posts to these social networks are in the form of images, and users are less likely to be able to take photos because of work on weekdays.
KL D IVERGENCE SCORES BETWEEN THE DISTRIBUTIONS OSN SHARING ACTIVITY OVER DAYS OF THE WEEK
TABLE V. Profession Marketing Expert
.
Producer Developer
G+ 0.0021 0 0.0217 0.0074 0.0073 0.0002
KL Divergence Scores Ins Tum 0.0365 0.0018 0.0226 0.0070 0 0.0505 0.0553 0 0.0132 0.0263 0.0244 0.0069
Fli 0.0172 0.0075 0.0131 0.0282 0 0.0069
YT 0.0023 0.0002 0.0233 0.0072 0.0067 0
P ROFESSION DESCRIPTION EXAMPLES .
Self-description I am making new improvements new innovative solutions and new marketing tactics for e commerce affiliate marketing and vertical e commerce in Turkey. I want to make e commerce pie bigger. Also I am making consulting for e commerce and dotcom projects. If I believe in something, I have to do it. I’m a Delhi based Electronic musician creative artist. I DJ produce minimal techno tracks as [...]. Also, I love robots. I’m a fifty something Scottish born software developer living in strand near cape town South Africa and working for [...] in Stellenbosch. I enjoy photography and am a committee member of [...] photographic society photography.
C. Profession As described in Section II, About.me is a platform for users to advertise themselves professionally. Leveraging on this, we seek to answer the following question: Do users favour certain social networks for sharing personal and work related content? The separation of work related and personal posts are user dependent, e.g., photography is one’s hobby but another’s profession. Therefore, to answer the above question accurately, we need to group users into professions. We created sets of keywords that are related to 10 professions by identifying possible terms that adequately describe each profession. Then we search users’ About.me profiles for these keywords and manually validate if each user to check if the keywords used are adequate in describing the profession. We prune and add more keywords and repeat this process until we are left with a set of keywords that we feel is suitable. These sets of keywords are used to select users for our profession group analysis.
Fig. 6. Distribution of user sharing activity over days of the week for each social network.
To quantify the temporal similarity of the social networks in sharing activity, we employ Kullback-Leibler (KL) divergence to measure the difference between their posting day-ofweek distribution. KL divergence is an asymmetric measure of difference between two probability distributions, defined by the information loss when using one distribution to approximate another: X P (i) Dkl (P ||Q) = P (i)ln (1) Q(i) i We chart a similarity matrix as seen in Fig. IV using scores derived from Equation 1 – KL divergence for discrete distributions. We note how dissimilar Instagram and Google+ are. Both of these networks are the extreme characterisations of the two general patterns of sharing behaviour OSNs observe over time: Most activity during the middle of the week, and contrastingly, most activity during weekends.
In Table V, we provide example self-description for three professions in About.me : Marketing Expert (e.g., Musician, Podcaster, Filmmaker), Producer, and Developer. We focus our analysis on these three types for two reasons: 1) They are typical three professions in About.me, and 2) they are easily distinguishable and thus help to simplify the identification and validation process. Once knowing a user’s profession, we then match his/her post’s topic with the profession, and thus determine the post to be work related or personal. To automate the process of inferencing topics from posts, we employ statistical topic modelling in the form of Latent Dirichlet Allocation (LDA) [19]. LDA models documents and their vocabulary in the same space, clustering similar documents and words together based on co-occurrence. Social Media posts being very short documents face the issue of insufficient verbosity for LDA to assign topics accurately. We tackle this issue by author-time pooling of posts as described in [20]: Instead of a post being a single document, we treat a document as a collection of posts that have been shared within a predefined time interval by the user. To construct our LDA model, we select a group
which social networks do they prefer? Fig. 8 shows that Google+ is consistently a popular choice amongst all three groups for sharing content related to work. YouTube is a video based OSN and is the primary choice for producer, as it is a suitable medium for them to distribute and publish their work.
Fig. 7. Percentage of users who frequently use social networks for professional use
Fig. 8.
User’s social network preference to share work related content
of 2000 random users and train our model on a collection of 1,441,987 author-time pooled documents from their posts from all 6 social networks, with a predefined number of topics set to 50 by experimentation. We label each cluster that our model finds with a topic (if the top keywords that describe the cluster is coherent, otherwise we do not.) Next, we associate relevant topics to their respective profession groups. We start our analysis by asking: For each profession group, what percentage of users frequently share information about their profession (at all)?. A user is considered someone who frequently shares information about their profession if at least one of the top 2 topics in any of the 6 social network matches that of the topics related to his or her job. Fig. 7 shows a chart for the percentage of users in all 3 interests groups that do recently share information about their profession. We start our analysis by asking: For each group, what percentage of users frequently share information about their profession (at all)?. A user is considered someone who frequently shares information about their profession if at least one of the top 2 topics in any of the 6 social network matches that of the topics related to his or her job. Fig. 7 shows a chart for the percentage of users in all 3 groups (of 100 randomly sampled users from each group) that frequently share content about their profession. Developers do not frequently use social networks for professional use as compared to the other two professions. This phenomenon may be explained by the fact that the other two professions have more reasons to use OSNs as means of reaching out to their target audience: producers of content may use OSNs to publish their works and likewise, marketing experts use them as means of promoting their cause. However, there is no reason for developers to do the same, hence a less sharing of work-related content is observed for them. A natural follow up question is For those users that do share content related to their profession on social networks,
For each profession, we investigate the most popular topics posted on each OSN for both hourly and daily intervals. We observe that the most popular topics that are posted to OSNs remain consistent over time (e.g. one instance of this observation is the most popular topic on Twitter for the Developer group is Technology for all days of the week) . This shows how each platform, to a user, has its own dedicated function and use i.e. a platform used mostly for work related purposes will unlikely be used for personal (non work related) use. Our analysis in this subsection concurs with results obtained from our temporal analysis. Google+ sharing activity reaches its peak during working days and similarly, is the network of choice for professions that do not deal with media (music, video, images). Also, Instagram consistently ranks one of the lowest for all 3 professions supporting our earlier postulation of it being a network for personal rather than professional use. We can conclude from our analysis that some OSNs are used more frequently for work related purposes, whereas others are preferred for personal use. V.
C ROSS - NETWORK I NTERACTION A NALYSIS
Informally, cross OSN sharing is when a user multicasts his activity over multiple networks. For example, photos shared from Instagram to Flickr are automatically tagged as ”uploaded:by=instagram”, indicating their originality. Like the Instagram/Flickr case, cross sharing often has a source OSN platform (shared from) and a sink (shared to). To examine this user behavior, we build timelines for each user’s activities and identify cross-sharing activities. An example timeline fragment of one user is shown in Table VI, where we observe cross-sharing. Cross-sharing can be enabled by third party software, which may broadcast the content simultaneously to target OSNs. We identify cross-shared (aggregate) activities as consecutive activities on different OSNs, where common timing and content define the bounds of the cross-shared activity (bolded instances in Table VI). In our dataset, we programmatically identified 111, 431 cross-sharing activities. Formally, we define cross-sharing as a 4-tuple: CS :=< U, P, N source , N sink > where U is the user identification, P is the post being crossshared, N source indicates the network where the post is originally created (or source), and N sink indicates the destination network (or sink). Note that we only assign source and sink roles only when evidence of the direction of sharing is present; e.g., Table VI’s the tweet’s inlined shortened URL resolves to Instagram, and the photo on Flickr contains machine generated tag “uploaded:by=instagram”. Given the identification of these cross-sharing activities, we characterize cross-sharing behavior in terms of platform considerations in the following.
TABLE VI.
A FRAGMENT OF A SAMPLE USER ’ S ACTIVITY TIMELINE , THAT ILLUSTRATES A CROSS - SHARED ACTIVITY ( BOLDED ).
Time 26/05/2013 18:36:46 27/05/2013 03:00:42 27/05/2013 03:00:44 27/05/2013 03:00:44 27/05/2013 21:02:02
Network Twitter Instagram Flickr Twitter Twitter
Content my poolside jam... http://t.co/f2480xhw5u I miss baby snuggles when the kids are away... :) I’m so blessed. #momlife I miss baby snuggles when the kids are away... :) I’m so blessed. #momlife I miss baby snuggles when the kids are away... :) I’m so blessed. #momlife @ home tweet home http://t.co/WioRNR6BjA you just never know who or what’s going to show up at a wedding ... ;)
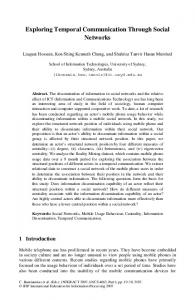
Fig. 9. Cross-sharing per OSN. (l) percentage of posts shared from an OSN; (r) percentage of all identified cross-shared activities in our dataset shared to a particular OSN.
We map the dissemination flow of user content in the six OSNs by aggregating the respective N source and N sink identities over all detected cross-sharing activities. Fig. 9 (left) shows the percentage of all posts in each OSN that is cross-shared to another OSN. Instagram and YouTube hold the highest shared from percentage and serve as the most significant source OSNs. We also plot (in Fig. 10) the CDF of users with respect to their cross-sharing ratio; i.e., the percentage of the user’s own content that are also disseminated to another OSN. Crosssharing turns out to be platform-sensitive. Instagram serves as a popular source; over 90% of Instagram users have shared their Instagram posts to another network. For Flickr and Google+, fewer than 20% of users took their original platform content and shared it to another OSN. We graph each platform’s share of all 111K+ identified cross-shared activities as a destination (sink) in Fig. 9(r). Twitter dominates, being the dominant destination for 54% of cross-sharing activities. We believe that OSNs examined play largely different roles in source/sink discrimination. Source and sink networks for cross-sharing activity are markedly different. Instagram user content originates from its mobile application that places sharing as a central theme, manifesting in the embedded “Share” button to route the post to various social media networks. As shown in Fig. 11, the central placement of the sharing functionality and its usability (dedicated buttons for different OSNs) drives the cross-sharing behavior we observe. This suggests that platform functionality strongly drives crosssharing. We examined the current (ca. April 2015) state of embedded cross-sharing options for each of the six networks, both in their website versions as well as mobile apps for the iOS and Android mobile platforms, presented in Table VII. We find that Instagram and YouTube support the most sharing destinations; Tumblr and Flickr support sharing to certain
Fig. 10. Cumulative distribution of users with respect to their percentage of cross-sharing activities.
Fig. 11.
Sharing functionality in the Instagram mobile application. TABLE VII.
Twitter Google+ Instagram Tumblr Flickr YouTube
C ROSS - SHARING SUPPORT BY PLATFORM .
Supported destination network – – Twitter, Flickr, Tumblr depends on the user’s personalized setting Twitter, Tumblr Twitter, Tumblr, Google+
sinks, while Twitter and Google+ do not support sharing. Aside from in-platform support, cross-sharing can be done through third-party plug-ins, (e.g., friendplus.me for Google+) or done by the user manually. Fig. 12 illustrates our understanding of the information flow among the networks examined, where the horizontal axis represents the tendency of a platform to serve as source or sink, and the vertical axis represents the level of explicit cross-sharing interaction. With some caveats, we see that OSNs that focus more on visual media tend to be sources, whereas platforms focusing textual media serve more as sinks. Tumblr, Flickr and Google+, positioned in the middle, play both roles. We make several additional observations surrounding cross-sharing source (source support). Although Instagram cut off its sharing to Google+ after being acquired by Facebook (April 2012), some of the About.me users in our dataset manually cross-share their Instagram photos to Google+. Also, while Google+ positions itself as a sink network, and does not support any cross-sharing, users have found means to do so through other workflows. We believe both source and sink characteristics have their roles within the OSN ecology: “Sourceness” acknowledges original content and possibly the value add of using a particular platform (artistic filters in Instagram may be an example), while “sinkness” promotes an aggregator effect that enables downstream analytics to gain more complete pictures.
[4]
[5]
[6]
[7]
[8]
Fig. 12. User generated content flow among OSN platforms. Content flows in the directions indicated by arrows and line thickness represents flow volume. Arrow color correspond to a specific OSN.
[9]
[10]
VI.
C ONCLUSION
We studied multiple online social networks (OSNs) from a user-centric perspective, with the aim of discovering behavioral patterns in their multiple network use. We analyzed how users participate and interact among six popular OSNs in our crawled dataset which we have made publicly available. Our study validates the hypothesis that users exhibit varied behavior on different OSNs, accounting in part for the OSN’s primary media type. In our multi-network analysis of single OSNs, we initially showed how the majority of users portray themselves differently across OSNs, suggesting differences in use. By examining users’ sharing activities, we uncovered a dichotomy between usage for professional and personal reasons. In our cross-network sharing analyses, we mapped how users post from one source network to a sink network. By plotting the source–sink directionality of cross-sharing, we labeled the media-centric OSNs of YouTube and Instagram to be sources, and the lowest common denominator Twitter OSN to be the common sink. Our study has examined the public face of OSNs, uncovering just the surface of the vibrant and varied ecology that is today’s social network. While our study covers a much larger scale than previous works that have largely confined themselves to the analyses of one or two individual network, a key limitation of our work is that we have only studied largely networks, and their user’s public sharing activities. In the future, we plan to harvest data from private social networks where possible, to further gain insight on the differentiation between public and private OSN use. We believe such work may benefit improve social media applications. R EFERENCES [1]
Y.-Y. Ahn, S. Han, H. Kwak, S. Moon, and H. Jeong, “Analysis of topological characteristics of huge online social networking services,” in Proceedings of International Conference on World Wide Web, 2007. [2] A. Mislove, M. Marcon, K. P. Gummadi, P. Druschel, and B. Bhattacharjee, “Measurement and analysis of online social networks,” in Proceedings of ACM SIGCOMM Conference on Internet Measurement, 2007. [3] T. Althoff, D. Borth, J. Hees, and A. Dengel, “Analysis and forecasting of trending topics in online media streams,” in Proceedings of ACM International Conference on Multimedia, 2013.
[11]
[12]
[13]
[14]
[15]
[16] [17]
[18]
[19] [20]
K. Lerman and R. Ghosh, “Information contagion: An empirical study of the spread of news on digg and twitter social networks,” in The International Conference on Weblogs and Social Media, 2010. J. Leskovec, L. Backstrom, R. Kumar, and A. Tomkins, “Microscopic evolution of social networks,” in Proceedings of ACM SIGKDD International Conference on Knowledge Discovery and Data Mining, 2008. L. Guo, E. Tan, S. Chen, X. Zhang, and Y. E. Zhao, “Analyzing patterns of user content generation in online social networks,” in Proceedings of the ACM SIGKDD International Conference on Knowledge Discovery and Data Mining, 2009. M. De Choudhury and H. Sundaram, “Why do we converse on social media?: an analysis of intrinsic and extrinsic network factors,” in Proceedings of ACM SIGMM International Workshop on Social Media, 2011. F. Schneider, A. Feldmann, B. Krishnamurthy, and W. Willinger, “Understanding online social network usage from a network perspective,” in Proceedings of ACM SIGCOMM Conference on Internet Measurement Conference, 2009. F. Benevenuto, T. Rodrigues, M. Cha, and V. Almeida, “Characterizing user behavior in online social networks,” in Proceedings of ACM SIGCOMM conference on Internet measurement conference, 2009. R. Zafarani and H. Liu, “Connecting users across social media sites: A behavioral-modeling approach,” in Proceedings of the 19th ACM SIGKDD International Conference on Knowledge Discovery and Data Mining, 2013. H. Zhang, M.-Y. Kan, Y. Liu, and S. Ma, “Online social network profile linkage,” in Proceedings of Asian Information Retrieval Symposium, 2014. S. Kumar, R. Zafarani, and H. Liu, “Understanding user migration patterns in social media.” in AAAI Conference on Artificial Intelligence. Citeseer, 2011. T. Chen, M. A. Kaafar, A. Friedman, and R. Boreli, “Is more always merrier?: A deep dive into online social footprints,” in Proceedings of the 2012 ACM Workshop on Online Social Networks, 2012. Y. Chen, C. Zhuang, Q. Cao, and P. Hui, “Understanding cross-site linking in online social networks,” in Proceedings of Workshop on Social Network Mining and Analysis, 2014. R. Ottoni, D. Las Casas, J. P. Pesce, W. Meira Jr, C. Wilson, A. Mislove, and V. Almeida, “Of pins and tweets: Investigating how users behave across image-and text-based social networks,” International AAAI Conference on Weblogs and Social Media, 2014. M. Duggan and A. Smith, “Social media update 2013,” Pew Research Center report, 2013. L. Rainie, J. Brenner, and K. Purcell, “Photos and videos as social currency online,” Pew Internet & American Life Project, September 2012. P. Achananuparp, X. Hu, and X. Shen, “The evaluation of sentence similarity measures,” in Proceedings of the 10th International Conference on Data Warehousing and Knowledge Discovery, 2008. D. M. Blei, A. Y. Ng, and M. I. Jordan, “Latent dirichlet allocation,” the Journal of machine Learning research, vol. 3, pp. 993–1022, 2003. R. Mehrotra, S. Sanner, W. Buntine, and L. Xie, “Improving lda topic models for microblogs via tweet pooling and automatic labeling,” in Proceedings of International ACM SIGIR Conference on Research and Development in Information Retrieval, 2013.