International Journal of Forecasting 26 (2010) 652–654 www.elsevier.com/locate/ijforecast
Discussion
Exponentially weighted methods for forecasting intraday time series with multiple seasonal cycles: Comments Haipeng Shen Department of Statistics and Operations Research, University of North Carolina at Chapel Hill, United States
First, Professor Taylor ought to be congratulated on another nice piece of work about exponential smoothing for intraday time series with multiple seasonal cycles. The methods discussed can be roughly grouped into two categories, depending on how one views the time series to be forecasted. Below I would like to briefly discuss the two perspectives, as well as some connection with functional data analysis and functional time series forecasting. Similar time series exist in multiple applications, including electricity demand and hospital emergency room patient arrivals, beside the call center volumes analyzed in the paper. A distinguishing feature of this type of data that needs to be incorporated by a successful forecaster is the multi-seasonality. For example, the call center arrival volume data contain both an intraday cycle and an intraweek cycle. A common way of analyzing such data is to view the data as a “long” univariate time series with double seasonality. This is the approach taken by the first four exponentially weighted methods of Taylor (2010), as well as the methods of Taylor (2008). Alternatively, one could view the basic cycle (i.e. each day) as the basic data unit, and split the univariate time series into daily segments. The sequence of E-mail address:
[email protected].
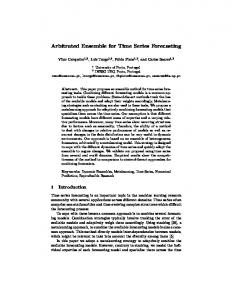
the resulting segments then forms a “fat” multivariate (or vector) time series. This formulation naturally separates the intraday cycle from the intraweek (or other longer) cycle, and allows one to model the intraday dependence and the interday (time series) dependence separately. This viewpoint connects nicely with the relatively new area of functional data analysis, which treats functions or curves as the basic data units and aims to understand the characteristics of populations of curves. (Ramsay & Silverman, 2005, offer a comprehensive survey of the related methodologies and applications.) As a visual illustration, Figs. 1 and 2 offer this multivariate (or functional) view of the data depicted in Figures 1 and 2 of Taylor (2010). In these figures, each curve plots the arrival volumes of the 48 half-hour intervals for one day, and different colors and line types are used to indicate the seven days of the week. Several insightful observations can already be drawn from this graphical view: (1) the intraday arrival patterns tend to be similar for the same weekday; (2) the patterns vary for different weekdays, and can be roughly grouped into four clusters: Monday, Tuesday–Friday, Saturday, and Sunday. Incidentally, these are the four clusters identified by Taylor (2010). (One can also treat Fridays as a fifth cluster. A formal statistical test for the significance of the clusters can be carried out using the
c 2010 International Institute of Forecasters. Published by Elsevier B.V. All rights reserved. 0169-2070/$ - see front matter doi:10.1016/j.ijforecast.2010.05.011
1000 0
500
Number of Calls
1500
2000
H. Shen / International Journal of Forecasting 26 (2010) 652–654
0
8
16
24
32
40
48
Half-hour Interval
1000
isting work such as that of Shen and Huang (2008) and Taylor (2010) performs dimension reduction and forecasting separately in two steps. First, the raw multivariate time series is approximated as a linear combination of a few basis vectors (obtained using PCA or SVD); then time series models are built on the basis coefficients for the purpose of forecasting. One interesting direction for future work would be to simultaneously achieve dimension reduction and parameter estimation of the time series models. Work which is currently in progress has shown that the unified approach can give more accurate estimates of the parameters of the time series models. Sometimes the vectors plotted in Figs. 1 and 2 are viewed as discretizations of some underlying curves (which are usually assumed to satisfy some smoothness conditions). One problem of interest is then to forecast a time series of (smooth) curves, or a functional time series. In this context, the dimensionality would be infinite as we are dealing with functions. One workhorse for dimension reduction in this case is functional principal component analysis, instead of standard PCA. FDA has traditionally focused on populations of independent curves, while functional time series involve dependent curves. Recently some progress has been made in forecasting functional time series. See, for example, Aneiros-P´erez and Vieu (2008), Goia, May, and Fusai (2010), Hyndman and Ullah (2007), Hyndman and Shang (2009) (with discussion), Mestekemper, Windmann, and Kauermann (2010), Shang and Hyndman (in press) and Shen (2009). However, more research is still needed in the modeling and forecasting of time series of curves.
0
500
Number of Calls
1500
2000
Fig. 1. Half-hourly arrivals at NHS Direct from Saturday 6 January 2007 to Friday 19 January 2007: Multivariate view of the data plotted in Figure 1 of Taylor (2010).
653
0
8
16
24 32 Half-hour Interval
40
48
Fig. 2. Half-hourly arrivals at NHS Direct for a 35-week period in 2007: Multivariate view of the data plotted in Figure 2 of Taylor (2010).
idea of random permutation and random relabeling of the weekdays.) However, it is technically challenging to forecast the multivariate time series directly, because its dimensionality can be large in practice (for example, 48 in the current example). Hence, principal component analysis (PCA) or singular value decomposition (SVD) is usually used for dimension reduction. Ex-
Acknowledgements I want to thank the editor-in-chief Rob Hyndman for the invitation to write this commentary. The research is partially supported by the United States National Science Foundation (NSF) grant CMMI0800575. References Aneiros-P´erez, G., & Vieu, P. (2008). Nonparametric time series prediction: a semi-functional partial linear modeling. Journal of Multivariate Analysis, 99, 834–857.
654
H. Shen / International Journal of Forecasting 26 (2010) 652–654
Goia, A., May, C., & Fusai, G. (2010). Functional clustering and linear regression for peak load forecasting. International Journal of Forecasting, 26, 700–711. Hyndman, R. J., & Shang, H. L. (2009). Forecasting functional time series (with discussion). Journal of the Korean Statistical Society, 38, 199–221. Hyndman, R. J., & Ullah, M. S. (2007). Robust forecasting of mortality and fertility rates: a functional data approach. Computational Statistics and Data Analysis, 51, 4942–4956. Mestekemper, T., Windmann, M., & Kauermann, G. (2010). Functional hourly forecasting of water temperature. International Journal of Forecasting, 26, 684–699. Ramsay, J. O., & Silverman, B. W. (2005). Functional data analysis (2nd ed.). New York: Springer.
Shang, H. L., & Hyndman, R. J. (in press). Nonparametric time series forecasting with dynamic updating. Mathematics and Computers in Simulation, in press. Shen, H. (2009). On modeling and forecasting time series of curves. Technometrics, 51, 227–238. Shen, H., & Huang, J. Z. (2008). Interday forecasting and intraday updating of call center arrivals. Manufacturing and Service Operations Management, 10, 391–410. Taylor, J. W. (2008). A comparison of univariate time series methods for forecasting intraday arrivals at a call center. Management Science, 54, 253–265. Taylor, J. W. (2010). Exponentially weighted methods for forecasting intraday time series with multiple seasonal cycles (with discussion). International Journal of Forecasting, 26, 627–646.