business process modeling diagram, namely the UML 2 activity diagram with a. UML profile, which allows to make this relationship explicit. The model is.
Extending UML 2 Activity Diagrams with Business Intelligence Objects* Veronika Stefanov, Beate List, Birgit Korherr Women’s Postgraduate College for Internet Technologies Institute of Software Technology and Interactive Systems Vienna University of Technology {lastname}@wit.tuwien.ac.at http://wit.tuwien.ac.at
Abstract. Data Warehouse (DWH) information is accessed by business processes. Today, no conceptual models exist that make the relationship between the DWH and the business processes transparent. In this paper, we extend a business process modeling diagram, namely the UML 2 activity diagram with a UML profile, which allows to make this relationship explicit. The model is tested with example business processes.
1
Introduction
A Data Warehouse (DWH) is more than just another big database. It is defined as “a subject-oriented, integrated, time-variant, nonvolatile collection of data in support of management’s decision-making process“ [7]. In modern organisations, DWHs play a crucial role, as more and more business processes require information from the DWH. A business process is “a group of tasks that together create a result of value to a customer” [6], and describes how work is done within an organization. When a person applies for a loan in a bank for example, the DWH is an integral part of the loan application business process. The applicant is scrutinized to find out if she or he has caused a financial loss previously, or has changed identity and caused damage under a different name. The business processes of designing new products in a telecommunication company or an airline, or composing the product range of a supermarket for example, requires comprehensive information on the customer behavior covered by the DWH. There are lots of examples showing how important DWHs have become for business processes. Surprisingly, this knowledge – how dynamic business structures interact with the DWH and how the DWH is being used in every day business life – is not made explicit in existing models. There is a need for an integrated model of processes and DWHs to make the relationship between the DWH and the business processes more transparent. To bridge this gap, we extend a business process modeling diagram, *
This research has been funded by the Austrian Federal Ministry for Education, Science, and Culture, and the European Social Fund (ESF) under grant 31.963/46-VII/9/2002.
namely the UML 2 activity diagram [12], with a UML profile for Business Intelligence (BI) Objects, to be able to create models that show • where and how business processes use a DWH environment, and • which parts of the business processes depend on which parts of the DWH. UML profiles provide an extension mechanism for building UML models for particular domains or purposes [12]. We utilize this extension mechanism, because the UML Profile for BI Objects provides the advantage that DWH people are able to view business process models and the interaction with a DWH in a well-known notation. In addition to the reuse of the UML notation, these models can be easily presented and edited with UML tools, as almost all UML tools support UML profiles. We use the term Business Intelligence (BI) instead of DWH, as it represents a broader approach to decision support data. We see BI as all kinds of applications and technologies for storing, analyzing, and accessing data to help enterprises to make better business decisions. BI objects cover a broad range of object types. We distinguish between data repositories (DWHs, data marts, or operational data stores), data objects representing data models of data repositories (entities or facts), and presentation objects representing tools (reports or analysis tools). These BI objects can be accessed by the activities of a business process, or in this case by the actions of the UML 2 activity diagram. The contribution of the UML profile for BI Objects is: • The model provides the bigger picture to DWH designers, as it shows how the DWH and other BI objects are accessed by business processes. • The model links static BI structures and dynamic business structures. • The UML Profile provides BI objects on different aggregation levels and thus enables the modeler to choose the right level of detail for different purposes or target audiences. The modeler may model a high level data repository access of a business process, e.g. the access of a data mart or DWH, or describe the access at a more detailed level, e.g. the access of a certain fact or entity. Furthermore, modelers may also show the access of an analysis tool. • The model can support the design phase of a BI project, by making it possible to describe the business requirements for the DWHs or data marts in a ‘to be business process model’. The DWH department can then prioritize the projects accordingly. • By relating DWHs or data marts to decisions in business processes, such a model can be used to justify the costs of BI projects. • The model can also be used to support estimates of the cost of usage, as well as for risk management: if the data quality in a certain area is bad, a data mart fails or data is corrupted, an integrated model enables better reactions because it is known which business processes will be affected. • Finally, the model also allows to discover parts of the DWH or data mart data model which are not accessed at all, permitting the DWH department to decide if these parts should be further maintained. Based on the meta-model in Section 2, we have developed a UML Profile for BI Objects extending UML 2 activity diagrams in Section 3. The UML profile is tested by example business processes in Section 4. Section 5 covers related work.
2
Meta-Model of Business Intelligence Objects
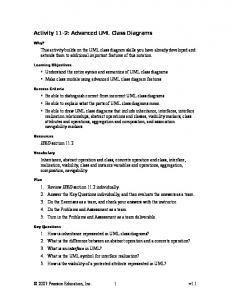
We extend the UML 2 activity diagram with a UML Profile for BI Objects to enable the creation of models that integrate information about where a business process makes use of data for decision support. These models make the otherwise hidden knowledge about the relationships between the business processes and BI explicit. This section describes the meta-model of BI Objects. What is a BI object? We have identified three main categories of BI objects: Data Repositories (representing the elements of the DWH architecture), Data Objects (representing the data model of a certain repository), and Presentation Objects (representing the means of presentation, either a static report or an interactive analysis). The relationships between the BI objects are shown in Fig. 1. BI objects chosen for a model depend on the target audience and the level of detail of the model. In an overview business process model suited for DWH managers, one might show the DWH or individual data marts as a whole. In a more detailed model for developers, sub-processes can be described as accessing individual entities and facts. Additionally, decision makers often receive relevant data in form of reports, for instance a report on sales data for the past fiscal year, which may also be relevant for business process modeling.
Fig. 1 Meta-Model of Business Intelligence Objects
2.1 Data Repositories Data Repositories are the first type of BI object that can be modeled in relation to a business process. They basically represent different types of databases as used in DWH settings. The types of data repositories occurring in a given situation depend on the DWH architecture in an organization. Also, several different data repositories may exist in parallel. Our approach is not limited to any specific DWH architecture, but can be applied to a wide selection of architecture types. In order to allow the greatest possible flexibility and provide meaningful content in the models, we have
identified three basic types of data repositories: the Data Warehouse (DWH), the Data Mart and the Operational Data Store (ODS). Depending on the architecture, different combinations of BI data repositories may occur in an organization. In large multinational organizations it is not uncommon to have more than one DWH. Within an organization a large DWH often co-exists with smaller data marts, departmental subsets of a DWH focused on selected subjects [2]. The data mart might be based on the DWH, obtaining its data from there, and acting as a kind of materialized view on the DWH. In another case, each data mart may be created individually by a department without an underlying DWH. To make operations spanning several data marts possible, they may later be integrated into an organization-wide DWH. Also, there may be none, one or more ODS, located between the operational systems and the DWH [5]. Depending on the architecture, end user applications may query individual data marts and/or the DWH, or even access the data in the ODS directly.
2.2 Data Objects In order to provide a more detailed view on the data, we also want to model the individual data entities contained in the data repositories. These Data Objects are generally represented in conceptual data models. For example, if a business process needs data on the revenue of a certain product range, it can be modeled to access the corresponding data object directly. In BI settings, there are two common types of data models: entity-relationship (E/R) models [3] and multidimensional models [2][4][9]. Which model is used depends on the type of repository, the overall architecture, and the preferences of the designers. The data objects of an E/R model that can be accessed by an activity of a business process are Entities. In the case of the multidimensional model, they are Facts.
2.3 Presentation Objects In an organization employing BI techniques, there are usually tools and applications providing users with prepackaged information that has been compiled for them. We call these collections of information Presentation Objects, and have identified two different types: Report or Interactive Analysis. A report displays a predefined set of queries, for example a report on sales in the south region for the 4th quarter of 2004. The values contained in a report do not change over time. An interactive analysis is a tool, e.g. an OLAP tool. In this case, the queries or analysis operations are not predefined but can be chosen by the user. The values are regularly updated and can be used for continuous performance monitoring. In a business process model we can for instance show a certain report that is accessed by an activity.
3
The UML Profile for Business Intelligence Objects
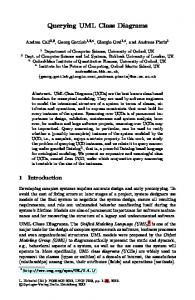
UML offers a possibility to extend and adapt its meta-model to a specific area of application through the creation of profiles. UML profiles are UML packages with the stereotype «profile». A profile can extend a meta-model or another profile [12] while preserving the syntax and semantic of existing UML elements. It adds elements which extend existing classes. UML profiles consist of stereotypes, constraints and tagged values. A stereotype is a model element defined by its name and by the base class(es) to which it is assigned. Base classes are usually meta-classes from the UML metamodel, for instance the meta-class «Class», but can also be stereotypes from another profile. A stereotype can have its own notation, e.g. a special icon. Constraints are applied to stereotypes in order to indicate restrictions. They specify pre- or post conditions, invariants, etc., and must comply with the restrictions of the base class [12]. Constraints can be expressed in any language, such as programming languages or natural language. We use the Object Constraint Language (OCL) [11] in our profile, as it is more precise than natural language or pseudocode, and widely used in UML profiles. Tagged values are additional meta-attributes assigned to a stereotype, specified as name-value pairs. They have a name and a type and can be used to attach arbitrary information to model elements. We extend the UML 2 activity diagram with a UML Profile for BI Objects, creating an integrated model of processes and BI objects to make the relationship between the DWH environment and the business processes more transparent. Activity diagrams are used in UML for modeling processes, workflows, and computations. In Fig. 2 we show a part of the UML 2 meta-model related to activity diagrams (light) to illustrate how the stereotypes we designed (dark) fit into to the existing meta-model.
Fig. 2 Extending the UML2 Meta-Model with Stereotypes for BI Objects In an UML 2 activity diagram, a single activity, representing a process or part of a process, is modeled. An activity may include any number of activity nodes, such as individual actions, control nodes (e.g. splits and joins), and object nodes. These nodes can be arranged to form sequential or concurrent processes, and several activity diagrams can be connected to describe larger processes.
In the UML Profile for BI Objects, we use the class Object Node as base class for all stereotypes. The OMG has defined an object node as an “activity node that indicates an instance of a particular classifier, possibly in a particular state, may be available at a particular point in the activity” [12]. Therefore, object nodes represent concrete instances of information objects, which are input or output parameters of an activity. They are suited for the purpose of showing when a (sub-)process accesses a BI object, as the BI objects amount to input parameters of activities. As described in the meta-model in Section 2, BI objects can be classified into three larger types. We therefore have defined three abstract top-level stereotypes, «DataRepository», «DataObject», and «PresentationObject». The stereotypes «DataWarehouse», «OperationalDataStore» and «DataMart» are derived from «DataRepository». Their specifications are listed in Table 1. The stereotype «DataObject» can be further specialized into «Fact» and «Entity», as shown in Table 2. Finally, the stereotypes «Report» and «InteractiveAnalysis» are specializations of «PresentationObject», as listed in Table 3. The semantics of the individual elements were described in greater detail in Section 2. Table 1. Data Repositories: Specification of Stereotypes Name Base Class Description
Constraints Tagged Values
Name Base Class Description
Tagged Values Constraints Name Base Class Description Tagged Values Constraints Name Base Class Description Tagged Values Constraints
DataRepository ObjectNode A data repository represents a type of database used in data warehouse environments. The stereotypes DataWarehouse, DataMart, and OperationalDataStore are derived from DataRepository. A DataRepository must be related to at least one DataObject: context DataRepository inv: Self.dataObject->size() >= 1 isMultidimensional • Type: UML::Datatypes::Boolean • Multiplicity: 1 • Description: Indicates whether the data model of the DataRepository is a multidimensional data model DataWarehouse Notation DataRepository A data warehouse is a subject-oriented, integrated, timevariant, nonvolatile collection of data in support of management’s decision-making process [7]. None None DataMart Notation DataRepository A data mart is a departmental subset of a DWH focused on a single subject area [2]. None None OperationalDataStore Notation DataRepository An operational data store is located between the operational systems and the DWH [5]. None None
Table 2. Data Objects: Specification of Stereotypes Name Base Class Description Tagged Values Constraints
Name Base Class Description Tagged Values
Constraints
Name Base Class Description Tagged Values Constraints
DataObject ObjectNode A data object is part of the data model contained in a data repository. The stereotypes Fact and Entity are derived from DataObject. None A DataObject must belong to exactly one DataRepository: context DataObject inv: self.dataRepository.size() = 1 The corresponding class must have at least one attribute: context DataObject inv: self.type.allAttributes()->size() >= 1 Notation Fact DataObject A fact is a data object of a multidimensional data model. None
The DataRepository containing a fact must have a multidimensional data model: context Fact inv: self.isType(Fact) implies self.dataRepository.isMultidimensional Notation Entity DataObject An entity is a data object of an E/R model. None The DataRepository containing an entity must not have a multidimensional data model: context Entity inv: self.isType(Entity) implies not self.dataRepository.isMultidimensional
Table 3. Presentation Objects: Specification of Stereotypes Name Base Class Description Tagged Values Constraints Name Base Class Description Tagged Values Constraints Name Base Class Description Tagged Values Constraints
PresentationObject ObjectNode A presentation object is a document or tool used to present information to a user. The stereotypes Report and InteractiveAnalysis are derived from PresentationObject. None A PresentationObject must have at least one DataObject: context PresentationObject inv: self.dataObject->size() >= 1 Report Notation PresentationObject A report displays a predefined set of queries. None None InteractiveAnalysis PresentationObject An interactive analysis is a tool that allows the user to freely explore information. None None
Notation
Name
4
Examples
We present three examples that demonstrate the application of the UML Profile for BI Objects developed in Section 3, each illustrating a different aspect. The first example introduces a simple UML 2 activity diagram with BI objects, the second example illustrates how UML «selection» notes can be used in combination with BI objects to provide more detail on data access, and the third example demonstrates how a more complicated business process can be modeled on a higher level of abstraction. The example activity diagram in Fig. 3 describes the well-known process of a passenger checking in at an airport. Two parties are involved in this activity, the passenger and the check-in desk. The process starts with the action “present documents”: the passenger presents the travel documents at the check-in desk. Two items, the ticket and the passport, are passed to the “check identity” action performed by the check-in desk. In order perform its task, the action also needs access not only to the two documents but also to the entity “reservation”. Therefore, it only starts if all three necessary inputs are available. After the identity check has concluded, the check-in desk decides on a possible upgrade. The action “decide on upgrade” needs data from the Customer Relationship Management (CRM) data mart. The data mart contains the frequent flyer status of the passenger in question. Data on the current flights situation, (e.g., whether another flight to the same destination is cancelled or overbooked, meaning that no upgrades are available) is provided by an interactive analysis tool. The “decide on upgrade” action therefore can only begin when the identity check has concluded and the two BI objects are available. It produces a boarding pass as output. The passenger can proceed to the gate as soon as he or she has received the boarding pass. Alternative paths, such as the identity check failing, were left out for sake of clarity of the example.
Fig. 3 Airport Check-In Business Process A large business process can be modeled by linking together several activity diagrams, each describing a small sub-process, such as the part of the process of designing and organizing a promotion of a single product (e.g. a 30 percent discount on a
brand of soap) shown in Fig. 4. In the initial step of choosing the product, a report on past promotions is analyzed in order to identify products suitable for a profitable promotion. Therefore, the action “analyze past promotions” has a set of products, e.g., those that seem promising, as output. In the following “choose product” action, a product is chosen based on how many items of the product were sold in the past (i.e. the sales information provided by the “Sales” fact) and whether enough items are on stock (i.e. inventory information from the ODS system). Only data on the products selected before should be read from the fact table and the ODS. In an activity diagram, a «selection» note attached to the object flow between an object node and an action can be used to specify selection behaviour. In the example presented here, the OCL statement checks whether a product in the BI object – the “Sales fact” or the ODS – is contained in the list of promising products.
Fig. 4 Product Promotion: The Sub-Process of Choosing the Product During a fraud detection process at an insurance company (Fig. 5), insurance claims are subjected to a three-step analysis, aimed at recognizing all potentially fraudulent claims before they might be processed and paid. The activity “fraud detection” is started by the arrival of an insurance claim. The claim is first exposed to an extensive automated check by the claim processing system. All claims judged as being suspicious are forwarded to the fraud detection department, whereas the others are processed normally. The suspicious claims are then reviewed. In this action the results of the automated check as well as the history of the customer and the insurance policy are analyzed, to identify patterns and/or similar cases. Therefore, the action needs access to two fact tables: “Customers” and “Policy Transactions”. The claims that continue to be suspect are then formally investigated, whereas the claims re-established as genuine are returned to the claim processing system. The action “formal investigation” represents a thorough search for further clues in order to provide answers to any open questions. As the queries necessary in this step are different in every case and cannot be predicted, the action requires the whole data warehouse of the insurance company as input. All claims finally identified as fraudulent are rejected.
Fig. 5 Fraud Detection Business Process
5
Related Work
There are a lot of conceptual modelling languages available for business processes or DWHs. But there are no models that focus on the relationship between these two domains. The conceptual DWH diagrams available for the different stages of the DWH process, e.g. for multidimensional models [10] or ETL processes [14], do not address the link to business processes at all. Business process diagrams that address the static structure of databases do not address the particularities of DWHs and BI. Event-Driven Process Chains (EPC) [8] incorporate a data view, targeting operational data bases. To provide the data view with a conceptual model, Chen’s entityrelationship (ER) model was adopted, since it was the most widespread model in the area of data modelling. Today, the UML class diagram is also used. EPC functions perform read or write operations on E/R entities or UML classes. The UML Profile for BI Objects is based on a similar concept, but accounts for the particularities of DWH settings. In UML 2 activity diagrams [12], data store nodes represent data. A UML 2 action node can perform read or write operations, comparable to the EPC function. The data store node is not necessarily linked with a UML class or database. The Business Process Modeling Notation (BPMN) [1] provides data objects, which are used and updated during the process. The data object can be used to represent many different types of objects, both electronic or physical.
6
Conclusion
In this work, we have addressed the missing link in conceptual modeling between the static structures of the DWH and the dynamic structures of business processes. To bridge this gap, we have extended the UML 2 activity diagram with a UML Profile
for Business Intelligence (BI) Objects. The model shows where and how business processes use a DWH environment, and which parts of the business processes depend on which parts of the DWH. The DWH environment is specified in terms of several types of BI objects, representing the different types of data repositories, their data models and the means of presentation. These BI objects can be accessed by actions of UML 2 activity diagrams. The profile was applied to several example processes.
References [1] Business Process Modeling Notation (BPMN), Specification BPMN 1.0 May 3, 2004, http://www.bpmn.org [2] S. Chaudhuri and U. Dayal, An Overview of Data Warehousing and OLAP Technology, ACM SIGMOD Record, v.26 n.1, p.65-74, March 1997. [3] P. Chen, The Entity-Relationship Model - Toward a Unified View of Data. ACM Trans. Database Syst. 1(1): 9-36, 1976. [4] M. Golfarelli, D. Maio, S. Rizzi, Conceptual Design of Data Warehouses from E/R Schema, Proceedings of the Thirty-First Annual Hawaii International Conference on System Sciences-Volume 7, p.334, January 06-09, 1998. [5] M. Golfarelli, S. Rizzi, I. Cella, Beyond Data Warehousing: What's next in business intelligence? In Proceedings 7th International Workshop on Data Warehousing and OLAP (DOLAP 2004), Washington DC, 2004. [6] M.Hammer, Beyond Reengineering - How the process-centered organization is changing our work and our lives. Harper Collins Publishers 1996. [7] W. H Inmon, R. D.Hackethorn, Using the Data Warehouse. New York: John Wiley & Sons, 1994. [8] G. Keller, M.Nüttgens, A.-W. Scheer, Semantische Prozeßmodellierung auf der Grundlage "Ereignisgesteuerter Prozeßketten (EPK)", In: Scheer, A.-W. (Hrsg.): Veröffentlichungen des Instituts für Wirtschaftsinformatik, Heft 89, Saarbrücken 1992. [9] R. Kimball and M. Ross, The Data Warehouse Toolkit: The Complete Guide to Dimensional Modeling, second ed., John Wiley & Sons, Inc., 2002. [10] S. Luján-Mora, J. Trujillo, I. Song, Extending UML for Multidimensional Modeling. 5th International Conference on the Unified Modeling Language (UML 2002), p. 290-304: LNCS 2460, Springer, Dresden, 2002. [11] Object Management Group, Inc.: UML 2.0 OCL Specification http://www.omg.org/docs/ptc/03-10-14.pdf (22/4/2005) [12] Object Management Group, Inc.: UML 2.0 Superstructure http://www.omg.org/cgi-bin/apps/doc?ptc/04-10-02.zip (22/4/2005). [13] J. Rumbaugh, I. Jacobson, G. Booch, The Unified Modeling Language Reference Manual, Second Edition, Addison-Wesley, 2004. [14] J. Trujillo, S. Luján-Mora, A UML Based Approach for Modeling ETL Processes in Data Warehouses, 22nd International Conference on Conceptual Modeling (ER 2003), p. 307-320: LNCS 2813, Springer, Chicago, 2003.