148
Central European Journal of Urology
UROLOGICAL ONCOLOGY
ORIGINAL PAPER
External validation of extended prostate biopsy nomogram Jan Hrbáček1, Ivo Minárik1, Tomáš Sieger2,3, Marek Babjuk1 Department of Urology, 2nd Faculty of Medicine and Motol University Hospital, Charles University Praha, Czech Republic Centre of Bioinformatics, 2nd Faculty of Medicine, Charles University Praha, Czech Republic 3 Department of Cybernetics, Faculty of Electrical Engineering, Czech Technical University in Praha, Czech Republic 1 2
Citation: Hrbáček J, Minárik I, Sieger T, Babjuk M. External validation of extended prostate biopsy nomogram. Cent European J Urol. 2015; 68: 148-152.
Article history Submitted: March 31, 2015 Accepted: April 8, 2015 Published on-line: May 18, 2015 Corresponding author Jan Hrbáček Department of Urology 2nd Faculty of Medicine and Motol University Hospital Praha V Úvalu 84 15006 Praha Czech Republic phone: +420 777 893 403
[email protected]
Introduction Historical nomograms for the prediction of cancer on prostate biopsy, developed in the sextant biopsy era are no more accurate today. The aim of this study was an independent external validation of a 10-core biopsy nomogram by Chun et al. (2007). Material and methods A total of 322 patients who presented for their initial biopsy in a tertiary care center and had all the necessary data available were included in the retrospective analysis. To validate the nomogram, receiver operator characteristic (ROC) curves and calibration plots were constructed. Results Area under the ROC curve calculated for our data using the nomogram was 0.773, similar to that reported originally. However, the nomogram systematically overestimated prostate cancer risk, which, for our data, could be resolved by subtracting 24 points from the total number of points of the nomogram. Conclusions The nomogram yielded overall good predictive accuracy as measured by the area under the ROC curve, but it systematically overestimated PC probability in individual patients. However, we showed how the nomogram could easily be adapted to our patient sample, resolving the bias issue.
Key Words: prostatic neoplasms ‹› prostate biopsy ‹› nomogram
INTRODUCTION Prostate cancer (PC) is the most common malignant tumour among European men (accounting for 22.2% of the total cancer incidence) and the third most frequent cause of cancer death (9.3% of all cancer deaths) [1]. A systematic 10-12 core transrectal ultrasound (TRUS)-guided prostate biopsy is a stateof-the-art tool for PC detection [2]. PC detection rate at the initial prostate biopsy (indicated on the basis of a suspicious digital rectal examination [DRE] result or for elevated prostate specific antigen [PSA] level) can be as high as 47% [3]. The procedure itself, however, has potential complications, the most important of which are urinary tract infections (including sepsis) [4]. Balancing the benefits of PC early detection against the risks inherent to this relatively invasive procedure represents one of the Cent European J Urol 2015; 68: 148-152
daily dilemmas in urological practice. In the past two decades nomograms have become available which help clinicians in their decision making, and their use has been recommended in an increasing number of clinical situations. Nomograms predicting the likelihood of a positive TRUS-biopsy result have been published since the early 1990´s. Most of them were derived from data of hundreds to thousands of patients using logistic regression models and artificial neural networks [5]. Many have not come into widespread use; exceptions to this rule include the nomogram of Karakiewicz et al. [6] which predicts the probability of a positive biopsy result taking into account a patient´s age, DRE result, PSA level and free/total PSA ratio (%fPSA) as predictors. External validation of the nomogram showed its predictive accuracy measured by the area under the receiver operator characteristic curve doi: 10.5173/ceju.2015.610
149
Central European Journal of Urology (AUC) of 0.77 [6]. Prostate Cancer Prevention Trial (PCPT) and European Randomized Study of Screening for Prostate Cancer (ERSPC) risk calculators are other predictive tools validated externally, these validations favoring either the former or the latter [7, 8]. When the sextant biopsy scheme for the detection of PC was abandoned in favor of extended biopsy schemes sampling 10 or more cores, risk assessment tools developed in the sextant biopsy era became less reliable. A new nomogram adapted to the extended biopsy template was created by Chun et al. [9], using the same variables as Karakiewicz et al. [6], but taking into account the number of cores sampled and the prostate size. These two variables were combined in the so-called sampling density (SD), defined as prostate volume in cm3 divided by the number of cores sampled. The aim of our study was an independent external validation of this 10-core biopsy nomogram for the use in our institution.
MATERIAL AND METHODS The study population originated from patients referred for TRUS-biopsy to the Department of Urology at Motol University Hospital in Prague, Czech Republic between March 2010 and May 2014. All patients included in the analysis underwent their initial biopsy based on a suspicious DRE and/or elevated PSA level. All biopsies were performed in a standardized fashion: at least 10 cores from the peripheral zone plus additional cores from the suspected areas on TRUS or DRE. Clinical and demographic data was extracted from a prospectively maintained patient database, and summarized using medians with the 1st and 3rd quartiles, means with range, and frequencies with percentages, as appropriate. Subjects with any of the nomogram-required parameters missing were excluded from analysis. To validate the original nomogram, receiver operator characteristic (ROC) and calibration plots (where the x-axis represents predicted probability of prostate cancer on biopsy and the y-axis represents true incidence of cancer on biopsy) were constructed on our patient population. Two nomograms were derived from the Chun work. Firstly, a formula to calculate the probability of PC (the numerical nomogram) was derived from the odds ratios (OR) of the multiple logistic regression model presented in Table 2 of the original study [9]. The coefficients related to individual clinical and demographic parameters were computed by taking the log of the presented OR´s. The absolute term needed to estimate the probability of PC could not be derived from Table 2 and was estimated (based on our patient dataset) to be -3.37. This estimate
was calculated using a logistic regression model of PC in our data set, in which all the parameters but the absolute term were fixed to the aforementioned values. This approach was justified by the fact that the coefficients related to individual parameters in the logistic model of Chun were mostly comparable to the coefficients estimated from our data (Table 2) for comparison purposes. The resulting formula was: probability of PC = expit (0.05 *age + 1.05 * DRE + 0.08 * PSA -0.06 * %fPSA -0.17 * SD -3.37 where expit(a) = exp(a) / (1+exp(a)). Table 1. Demographic and clinical data of our study population. Median values are presented for continuous variables, frequencies and percentages for categorical variables Total n=322
PC n=111
Benign n=211
Age (years, range)
64.6 (33-86)
65.0 (54-86)
64.5 (33-81)
PSA (ng/mL, Q1-Q3)
6.57 (4.6-9.6)
7.06 (4.9-11.1)
6.41 (4.5-9.0)
%fPSA (Q1-Q3)
16 (11.0-17)
12 (9-17)
17 (13-23)
Prostate volume (ml, Q1-Q3)
43 (30-59)
33 (25-45)
50 (33-65)
Number of cores (Q1-Q3)
12 (12-14)
12 (11-13)
12 (12-14)
Positive DRE (%)
116/322 (36.0)
62/111 (55.9)
54/211 (25.6)
Sampling density (Q1-Q3)
3.5 (2.4-4.7)
2.6 (2.0-3.8)
3.7 (2.6-4.9)
PSA – prostate specific antigen, %fPSA free/total PSA (%), Q1-Q3 1st and 3rd quartiles, DRE – digital rectal examination, PC – prostate cancer
Table 2. Comparison of the logistic regression model constructed by Chun (Table 2 in his work) and a model estimated on our data. Note that all the coefficients estimated on our data are covered by the Chun confidence intervals CI, with the exception of sampling density Chun et al. Predictor
Our study
OR (95% CI)
OR (95% CI)
Age
1.05 (1.03-1.07)
1.03 (1.00-1.07)
PSA
1.08 (1.04-1.11)
1.04 (1.00-1.09)
%fPSA
0.94 (0.92-0.96)
0.94 (0.90-0.98)
DRE+
2.87 (1.92-4.28)
3.47 (2.00-6.13)
Sampling density
0.84 (0.79-0.89)
0.63 (0.50-0.76)
PSA – prostate specific antigen, %fPSA free/total PSA, DRE – digital rectal examination, OR – odds ratio, CI – confidence interval
150
Central European Journal of Urology
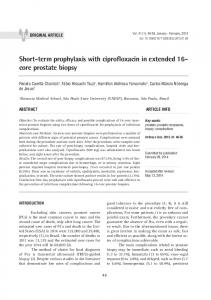
Figure 1A. Predicted and observed probability of prostate cancer in our patient sample using the numerical version of the nomogram by Chun et al. Point estimates of the probability of prostate cancer are given as triangles and supplemented with 95% confidence intervals based on the binomial distribution (vertical lines).
Figure 1B. Predicted and observed probability of prostate cancer in our patient sample using the graphical tool from the original article by Chun et al. Point estimates of the probability of prostate cancer are given as triangles and supplemented with 95% confidence intervals based on the binomial distribution (vertical lines).
Secondly, the nomogram parameters were estimated directly from Figure 2 of the original study [9] (the graphical nomogram). The number of points (top line) associated with unit change in each of the clinical and demographic parameters (lower lines) was estimated by dividing the difference in the number of points assigned to the extreme values of the variables by the difference in the extremes. The following values were obtained: 0.9167 for age (the difference between 95 and 35 years corresponding to 55 points), 16.3 for a positive DRE result, 1.53 for PSA level, -0.984 for %fPSA, and -3.125 for SD. Therefore, the total number of points could be expressed as
ing the value of 0.05 for age, 0.89 for a positive DRE, 0.08 for PSA, -0.05 for %fPSA, and -0.17 for SD.
total points = 0.9167*age + 16.3*DRE + 1.53*PSA - 0.984*%fPSA – 3.125*SD Finally, to transform the total number of points to the probability of PC, we estimated their relation from the graphical nomogram to be probability of PC = expit [(total points-206.7)/20] To compare the parameters of the numerical nomogram derived from Table 2 with those of the graphical nomogram derived from Figure 2 of the original study [9], we divided the latter by the value of 18.3, obtain-
RESULTS A total of 407 men underwent their initial TRUSbiopsy in the relevant period. After exclusion of subjects with missing data, 322 men were included in the final analysis. Their median age was 64.6 years and median PSA level 6.57 ng/mL; all demographic and clinical data are summarized in Table 1. Surprisingly, the relative influence of the individual clinical and demographic parameters in Chun numerical and graphical nomogram, respectively, differed. The latter coefficients, when scaled, were in good agreement with the coefficients derived from Table 2, except for the scaled coefficient of 0.89 related to DRE+, which was notably lower compared to the value of 1.05 derived from Table 2. Area under the ROC curve calculated by applying the Chun numerical (graphical) nomogram to our patient sample was 77.3% (76.7%). Calibration plots computed using the numerical formula and the graphical nomogram are shown in Figure 1A and 1B, respectively. An intriguing finding of our analysis was that the graphical nomogram (Figure 1A) systematically overestimated the prostate cancer risk. However, we could adapt the graphical
Central European Journal of Urology nomogram to yield correct PC risk estimates in our patients. We did so by subtracting the value of 24 points from the total points obtained from the graphical nomogram. (This estimate was based on our data set and calculated using a logistic regression model of PC, in which all the parameters, but the absolute term were fixed to the parameters of the graphical nomogram.) The numerical nomogram (Figure 1B) yielded unbiased probabilities of PC.
DISCUSSION The predictive accuracy (PA) of the nomogram by Chun et al. was already shown to be satisfying in their original article. When applied to three external validation populations from Hamburg (n = 582), Milan (n = 961) and Seattle (n = 195), the nomogram yielded predictive accuracies of 75.1%, 72.7% and 75.5%, respectively [9]. Its PA in our patient sample was 77.3% for the numerical formula, and 76.7% for the graphical nomogram. This further confirms predictive abilities of this tool developed for use in the extended (10 or more cores) prostate biopsy era. However, it should be noted that high nomogram PA (as measured in terms of the AUC) cannot guarantee that the nomogram would yield correct estimates of individual patient's probabilities of PC. Indeed, the calibration plots showed that the graphical nomogram of Chun systematically overestimated the predicted probability of PC (Figure 1B). This phenomenon, demonstrated also in Figure 3D,E of the Chun original work, would question the applicability of the nomogram to a general population of patients. To solve the problem of the systematic bias of the Chun graphical nomogram demonstrated on a data set other than one used to construct the nomogram, we showed how the nomogram could easily be adapted to fit another population of patients. We found that for our data set, this bias could be eliminated by subtracting 24 points from the total number of points calculated using the graphical nomogram. Our study has several limitations: 1) the exact offset value in the numerical nomogram of the original study was not known; therefore, an estimated value of 3.37 was used based on our patient data (we tried to learn the value contacting authors of the original article, but were left without response). 2) of the consecutive patients who presented for a biopsy in our institution, 85 (21%) were excluded because of missing data; preliminary statistical analysis revealed there was no systematic pattern in the missing data; hence, no selection bias has been introduced. 3) our patient cohort had some characteristics different from the population Chun et al. nomogram was constructed on: the number of cores sampled in our
151
patient population ranged between 10 and 20 and mean prostate volume was smaller than in the study by Chun et al.; hence, mean SD value was smaller than that of Chun´s; the rate of suspected DRE was also higher in our study (36% vs. 20%). On the other hand, if the nomogram performs well in a population not strictly analogous to the one it was designed on, it only affirms its robustness and utility. The issue of nomogram utility in general has two different aspects. Usefulness of any predictive tool depends on its PA (most important consideration), performance characteristics (PA in specific patient subgroups), generalisability (e.g., patients in the US may vary from those in Europe), and level of complexity (too complex models are impractical) [10]. Most of the nomograms in use were developed on retrospective data using logistic regression or recursive partitioning statistical models and their PA measured by the AUC ranges from 0.73 to 0.82 [5]. Some more recent tools were designed as artificial neural networks (ANN) with better PA ranging from 0.77 to 0.90 at the expense of larger model complexity [5]. Willingness of practitioners to use predictive tools represents the second aspect. In a national survey conducted in the United States (where decision making shared between patient and physician has a large tradition), 57% of urologists (out of 328 respondents) use prostate cancer nomograms in their practice [11]. Conversely, a negligible percentage of urology specialists do so in Central Europe (according to a quick survey among a national urologic society meeting, 23 Oct. 2014, unpublished data). There is evidence in the field of prostate cancer that nomograms outperform clinical judgement as well as evidence showing no benefit of nomogram use. PA of Slovin nomogram predicting one-year probability of bone metastases in patients after radical prostatectomy with a rising PSA was better than physicians´ predictions (81% vs. 63%) [12]. Conversely, clinician predictions of organ-confined disease were comparable to the nomogram in another report (AUC of 0.78 and 0.79, respectively) [13]. Future developments in the field of prostate imaging and biomarkers might completely change prostate biopsy strategies. Multiparametric magnetic resonance imaging (MRI) [14] together with MRI-ultrasound fusion techniques could potentially enhance or even replace template prostate biopsies in the future, but will not yet be available everywhere in the years to come. Novel biomarkers and their derivatives (PCA3, PHI) may be of help when deciding upon an indication for a biopsy [15, 16], but their benefit (given their market price) is far from proven. Implementation of the above mentioned methods into current nomograms
152
Central European Journal of Urology
may enhance their PA, but also nomograms might be outperformed in the future by completely different diagnostic approaches.
CONCLUSIONS Nomograms presented in Table 2 and Figure 2 of the original publication [9] are partially inconsistent. Both of them give good prediction accuracy as measured by ROC curves. The graphical nomogram overestimates PC probability in individual subjects of our patient population; the numerical nomogram, which had to be partially estimated on
our data, gives more precise estimates. We showed how the graphical nomogram could easily be adapted to give unbiased estimates of PC probability. For our patient population, subtracting 24 points resolved the bias of the graphical Chun nomogram. CONFLICTS OF INTEREST The authors declare no conflicts of interest.
ACKNOWLEDGEMENTS Supported by the project (Ministry of Health, Czech Republic) for conceptual development of research organization 00064203 (University Hospital Motol, Prague, Czech Republic).
References 1. Ferlay J, Parkin DM, Steliarova-Foucher E. Estimates of cancer incidence and mortality in Europe in 2008. Eur J Cancer. 2010; 46: 765–781. 2. Mottet N, Bastian PJ, Bellmunt J, et al. Guidelines on Prostate Cancer. European Association of Urology. 2014; http:// uroweb.org/wp-content/uploads/1607Prostate-Cancer_LRV3.pdf 3. Bhindi B, Mamdani M, Kulkarni GS, et al. Impact of the U.S. Preventive Services Task Force Recommendations Against PSA Screening on Prostate Biopsy and Cancer Detection Rates. J Urol. 2015; 193: 1519-1524. 4. Nam RK, Saskin R, Lee Y, et al. Increasing hospital admission rates for urological complications after transrectal ultrasound guided prostate biopsy. J Urol. 2013; suppl 1: S12–17. 5. Schröder F, Kattan MW. The comparability of models for predicting the risk of a positive prostate biopsy with prostatespecific antigen alone: a systematic review. Eur Urol. 2008; 54: 274–290. 6. Karakiewicz PI, Benayoun S, Kattan MW, et al. Development and validation of a nomogram predicting the outcome
of prostate biopsy based on patient age, digital rectal examination and serum prostate specific antigen. J Urol. 2005; 173: 1930–1934. 7. Cavadas V, Osorio L, Sabell F, Teves F, Branco F, Silva-Ramos M. Prostate cancer prevention trial and European randomized study of screening for prostate cancer risk calculators: a performance comparison in a contemporary screened cohort. Eur Urol. 2010; 58: 551–558. 8. Lundon DJ, Kelly BD, Foley R, et al. Prostate cancer risk assessment tools in an unscreened population. World J Urol. 2014; doi: 10.1007/s00345-014-1365-7 9. Chun FK-H, Briganti A, Graefen M, et al. Development and external validation of an extended 10-core biopsy nomogram. Eur Urol. 2007; 52: 436–444.
12. Kattan MW, Yu C, Stephenson AJ, Sartor O, Tombal B. Clinicians versus nomogram: predicting future technetium-99m bone scan positivity in patients with rising prostate-specific antigen after radical prostatectomy for prostate cancer. Urology. 2013; 81: 956–961. 13. Ross PL, Gerigk C, Gonen M, et al. Comparisons of nomograms and urologists’ predictions in prostate cancer. Semin Urol Oncol. 2002; 20: 82–88. 14. Kurhanewicz J, Vigneron D, Carroll P, Coakley F. Multiparametric magnetic resonance imaging in prostate cancer: present and future. Curr Opin Urol. 2008; 18: 71–77.
10. Chun FK-H, Karakiewicz PI, Briganti A, et al. Prostate cancer nomograms: an update. Eur Urol. 2006; 50: 914–926.
15. Salagierski M, Sosnowski M, Schalken JA. How accurate is our prediction of biopsy outcome? PCA3-based nomograms in personalized diagnosis of prostate cancer. Cent European J Urol. 2012; 65: 110–112.
11. Kim SP, Karnes RJ, Nguyen PL, et al. Clinical implementation of quality of life instruments and prediction tools for localized prostate cancer: results from a national survey of radiation oncologists and urologists. J Urol. 2013; 189: 2092–2098.
16. Perdona S, Bruzzese D, Ferro M, et al. Prostate health index (phi) and prostate cancer antigen 3 (PCA3) significantly improve diagnostic accuracy in patients undergoing prostate biopsy. Prostate. 2013; 73: 227–235.