Extracting and Displaying Temporal Entities from Historical Articles
Recommend Documents
answering and free-text criteria querying. ... Our goal in this paper is to develop automated approaches for extracting the ... Structure (TCS) 7, was proposed to represent temporal expression in discharge summaries. ... the attribute names as semant
This paper presents an approach for text processing of PDF documents with ... according to a set criterion, making also use of geometric-based regions in order ...
and Apple you may hardly find them in the state of the art knowledge networks such .... describes the entity, followed by a list of subtitles which ... Ceo, Founded*.
Jul 16, 2001 - ABSTRACT. Motivation: The DNA microarray technology can generate a large amount of data describing the time-course of gene expression.
[7] Q. Liu, C. Jung, and Y. Moon, âText segmentation based on stroke filterâ, In ... [11] K. C. Jung, J. H. Han, K. I. Kim, and S. H. Park, âSupport vector machines for ...
Key challenges in developing EE include domain-specific names, naming .... not be in the noun dictionary, but âSELLINGâ may be something that we are ...
School of Computer Science ... We describe a open-domain information extraction method ..... âAppleâ with its occurrence as a fruit and as a company con-.
Jul 13, 2015 - Indeed, biomedical documents contain highly domain-specific jargon and syntax. These documents also describe distinctive dependencies, ...
ontology.html. 4 http://fofoca.mitre.org/tern.html ... research/trips/lexicon/browse-ont-lex.html ... around hundred of hand-coded extraction patterns to extract.
Jun 2, 2012 - on Twitter [13]. They applied particle .... 2http://news.bbc.co.uk/2/hi/2059330.stm ... 3http://www.bbc.co.uk/news/world-asia-16901385 document ...
and event feature extraction system EVITA and showed that a linguistically motivated rule-based system, with some statistical guidance for disambiguation, ...
Jul 10, 2012 - build structured representations of sentences based on which ... tically or using machine learning based on features which refer to the contexts' ...
May 23, 2011 - (author of Moby Dick [2]). As appropriate as this name was, it quickly ran foul of the rules of zoological nomen- clature [3] because Leviathan ...
Oct 12, 2004 - School of Computer Science, University of Manchester, UK. School ... He received a normal saline bolus of 2 liters of good blood pres-.
Aug 14, 2007 - page URL (e.g., Wikipedia page describing Abraham. Lincoln is on. URL http://en.wikipedia.org/wiki/Abraham_lincoln). Once we have a ...
Aug 20, 2008 - Fenner F, Henderson DA, Arita I, Ladnyi ID: Smallpox and its eradica- ... 14. Riley S, Ferguson NM: Smallpox transmission and control: spa-.
models for their respective language stages, and historical grammar as a ... e-mail: [email protected] ... orthography, punctuation, and in a few cases some inflectional endings (e.g. whether ...... Oxford, UK and Cambridge, MA: Blackwell.
Padhraic Smyth1, and Mark Steyvers2. 1. Department of ... of emails, reports, technical papers, news articles, and wanting to quickly gain ... problems. Supervised learning techniques classify objects such as documents into ..... This material.
Mar 23, 2013 - treatment, test, evidence, or clinical department. This typification is embedded ... Admission and Discharge; (3) a non-local specialist to predict.
constant in area of interest; LSG the sun and sky glitter (light reflected to the sensor by the water surface); and LP AT H is the path radiance (light scattered to the ...
We describe FSS-TimEx, a module for the recognition and ... The FSS-TimEx (
Finite State-based Shallow Time. Extractor) ..... URL:http://nl.ijs.si/ME/V3/msd/html
/.
Feb 7, 2017 - ity two, except for the last two, which have arity one. clear indicates whether a tile is still ...... the TIS algorithm, reported in Section 9, in the Python language and ...... crosses the propositional and metric fluent spaces. 58 ..
of important events and displaying them on a timeline. Event and temporal .... A final list of features for classifying events as important or not. 6 Identifying ...
Extracting and Displaying Temporal Entities from Historical Articles Rachel Chasin1 , Daryl Woodward2 , and Jugal Kalita3 1
3
Department of Computer Science, Massachusetts Institute of Technology, Cambridge, MA, 02139 [email protected] 2 Department of Electrical and Computer Engineering, University of Colorado, Colorado Springs, CO 80918 [email protected] Department of Computer Science, University of Colorado, Colorado Springs, CO 80918 [email protected]
Abstract. Our goal is to extract and display temporal entities in textual documents. The task involves identification of all events in a document followed by identification of important events using a classifier. We present a user with the key events and their associated people, places, and organizations within a document in terms of a timeline and a map. For purposes of testing, we use historical Wikipedia articles, such as those describing wars, battles, and invasions. We focus on extracting major events from the articles, although our ideas and tools can be easily used with articles from other sources such as news articles. We use several existing tools such as Evita, Google Maps, publicly available implementations of SVM, HMM and CRF, and the MIT SIMILE Timeline.
1
Introduction
The amount of user-generated, unstructured content on the Internet increases significantly every day. Consequently, the need for techniques to automatically extract information from unstructured text is increasingly important. In this paper, we are interested in mining documents to identify important events mentioned in them along with named entities to which they are related, with a particular interest in geospatial entities. The focus of the paper is on extraction of important events and displaying them on a timeline. Event and temporal information extraction from plain text is a crucial task for natural language processing and knowledge management. Topic summarization must pick out the important events in one or more stories to yield the best summary with the least extraneous information. Question-answering tools must be able to answer queries about dates, durations, and even relative times (“When did the Civil War end?”, “How many years were between the Civil War and World War I?”). In addition, a significant number of queries on the Internet may also target other data in conjunction with event and temporal data. Extracting all of this information from text documents into a structured knowledge base or ontology enables these technologies and more.
Visualization of temporal information along with other relevant information in a concise form can offer a level of understanding not inherent in reading the text alone. Visualization is also ideal for users who need quick, summary information from an article without reading the whole thing. For the research reported in this paper, we work with historical Wikipedia articles because of the availability of high quality such articles in large numbers. Figure 1 shows a portion of a Wikipedia article that has been marked up for event references and named entities. Wikipedia is only one of many corpora that can be mined for knowledge that can be stored in machine-readable and program-usable form.
The Battle of Fredericksburg was fought , in and around Fredericksburg, Virginia, between General Robert E. Lee’s Confederate Army of Northern Virigina and the Union Army of the Potomac , commanded by Maj. Gen. Ambrose E. Burnside . Fig. 1. A Wikipedia article highlighted for event references and named entities
2
Related Research
Research on event extraction has often focused on identifying the most important events in a set of news stories [2], [22]. The advantage of this domain is that important information is usually repeated in multiple stories, allowing techniques like TF-IDF to be used. In Wikipedia, there is only one document per specific topic, and as a result, such methods cannot be used. There has also been research into classifying events into specific categories and determining their attributes and argument roles by [1]. Another issue that has been addressed is event coreference, determining which descriptions of events in a document refer to the same actual event. Software has been developed [23], [13] that identifies events and time expressions, and then generates relations among them. Most events are generally represented by nouns and verbs in the document. The relation identification usually uses a combination of rule-based components and classifiers. Auer and Lehmann demonstrated an efficient algorithm for categorizing articles and extracting information from Wikimedia templates [3]. The information they capture is useful for certain types of general queries, but we want to extract information at a level deeper than they attempted. Their work depends on the knowledge of Wikipedia templates and thus, cannot be used to extract information from free-flowing text. Mihalcea and Csomai developed a keyword extraction algorithm to identify important words from within a document and automatically link them to their respective Wikipedia pages [14]. Once again,
the scope of their work is more limited than ours, although the ideas reported in their work can be used for enhanced information display as well. There have a large number of other efforts at extracting relations from Wikipedia articles. A recent effort at developing a self-supervised system that learns 5020 relations with average F-1 score of 61% has been described in [10].
3
Outline of Our Work
The work reported in this paper is carried out in several phases as listed below. – – – –
Extract events from texts. Identify important events from among the events extracted. Extract temporal relations among identified important events. Create a display with a map and timeline showing relationships among important events.
We discuss each one of these topics in detail in the rest of the paper. Figure 2 shows the overall processing architecture and segments of the system, including the visualization website.
Fig. 2. Overall Architecture
4
Extracting Events from Texts
Being able to automatically identify events in a textual document requires a higher level of understanding of the document than simply identifying named
entities in the text. Identifying both events and named entities brings a deeper level of understanding of the text. The usual approach to identifying events in a text is by providing a set of relations along with associated patterns that produce their natural language realization, possibly in a domain dependent manner. For examples, [4,11,18] are able to provide answers to queries about individual facts or factoid questions using relation patterns. Others [9,16] take a deeper approach that converts both the query text and the text of candidates for answers into a logical form and then use an inference engine to choose the answer text from a set of candidates. Still others [24] use linguistic contexts to identify events to answer factoid questions. For non-factoid questions, where there are usually no unique answers and which may require dealing with several events, pattern matching does not work well [20, 21]. Evita [19] does not use any pre-defined patterns to identify the language of event occurrence. It is also not restricted to any domain. Evita combines linguistic and statistical knowledge for event recognition. It is able to identify grammatical information associated with an event-referring expression such as tense, aspect, polarity and modality. Linguistic knowledge is used to identify local contexts such as verbal phrases and to extract morphological information. The tool has a pre-processing stage and uses finite-state machine based and Bayesian-based techniques. We run the Evita program4 on the article, which labels all possible events in the TimeML format. EVITA recognizes events by first preprocessing the document to tag parts of speech and chunk it, then examining each verb, noun, and adjective for linguistic (using rules) or lexical (using statistical methods) properties that indicate it is an event. Instances of events also have more properties that help establish temporal relations in later processing steps; these properties include tense and modality. Evita also identifies the “class” of an event; the most common class is occurrence, but others include states and reporting events. For our purposes, occurrences will be the most important because events generally shown on timelines fall into this class. Event examples can be seen in Figures 3.
The Battle of Fredericksburg was fought e1 December 11-15, 1862, in and around Fredericksburg, Virginia, between General Robert E. Lee’s Confederate Army of Northern Virigina and the Union Army of the Potomac, commanded e2 by Maj. Gen. Ambrose E. Burnside. The Union army’s futile frontal assaults e3 on December 13 against entrenched Confederate defenders on the heights behind the city is remembered e4 as one of the most one-sided battles e5 of the American Civil War, with Union casualties more than twice as heavy as those suffered e6 by the Confederates. Fig. 3. Portion of an article with events tagged by EVITA (words followed by e i) 4
The entire TARSQI Toolkit is freely downloadable upon email request; see: http://timeml.org/site/tarsqi/toolkit/download.html
5
Identifying Important Events
We consider an event to be the sentence containing it. Each event/sentence is classified as important or not using a classifier trained with a set of mostly word-level and sentence-level features. Our classifier uses purely binary features, translating numerical into binary by considering thresholds. Many features have to do with the characteristics of the event word in the sentence (part of speech, grammatical aspect, distance from a named entity, etc.) or the word by itself (length). When there is more than one event word in a sentence, which is the unit to be classified, the sum, average, or maximum is taken over individual words. Some have to do with the sentence as a whole (presence of negation and presence of digits). The features can be seen in Table 1. The classifier also uses features related to the article as a whole - position of the sentence in the document, and similarity of the event word to article “keywords.” These keywords were taken as the first noun and verb or first two nouns of the first sentence of the article. These were chosen because the first sentence of these historical narratives often sums up the main idea and will often therefore contain important words (for example, “war”, “conflict”). An event word’s similarity to one of these words may having a bearing on its importance. The decision to use two keywords helps in case one of the words is not a good keyword, but only two are used because finding similarity to a keyword is expensive in time. Similarity is measured using the “vector pairs” measure from the WordNet::Similarity Perl module from [17], which compares the glosses of the words. Another feature is based on TextRank [15], an algorithm that ranks sentences based on importance and is used in text summarization. TextRank creates a weighted, undirected graph whose nodes are the document’s sentences. Edge weights between nodes are determined using a function of how similar the sentences are. After the graph is created, PageRank is run to rank the nodes by essentially how much weight points at them, directly or indirectly. Thus sentences that are in some way most similar to most other sentences get ranked highest. We have written our own implementation of TextRank with our own sentence similarity function. Our function automatically gave a weight of essentially 0 if either sentence was shorter than a certain threshold (we chose 10 words). For all others, it calculated the “edit distance” between the sentences, treating words (rather than characters) as the units to be compared and calling two words equal if their stems are equal. The similarity was then chosen as the sum of the sentence lengths divided by their edit distance. Named entities are also used in features. In addition to asking if the sentence contains one, some measure of the importance of the named entity is calculated and taken into account for the feature. This is done by counting the number of times the named entity is mentioned in the article. This total is then normalized for the number of named entities in the article.
Important Event Classifier Features Presence of an event in the perfective aspect % of events in the sentence with class “occurrence” Digit presence Maximum length of any event word in the sentence Sum of the Named Entity ‘weights’ in the sentence (NE weight being the number of times this NE was mentioned in the article divided by the number of all NE mentions in the article) Negation presence in the sentence Number of events in the sentence % of events in the sentence that are verbs Position of the sentence in the article normalized by the number of sentences in the article Maximum similarity (as previously described) of any event word in the sentence Percent of events in the sentence that are in some past tense TextRank rank of the sentence in the article, divided by the number of sentence in the article Number of “to be” verbs in the sentence Table 1. A final list of features for classifying events as important or not
6
Identifying Temporal Relations
We used two different ways to identify temporal relations among events in a document. The first approach used the TARSQI toolkit to identify temporal relations among events. The second approach was the development of a large number of regular expressions. The TARSQI Toolki (TTK) creates event-event and event-time links (TLINKs) after extracting time expressions. These include attributes like type of expression (DATE, TIME), value, and relation (like “before”, “during”). 6.1
Using Regular Expressions to Extract Occurrence Times
Our second approach applied regular expressions to extract times. The results of using extensive regular expressions versus using TTK showed that the regular expressions pull out many more (complete) dates and times. For example, in Figure 3, TTK only finds 1862, while the regular expressions would find a range from December 11 1862 to December 15 1862. Because of this, we decided to use our own program based in regular expressions rather than TTK. The regular expressions in our program are built from smaller ones representing months, years, seasons, and so on. We used 24 total combinations of smaller expresions, some of which recursively tested groups they matched for subexpressions. One example of an expression is: (early |late |mid-|mid |middle |the end of |the middle of |the beginning of |the start of )?(Winter|Spring|Summer|Fall|Autumn) (of )? (((([12][0-9])|([1-9])) [0-9][0-9])|(’?[0-9][0-9])) which finds expressions
like “[By] early fall 1862 [...]” a type of phrase that occurs in the corpus. A flaw present in our program and not in TTK is its ability to only pick out one time expression (point or interval) per sentence. This is consistent with our current
view of events as sentences, although it would arguably be better to duplicate the sentence’s presence on a timeline while capturing all time expressions present in it. To anchor time expressions to real times - specifically to a year - we have used a naive algorithm that chooses the previous anchored time’s year (plus or minus a year, chosen looking at difference in the month if given). In addition to the year, if the time needing to be anchored lacks more fields, we fill them with as many corresponding fields from the anchoring time as possible. Each time expression extracted is considered to have a beginning and an end, at the granularity of days (though we do extract times when present). The expression “December 7, 1941” would have the same start and end, while the expression “December 1941” would start on December 1 and end on December 31. Modifiers like “early” and “late” change this interval according to common sense; for example, “early December” corresponds to December 1 to December 9. Some expressions cannot be given a start or end point at all (ex. “The battle began at 6:00 AM” has no end). Any expression like this fills in its missing information from the interval corresponding to the entire event the article describes (for example, the Gulf War). This interval is considered as the first beginning and first ending time points that are anchored directly from the text, and is likely to be correct from empirical observations. It would likely, however, be better to instead follow the method we use for dealing with sentences with no times at all, described below. After initial extraction of time expressions and finding a tentative article span, we discard times that are far off from either end point, currently using 100 years as a cutoff margin. This helps avoid times that are obviously irrelevant to the event, as well as expressions that are not actually times but look like they could be (for example, “The bill was voted down 166-269” which looks like a year range). We also discard expressions with an earlier end date than start date. Despite the thoroughness of the patterns we look for in the text, the majority of sentences have no times at all. However, they may still be deemed important by the other part of our work, so must be able to be displayed on a timeline. Here we exploit the characteristic of historical descriptions that events are generally mentioned in the order in which they occurred. For a sentence with no explicit time expression, the closest (text-wise) sentence on either side that does have one is found, and the start times of those sentences are used as the start and end of the unknown sentence. There are often many unknown sentences in a row; each one’s position in this sequence is noted so that they can be plotted in this order within the interval they are assigned. Sometimes the start and end time we get in this manner are invalid because the end time is earlier than the start time. In this case, we look for the next possible end time. If nothing can be found, we use a default end point. This default end point is chosen as the last time in the middle N of the sorted times, where N is some fraction specified in the program (currently 1/3). We use times around the middle because events
tend to be sparse around the early or late times, as there are often just a few mentions of causes or effects of the article’s topic.
7
Extracting Named Geospatial and other Named Entities
We are interested in extracting NEs that coincide with the important events or sentences identified in the documents. We have tried three approaches to extracting geospatial named entities from the texts of documents. The first approach uses an SVM which is trained to extract geospatial named entities. The second approach uses an off-the-shelf HMM-based named entity recognizer. The third approach uses a CRF-based (Conditional Random Field) off-the-shelf named entity recognizer. A by-product of the second and third approaches is that we obtain non-geospatial named entities as well. The performance of each method can be found in Table 2. The numbers in the table represent the success of our system in geocoding extracted place names and resolving them to one singular geospatial entity. More details on these statistics and the performance of the actual named entity recognizers can be found in [25, 27, 28]. Table 2. Resolved Geospatial NE Results Precision SVM Resolved Results 0.869 HMM Results 0.878 CRF Results 0.954
Recall 0.789 0.734 0.695
F-Measure 0.820 0.796 0.791
In all cases, the extracted geospatial NEs are disambiguated and geocoded (often referred to as grounding), In conjunction with the work in the previous section, this allows important events to be located geospatially. 7.1
Grounding Geospatial Named Entities
Each of the three learning based methods extract a set of candidate geospatial NEs from the article text. For each candidate string, the second objective was to decide whether it was a geospatial NE, and to determine the correct (latitude, longitude), or (φ, λ) coordinate pair for the place name in context of the article, which is often referred to as grounding the named entity. To resolve the candidate NE, a lookup was made using Google Geocoder56 . If the entity reference resolved to a single geospatial location, no further action was required. Otherwise, the context of the place name in the article, a novel data 5 6
http://code.google.com/apis/maps/documentation/geocoding/index.html Google Geocoder was chosen because of accessibility and accuracy of the data, as this research does not focus on the creation of a geocoder.
structure and a rule-driven algorithm were used to decide the correct spatial location for the place name. Details on the location tree data structure used for disambiguation can be found in [27].
8 8.1
Experiments, Results and Analysis Extracting Important Events
We used supervised learning for extracting important events from the historical documents. For this purpose, we needed a set of hand-tagged articles indicating whether each event word identified by EVITA was part of an important event. If an event word was part of an important event, the sentence containing it was considered important because the word contributed to this importance. Because there is no good objective measure of importance, we asked multiple volunteers to tag the articles to avoid bias. The subjectivity was a real problem, however. The most basic guideline was to judge whether you would want the event on a timeline of the article. Other guidelines included to not tag it if it was more of a state than an action, and to tag all event words that referred to the same event. Each article was annotated by more than one person so that disagreements could be resolved using a majority vote. Thirteen articles were annotated in total and the breakdown of numbers of annotators was: 1 article annotated by 5 people, 4 articles annotated by 4 people, 6 articles annotated by 3 people, and 2 articles annotated by 2 people. If we take one annotator’s tagging as ground truth and measure every other annotator’s accuracy against that, the average inter-annotator F1-score comes out as 42.6%, indicating great disagreement. Using an alternative approach, we labeled a sentence as important for the classifier if either (1) some event in the sentence was marked important by every annotator, or (2) at least half of the events in the sentence were marked important by at least half of the annotators. Using this criteria, over the 13 articles 696 sentences were labeled important and 1823 unimportant. The average F1-score between annotators for this new method rose to 66.8% (lowest being 47.7% and highest being 78.5%). We trained a binary SVM using a radial basis function kernel using the LIBSVM software [5]. SVMs were trained and tested on the 2519 sentences using 10-fold cross-validation. To determine the best SVM model, the parameter space was partially searched for the ratio of the cost of missing positive examples to that of missing negative examples (c), the parameter gamma of the radial basis kernel function (g), and the weight ratio of cost for missing positive examples to cost for missing negative examples (w). For any given choice of c, g, and w, an SVM was trained on each cross-validation training set and tested on the corresponding test set, using LIBSVM. The resulting F-scores were averaged over the different sets and recorded. The best results were at 51.0% F-score and came from a few different choices of parameters. The set c=1.0, g=0.125, w=3 was chosen and the final model was trained with those parameters on the entire data set.
8.2
Experiments in Extracting Occurrence Times
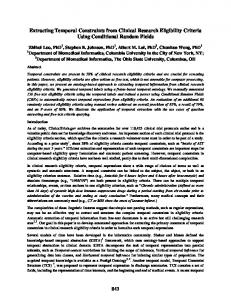
Testing the times is significantly more difficult, since the intervals generated by this program are certainly different than the ones intended by the article and representing events with times is difficult even for human annotators. Instead, we will use a measure proposed by [13] that they term “Temporal Entropy” (TE). This indirectly measures how large the intervals generated are, smaller, and therefore better, ones yielding smaller TE. Different Wikipedia articles have different spans and time granularities, and therefore TE varies greatly among them. For example, a war is usually measured in years while a battle is measured in days. An event whose interval spans a few months in a war article should not be penalized the way that span should be in a battle article. The range of temporal entropies obtained is shown in Figure 4. It is also necessary to normalize the TE. To do this, we divide the length of the event’s interval in seconds by the length in days of the unit that is found for display on the timeline as described in the visualization section. The TE from these results is primarily between 5 and 15, with 1400 sentences that had temporal expressions having TE in this range, and the majority of this close to 10. A TE of 10 represents an interval that was about 0.25 of the unit used to measure the article - for example, for a battle article measured in weeks, an interval with 10 TE would span about 2 days.
Fig. 4. Temporal Entropy graph - the temporal entropies were sorted in increasing order for plotting. Temporal entropy is in log(seconds/days)
Temporal entropy does not give all the information, however. Spot-checking of articles reveals that many events - particularly those whose times were estimated - are not in the correct interval at all. An example of this error can be seen in the USS Liberty article. This article’s span was found to be the one day June 8, 1967. Regular expressions on the sentence “She was acquired by the United States Navy ... and began her first deployment in 1965, to waters off the west coast of Africa.” find ‘began’ and ‘1965’ and it is concluded that this event starts in 1965 and ends at the end of the whole event, in 1967. This is incorrect. Similar examples succeed, however, as in the Battle of Gettsyburg article: “The two armies began to collide at Gettysburg on July 1, 1863, as Lee urgently concentrated his forces there” is given date July 1, 1863, and the next sentence with a time expression “On the third day of battle, July 3, fighting resumed on Culps Hill,...” uses 1863 as a year.
9
Visualization
An objective of this paper is the visualization of this structured data from the text. We created a bifurcated GUI that provides the visualizations for the geospatial and event/temporal information. We generate a combination map and timeline using the Google Maps API7 and the MIT SIMILE Timeline8 . The map interface provides a clickable list of events on the right, with an associated map of the events. Clicking on a location on the map or in the sidebar shows an infobox on the map that provides more details about the location, including the sentence in which it appears. Figure 5 shows this interface. The second part of the interface is a timeline with short summaries of the important events. Clicking on any of the events brings up an infobox with a more detailed description of the event, shown in Figure 6. 9.1
Timeline Hot Zones
Key to the timeline visualization is the concept of “hot zones” on the timeline, or clusters of important events on the timeline. An example set of hot zones is shown in Figure 7. To generate the endpoints for more than one hot zone, we sort the times for an article and examine the time differences (in days) between consecutive times. Long stretches of low differences indicate dense time intervals, indicating a hot zone. It is not necessary for the differences to be zero, just low, so a measure was needed for how low was acceptable. We chose to remove outliers from the list of time differences and then take the average of the new list. To remove outliers, we proceed in a common manner and calculate the first and third quartiles (Q1 and Q3) and then remove values greater than Q3 + 3 ∗ (Q3 − Q1) or less than Q1 − 3 ∗ (Q3 − Q1). The latter quantity was usually zero, so this ended up removing high outliers. This average was the threshold below which 7 8
Fig. 6. Event infobox in the visualization, after clicking “Richmond, VA, USA”
a difference was called low. We also ensured that too many hot zones were not generated, so we chose a threshold for the number of consecutive differences that
had to be low for the interval to be a hot zones; we chose a threshold of 10, based on what was would be appropriate for the dates in the majority of articles we processed.
Fig. 7. Timeline for Mexican-American War, containing 3 hot zones
10
Conclusions and Future Work
In this paper, we have presented details of a system that puts together many tools and approaches to produce a working system that is useful and interesting. Of course, the work presented here can be improved in many ways. Already, we are in the middle of hand-tagging 100+ historical articles over different time periods and geographic areas. We have chosen these articles from the list of battles on Wikipedia9 . The performance of the important event classifier could be improved upon in the future. We want to investigate into the domain portability of the temporal relation extraction module. Further, due to the algorithms for anchoring times to years and for giving times to sentences without them, errors tend to build up and carry over; some kind of check or reset condition would help accuracy. It is necessary to see how such creep-up of errors can be reduced. Although they work well, most of the algorithms we used here are naive and do not make use of existing tools. Some of these tools are sophisticated and theoretically motivated; hence, being able to use them may be worthwhile. The visualization could also be improved with changes to SIMILE’s code for displaying a timeline, particularly the width of the timeline, which does not automatically adjust for more events. Another improvement would be to create event titles that better identify the events since they are currently just the beginnings of the sentences. Finally, more features could be added to the visualization, especially in terms of filtering by time or location range. 9
http://en.wikipedia.org/wiki/List of battles
Acknowledgement The work reported in this paper has been partially supported by NSF grant ARRA: 0851783. Rachel Chasin was supported by this grant during the Summer of 2010. Daryl Woodward has been supported by this grant during 2009-11.
References 1. David Ahn. The stages of event extraction. In Proceedings of the Workshop on Annotating and Reasoning about Time and Events, pages 1–8, Sydney, Australia, July 2006. Association for Computational Linguistics. 2. James F. Allen. Maintaining knowledge about temporal intervals. Commun. ACM, 26(11):832–843, November 1983. 3. S¨ oren Auer and Jens Lehmann. What have innsbruck and leipzig in common? extracting semantics from wiki content. In ESWC ’07: Proceedings of the 4th European conference on The Semantic Web, pages 503–517, Berlin, Heidelberg, 2007. Springer-Verlag. 4. E. Brill, S. Dumais, and M. Banko. An analysis of the AskMSR question-answering system. In Proceedings of the ACL-02 conference on Empirical methods in natural language processing-Volume 10, pages 257–264. Association for Computational Linguistics, 2002. 5. Chih-Chung Chang and Chih-Jen Lin. LIBSVM: a library for support vector machines, 2001. Software available at http://www.csie.ntu.edu.tw/∼cjlin/libsvm. 6. S. Cucerzan. Large-scale named entity disambiguation based on Wikipedia data. EMNLP, 2007. 7. Jenny Rose Finkel, Trond Grenager, and Christopher Manning. Incorporating nonlocal information into information extraction systems by gibbs sampling. In ACL ’05: Proceedings of the 43rd Annual Meeting on Association for Computational Linguistics, pages 363–370, Morristown, NJ, USA, 2005. Association for Computational Linguistics. 8. Mona Habib. Improving scalability of support vector machines for biomedical named entity recogntion. Ph.D. Dissertation, CS Department, UCCS, 2008. 9. S. Harabagiu, D. Moldovan, C. Clark, M. Bowden, J. Williams, and J. Bensley. Answer mining by combining extraction techniques with abductive reasoning. In Proceedings of The Twelfth Text Retrieval Conference (TREC 2003), volume 9, 2002. 10. R. Hoffmann, Zhang C., and D.S. Weld. Extracting 5000 Relation Extractors. In Proceedings of the 48th Annual Meeting of ACL, 2010. 11. E. Hovy, U. Hermjakob, and D. Ravichandran. A question/answer typology with surface text patterns. In Proceedings of the second international conference on Human Language Technology Research, page 251. Morgan Kaufmann Publishers Inc., 2002. 12. Dan Klein, Joseph Smarr, Huy Nguyen, and Christopher D. Manning. Named entity recognition with character-level models. In Proceedings of the seventh conference on Natural language learning at HLT-NAACL 2003, pages 180–183, Morristown, NJ, USA, 2003. Association for Computational Linguistics. 13. Xiao Ling and Daniel Weld. Temporal information extraction. In Proceedings of the Twenty-Fourth Conference on Artificial Intelligence (AAAI-10), Atlanta, GA, July 2010.
14. Rada Mihalcea and Andras Csomai. Wikify!: linking documents to encyclopedic knowledge. In CIKM ’07: Proceedings of the sixteenth ACM conference on Conference on information and knowledge management, pages 233–242, New York, NY, USA, 2007. ACM. 15. Rada Mihalcea and Paul Tarau. Textrank: Bringing order into texts. In Dekang Lin and Dekai Wu, editors, Proceedings of EMNLP 2004, pages 404–411, Barcelona, Spain, July 2004. Association for Computational Linguistics. 16. D. Moldovan, S. Harabagiu, R. Girju, P. Morarescu, F. Lacatusu, A. Novischi, A. Badulescu, and O. Bolohan. LCC tools for question answering. NIST SPECIAL PUBLICATION SP, pages 388–397, 2003. 17. Ted Pedersen, Siddharth Patwardhan, and Jason Michelizzi. Wordnet::similarity: measuring the relatedness of concepts. In HLT-NAACL ’04: Demonstration Papers at HLT-NAACL 2004 on XX, pages 38–41, Morristown, NJ, USA, 2004. Association for Computational Linguistics. 18. D. Ravichandran and E. Hovy. Learning surface text patterns for a question answering system. In Proceedings of the 40th Annual Meeting on Association for Computational Linguistics, pages 41–47. Association for Computational Linguistics, 2002. 19. Roser Sauri, Robert Knippen, Marc Verhagen, and James Pustejovsky. Evita: a robust event recognizer for qa systems. In Proceedings of the conference on Human Language Technology and Empirical Methods in Natural Language Processing, pages 700–707, Vancouver, British Columbia, Canada, October 2005. Association for Computational Linguistics. 20. S. Small, T. Liu, N. Shimizu, and T. Strzalkowski. HITIQA: an interactive question answering system a preliminary report. In Proceedings of the ACL 2003 workshop on Multilingual summarization and question answering-Volume 12, pages 46–53. Association for Computational Linguistics, 2003. 21. R. Soricut and E. Brill. Automatic question answering: Beyond the factoid. In Proceedings of HLT-NAACL, volume 5764, 2004. 22. Russell Swan and James Allan. Extracting significant time varying features from text. In CIKM ’99: Proceedings of the eighth international conference on Information and knowledge management, pages 38–45, New York, NY, USA, 1999. ACM. 23. Marc Verhagen and James Pustejovsky. Temporal processing with the tarsqi toolkit. In 22nd International Conference on on Computational Linguistics: Demonstration Papers, pages 189–192, Manchester, United Kingdom, August 2008. Association for Computational Linguistics. 24. E. Voorhees. Overview of TREC 2003. NIST SPECIAL PUBLICATION SP, pages 1–16, 2003. 25. J. Witmer and J. Kalita. Mining Wikipedia Article Clusters for Geospatial Entities and Relationships. AAAI Spr. Sym., 2009. 26. Jeremy Witmer. Mining wikipedia for geospatial entities and relationships. Master’s thesis, Department of Computer Science, University of Colorado, Colorado Springs, May 2009. 27. Jeremy Witmer and Jugal Kalita. Extracting geospatial entities from wikipedia. IEEE International Conference on Semantic Computing, pages 450–457, 2009. 28. D. Woodward, J. Witmer, and J. Kalita. A Comparison of Approaches for Geospatial Entity Extraction from Wikipedia. In IEEE Conference on Semantic Computing, 2010. 29. GuoDong Zhou and Jian Su. Named entity recognition using an HMM-based chunk tagger. In Proc. 40th Annual Meeting of the Association for Computational Linguistics (ACL 2002), 2002.