relevance is a contingent, psychological construct. The effects of the SDM ... Pathfinder networks, a key component in GSA, also highlight the role of explicit links in structuring ..... 3ftp://ftp.cogsci.princeton.edu/pub/wordnet/5papers.pdf ..... Fifteen different tourist sites are chosen from a tourist guide to form the mental map.
02
13/05/04
18:29
Page 27
Chapter 2
Extracting Salient Structures Art is the imposing of a pattern on experience, and our aesthetic enjoyment is recognition of the pattern. Alfred North Whitehead
Information overload becomes a common problem in the exponential growth of widely accessible information in modern society, and efficient information filtering and sharing facilities are needed to resolve it. Information visualization has the potential to help people find the information they need more effectively and intuitively. Information visualization has two fundamentally related aspects: (1) structural modeling, and (2) graphical representation. The purpose of structural modeling is to detect, extract, and simplify underlying relationships. These relationships form a structure that characterizes a collection of documents or other data sets. The following questions are typically answered by structural modeling: What is the basic structure of a complex network or a collection of documents? What are the mental models of a city or a zoo in different people’s minds? What is the structure of the literature of a subject domain? In contrast, the aim of the graphical representation is to transform an initial representation of a structure into a graphical one, so that the structure can be visually examined and interacted with. For example, a hierarchical structure can be displayed as a cone tree, or a hyperbolic graph. Although the second aspect normally concentrates on the representation of a given structure, the boundary between the two aspects is blurred, as many information visualization systems are capable of displaying the same structure in a number of ways. In fact, the phrase information visualization sometimes refers to the second aspect specifically. In this chapter, we focus on the first aspect of information visualization – structural modeling. Generalized similarity analysis (GSA), is introduced as a unifying framework, and as a starting point for us to interpret and evaluate visualization systems, and to understand the strengths of a particular technical solution. GSA provides a generic and extensible framework capable of accommodating the development of new approaches to visualization. This chapter and subsequent chapters include some examples of how we incrementally introduce Latent Semantic Indexing and Author Co-Citation Analysis into the framework. This chapter first examines the automatic construction of hypertext, a rich source of inspiration for information visualization, then looks at the growing interest in the WordNet® database and its role in visualization applications, and finally, at GSA, introduced to provide a synthesized view of the literature, and to highlight some potentially fruitful areas for research.
02
13/05/04
18:29
Page 28
28
Information Visualization
2.1 Proximity and Connectivity 2.1.1 Semantic Distance WordNet® provides a rich source of structures to describe the relationships between words. Research has shown that the perception of such relationships in a hierarchy may be affected by some interesting factors, which are likely to have significant effects on information retrieval, especially in assessing the query–document relevance. The following example explains two major effects based on a concept of semantic distance. There is an increasing interest in the nature of online searching. According to a constructivist analysis, during online searching, the searcher continuously constructs meaning from the perceptual phenomena appearing on the computer screen as the result of a complex interplay of the work of indexers, database designers, and everyone else who has contributed to the development of the searching environment. Online database searching and, more recently, web-based searching using various search engines, all resemble a black-box experience. One enters a search query and receives bibliographical records, or URLs, without a clear picture of why these results are presented, or whether they are indeed relevant. Relevance ranking algorithms cannot do the real work of information retrieval – searchers themselves must reach the ultimate judgment regarding the relevance of a listed document. A key factor that distinguishes subject experts from non-experts is specialized vocabulary. Experts are individuals with special vocabulary and background knowledge, and they share presumptions and language. The semantic distance model (SDM) of relevance assessment is proposed by Brooks (1995). The central concept of the SDM is semantic distance. Concepts are placed in a multidimensional space, according to their values on some dimension of meaning. To create a dimension of meaning, Brooks used the generic trees of descriptors found in an existing thesaurus or a hierarchical structure, in which the semantic distance between two items is defined as the number of steps from one to another along existing links in the structure. Brooks has shown that relevance assessments declined systematically with an increase in semantic distance. Subjects gave the highest relevance assessments to the topical subject descriptor semantically closest to the bibliographical record, and then incrementally smaller relevance assessments to descriptors more distant. This was explained as a result of the so-called semantic distance effect. In addition, the rate of decline of the assessed relevance appeared to be different for top and bottom record in the same generic tree. This was described as the influence of the semantic direction effect. Comparing a bibliographical record from the top of a generic tree to descriptors located below it produced a rapid decline in relevance assessment. In contrast, comparing a bibliographical record at the bottom of a tree to descriptors located above it produced a slower rate of decline in relevant assessment. In other words, the perceived distance downwards to non-relevance appeared to be shorter than the distance upwards to non-relevance. Brooks found out that topical subject expertise enhances the effects of the SDM, and the strength of the SDM is contingent on phenomenological factors of the computer–human experience. This provides empirical support for the belief that relevance is a contingent, psychological construct. The effects of the SDM may be
02
13/05/04
18:29
Page 29
Extracting Salient Structures
29
limited on term hierarchies in which terms are spaced so far apart that they lack internal coherence and do not converge into a cohesive semantic domain. SDM can provide important input into information visualization, especially when dealing with a heterogeneous network of documents, topical descriptors, subject headings, and search queries.
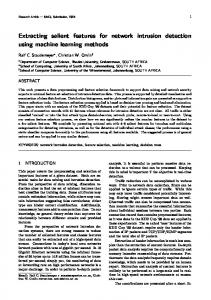
2.1.2 Multidimensional Scaling Scaling is an important concept in psychology, and can provide a rich source of visualization techniques. It derives a quantitative scale to represent an internal, psychological response or reaction to stimuli, such as preference and satisfaction.A number of techniques have been developed for a variety of scaling. Multidimensional scaling (MDS) includes a family of popular scaling methods that can map high-dimensional data into a two- or three-dimensional space. It is possible to capture the nature of a data set from groupings emerging from the spatial layout in MDS. To use MDS, the data set must provide enough information to derive and represent the distance between a pair of data points. This type of data is known as proximity data. There are several ways of obtaining it, for example, judging the similarity between two documents directly, using sorting and clustering techniques. A special type of MDS, known as individual differences MDS (INDSCAL), is designed for the study of the nature of individual differences. The input is a series of matrices. For example, White and McCain (1998) used author co-citation analysis to map the field of information science. Twelve key journals in information science between 1972 and 1995 were analyzed, and INDSCAL was used to identify trends in terms of top-cited authors in the field. The input was three periodical author co-citation matrices. The results of MDS may not always be straightforward to interpret. Using the example of Boston tourist sites, according to Lokuge et al. (1996), trajectory mapping for high-dimensional feature spaces often captures the features of the data better than MDS. Instead of relying on similarity judgments as in MDS, trajectory mapping requires subjects to imagine a conceptual feature or property that links each pair of sites. The subject then extrapolates that feature in both directions, to pick two stimuli that would be appropriate from the remaining set. A trajectory map for tourist sites in Boston is shown in Figure 2.1. The positions of the nodes are not important; instead, the mental model is captured by the connections between the nodes. It is the choice between using spatial proximity or using explicit links that distinguishes MDS and trajectory mapping. Similarly, Pathfinder networks, a key component in GSA, also highlight the role of explicit links in structuring and visualizing salient semantic structures. In a series of studies, Chalmers and his group increasingly improved the running time of multidimensional scaling (Table 2.1). Recently, by using a hybrid strategy Sampling → Spring → Interpolating → Refining, they reported their new algorithm that can lay out 108,000 items in 360 seconds (Morrison et al., 2003).
2.1.3 Link-reduction in Graphs The most widely known graph drawing techniques include force-directed graph drawing algorithms and spring-embedder algorithms (Eades, 1984). The primary
02
13/05/04
18:29
Page 30
30
Information Visualization
Figure 2.1 A trajectory map of Boston tourist sites (Lokuge et al., 1996). © 1996 ACM, Inc. Reprinted with permission. Table 2.1 Fast Multidimensional Scaling (Fast MDS) Big O Notation MDS Chalmers, 1996 Morrison et al., 2002 Morrison et al., 2003
N3 N2 N3/2 N5/4
N12/4 N8/4 N6/4 N5/4
goal of these algorithms is to optimize the arrangement of nodes of a network algorithmically, such that nodes connected by strong links in a graph-theoretical model appear close to each other in the final geometric representation, and weakly connected nodes appear far apart. Force-directed algorithms often lead to node placements that are aesthetically appealing. These algorithms, however, face some challenges in terms of efficiency, especially in terms of scalability, which is closely related to the clarity of a visualized network. Cluttered network visualizations should be avoided whenever possible. An excessive number of links in a display may severely obscure the discovery of essential patterns. A commonly used strategy to reduce clutter is to reduce the number of links. There are several ways to achieve this goal. Three popular ones are analyzed below. The first option is imposing a link weight threshold so that only links with weights above the threshold are included (Zizi and Beaudouin-Lafon, 1994). This approach is straightforward and easy to implement. However, it does not take the intrinsic structure of the underlying network into account, so the transformed network may not preserve the essence of the original network. Minimum Spanning Tree (MST) The second option is extracting a minimum spanning tree (MST) from a network of N vertices and reducing the number of links to N � 1. This approach guarantees
02
13/05/04
18:29
Page 31
Extracting Salient Structures
31
the number of links in the transformed network is always N � 1, whereas option 3 may not have such upper bounds. For instance, we know that a Pathfinder network is the set union of all possible MSTs of the original network, but the number of distinct MSTs depends on the weight distribution of individual links. Therefore, the number of extra links varies not only from network to network, but also from measurement to measurement. For instance, Noel et al. (2002) showed that using document co-citation counts normalized as cosine coefficients or Pearson correlation coefficients can lead to MSTs of different topological properties, and that the former resulted in more favorable structures, i.e. the presence of highly connected nodes with a fixed number of links, although the size of their MST is relatively small, less than 200 nodes. Pathfinder Network Scaling (PFNET) The topology of a PFNET is determined by two parameters q and r and the corresponding network is denoted as PFNET(r,q).The q-parameter specifies the maximum length of a path subject to the triangular inequality test. The r-parameter is the Minkowski metric used to compute the distance of a path. The most concise PFNET for visualization is PFNET (q � N � 1, r � �) (Chen, 2003; Chen and Paul, 2001; Schvaneveldt, 1990). In an author co-citation analysis (ACA), White (2003b) demonstrated that a 120-node PFNET derived from author co-citation counts was predominated by a number of high-degree nodes. In contrast, if author co-citation links were weighted by Pearson correlation coefficients, the resultant PFNET did not have this pattern. He concluded that using raw counts in ACA would be a preferred method.As a side note, the use of Pearson correlation coefficients is studied in Ahlgren et al. (2003), where an example is constructed to show that Pearson correlation coefficients could lead to counter-intuitive results in author co-citation analysis.
2.2 Clustering and Classification The goal of cluster analysis is to divide a large data set into a number of sub-sets, called clusters, according to some given similarity measures. Not only has clustering analysis established many areas of application, for instance, constructing taxonomies in biology, but it can also play a significant role in information visualization. For example, the Scatter/Gather system developed at Xerox helps users to deal with a large information space by repeatedly clustering and aggregating documents at various levels in its user interface, so that the required information can be found more easily.
2.2.1 Clustering algorithms Clustering algorithms rely on a definition of distance or similarity between two items in a data set. The Minkowski model provides a generic definition of distance: r dij � | xia � x ja | p a�1
∑
1/ p
( p � 1), xi � x j
02
13/05/04
18:29
Page 32
32
Information Visualization
where two data points are represented by vectors xi and xj. Several definitions of distances can be derived from this model; in particular, Euclidean (p � 2) and Dominance (p � �) can be derived from the Minkowski distance, as special cases. A metric space is defined with the following two axioms: 1 Non-degeneracy: dij � 0 if and only if i � j. 2 Triangle inequality: dij � dik � dkj. The Minkowski distance defines a metric space. Pathfinder network scaling introduced in Chapter 3 relies on an extended triangle inequality condition. If the triangle inequality can be defined in a semantic space, based on some semantic distance, it is then a metric space. Clustering algorithms use distance as a yardstick to either group a pair of data points into the same cluster, or separate them into different clusters. There are three basic categories of clustering methodologies: (1) graph-theoretical, (2) single-pass, and (3) iterative algorithms. A graph-theoretical algorithm relies on a similarity matrix representing the similarity between individual documents. Clusters are formed by closely related documents, according to a similarity threshold. Each cluster can be represented as a connected graph. Depending on how these documents are separated, the process is known as “single link”,“group average”, or “complete link” clustering (van Rijsbergen, 1979). Seed-oriented clustering is an example of single-pass clustering algorithms. In the seed-oriented clustering, clusters grow from individual data points, called cluster seeds. For example, document clusters can be generated by adding the documents most similar to the seeds into existing clusters. The number of clusters must be known for seed-oriented clustering to occur. Iterative algorithms attempt to optimize a clustering structure, according to some heuristic function. An iterative algorithm can use clusters generated by other clustering algorithms, such as seed-oriented clustering, as a starting point. Some clustering analysis routines are provided in popular statistical packages such as SPSS.1 SPSS provides the following clustering procedures in the Professional Statistics option:
••
K-means cluster hierarchical cluster
K-means clustering algorithms can handle a large data set, but the number of clusters must be specified in advance. Hierarchical clustering algorithms merge smaller clusters into larger ones, without knowing the number of clusters in advance. The example data set for the K-mean clustering method includes various personal profiles from 474 people, such as age, education, starting salary, and present salary. The goal of the example analysis is to divide these people into two groups based on their profiles. Two clusters are specified in advance, and the resulting clusters are shown in Table 2.2. The data set is divided into two clusters by the K-mean procedure: cluster 1 contains 401 people and cluster 2 contains 73 people. People in cluster 2 seem to be younger, better educated, and earning higher salaries. Clustering is a useful way of dealing with very large sets of documents. However, there are few incremental, or maintenance, clustering algorithms in the literature.
1
www.spss.com
02
13/05/04
18:29
Page 33
Extracting Salient Structures
33
Table 2.2 Centroids of two clusters Cluster
People
Age
Education
Salary (begin)
Salary (now)
1 2
401 73
37.55 35.20
12.77 17.47
5748.27 12619.07
11290.35 27376.99
It is common for the clustering procedure to be repeated entirely in response to the change of the original data set. For a dynamic and evolving data set, reclustering must be done from time to time on the updated data set, in order to keep the clusters up to date. Each time the data are updated, the whole set of clusters must be built all over again.
2.2.2 Incremental Clustering To maintain clusters generated by graph-theoretical methods such as single-link, group-average, or complete-link clustering algorithms, similarity values are needed. Although the update cost of the single-link method is reasonable, the time and space requirements of the group-average and the complete-link approaches are prohibitive, because the complete knowledge of similarities among old documents is required. Therefore, an efficient maintenance algorithm would be preferable to reclustering the whole data set. Fazli Can (1993) has developed an incremental clustering algorithm that can continuously update existing clusters. It was tested in an experiment based on the INSPEC database of 12,684 documents and 77 queries. Empirical testing suggests that the incremental clustering algorithm is cost-effective; more importantly, the clusters generated are statistically valid and compatible with those generated by reclustering procedures. Can’s algorithm is called cover-coefficient-based incremental clustering methodology (C2ICM), and is a seed-oriented method. The cover-coefficient (CC) concept provides a measure of similarities among documents. It is first used to determine the number of clusters and cluster seeds. Non-seed documents are subsequently assigned to seeded clusters. The CC concept is used to derive document similarities based on a multidimensional term space. An m n (document by term) matrix D is mapped into an m m matrix C (cover coefficient). Each cij (l i, j m) in the matrix C denotes the probability of selecting any term appearing in document di from document dj. The probability is defined as follows: n
Cij � �i x
∑ (dik �k djk )
k�1
where �i, and �k are the reciprocals of the ith row sum and kth column sum, respectively. Each document must contain at least one term and each term must appear at least in one document.
02
13/05/04
18:29
Page 34
34
Information Visualization
This probability indicates the similarity between documents di and dj. The probability is demonstrated as follows. First, randomly choose a term tk from document di. In cij, the probability of this random selection is denoted by �i dik. The next step is to select the term tk from document dj (the ball of that particular color); this probability is represented in cij by �k djk. Finally, the contribution of each bag (terms of di) to the selection probability of a ball of that particular color (dj) must be taken into account by adding these probabilities together for all. This cij probability is a measure of similarity. It indicates the extent to which document di is “covered” by document dj. If two documents have no terms in common, then they will not cover each other at all, and the corresponding cij and cji will be zero. In addition, Can (1993) introduces �i � cii as the de-coupling coefficient because it is a measure of how different document di is from all other documents. The de-coupling coefficient is defined as �i � 1 � �i Based on the coupling and de-coupling coefficients, the number of clusters can be estimated as a function of the matrix D instead of a predefined parameter. This is the key to the incremental clustering method. Can (1993) generated initial clusters using a method called C3M (cover-coefficientbased clustering methodology). The incremental clustering algorithm C2ICM is an extension of the C3M method; both are seed-oriented clustering algorithms. In a seed-oriented approach, a cluster seed must be able to attract some nonseed documents around itself, and, at the same time, must be separated from other seeds as much as possible. To satisfy these constraints, Can introduced another concept, the cluster seed power, such that documents with the highest seed powers are selected as the cluster seeds. Once seed documents are found, the remaining non-seed documents are allocated to a cluster if its seed can provide the best cover for them, or if it has the greatest seed power. C2ICM is a complex incremental clustering algorithm, but it is useful for updating clusters of very large and dynamic data sets. As many computational algorithms and software must be able to scale up to meet continuous challenges from increasingly large data sets, notably the web, methods such as the incremental clustering will be an increasingly useful and generic tool.
2.3 Virtual Structures The outcome of structural modeling is a virtual structure. It is this virtual structure that information visualization aims to reveal to users in a graphical and visually understandable form. Virtual structures include structures derived from a wide range of data, using computational, statistical, or other modeling mechanisms. The term “virtual” is used here to emphasize that the structure does not exist in the original data in a readily accessible form. A topical map of a collection of scientific papers published in a conference series is a good example to explain the difference between a virtual structure and an existing structure. The papers are independently written about related topical subjects, but they may or may not relate to each other in more specific aspects. The original data set does not usually have readily accessible information to specify whether or not two papers are related, and if so in what sense. Thus the topical map provides a means of describing the underlying connections within the collection, which is not readily available in any other form.
02
13/05/04
18:29
Page 35
Extracting Salient Structures
35
In order to demonstrate the process of structural modeling, we include some theoretical and practical examples, in areas such as automatic construction of hypertext, manually constructed thesaurus, and the GSA framework.
2.3.1 Automatic Construction of Hypertext Many systems have been designed on the basis of classic information retrieval models. The most common requirement for generating hypertext automatically is to identify passages in the text that are good candidates for a hypertext link. Automatic construction of hypertext is closely related to the creation of an automatic overview map, an information visualization area in its own right. Automated link generation presents some of the most challenging tasks for extracting and visualizing abstract information spaces. A variety of techniques have been developed; among them the classic vector space model has a profound impact on the development of visualization systems for information retrieval. In fact, a wide range of information visualization systems use the basic idea of a vector space model in one way or another. The process of constructing a hypertext consists of two broad phases. In the first, known as information chunking, a document is segmented into nodes to be interconnected in the final hypertext. The second phase is linking: nodes are connected by hypertext links according to a story line, some underlying logic, or other heuristics, into a hypertext. Research in information retrieval has used clustering methods to link documents by their containing cluster. Most approaches inspired by information retrieval models have paid little attention to the nature of the relationship underlying automatically generated links. Allan (1997), however, particularly focused on how link types can be found automatically, and how these links can be appropriately described. He classified links into three categories – manual, pattern matching, and automatic – based on whether or not their identification can be achieved automatically. For example, patternmatching links typically rely on existing mark-ups in the text, whereas automatic link types can be derived with or without existing mark-ups. Automatic links are further divided into sub-categories, such as revision, summary and expansion, equivalence, comparison and contrast, tangent, and aggregate links. Equivalence links represent strongly related discussions of the same topic.
2.3.2 The Vector Space Model Much of the work on automatic hypertext generation in large document collections has been formulated as a special case of the more general information retrieval (IR) problem. The basic premise underlying most current IR systems is that documents that are related in some way will use the same words. If two documents have enough terms in common, then we can assume that they are related, and should therefore have a link placed between them. The vector space model (VSM) has a great impact, not only on information retrieval, but also on the design of many information visualization systems. The SMART information retrieval system introduces the vector space model, in which both queries and documents are represented as vectors in a high-dimensional space. The dimensionality is determined by the number of unique terms in the given
02
13/05/04
18:29
Page 36
36
Information Visualization
document collection. The magnitude of a vector in a particular dimension represents the importance of the specific term in the corresponding document (Salton et al., 1994). Since the vector space model maps both queries and documents into vectors, one can compute document–document relevance, as well as query–document relevance. The well-known tf idf weighting scheme is typically used to compute the vector coefficients. The weight of term Tk in document Di is defined by wik as follows: vik w ik � t vij2
∑ j�1
N vik � tf ik • log nk where N is the number of documents in the collection, tfik is the number of times term Tk occurs in document Di, and nk is the number of documents in which term Tk occurs at least once. The denominator plays a role known as length normalization, which reduces the bias in favor of long documents, because they tend to have larger tf values. The vector space model has several appealing features for information retrieval and information visualization. Both queries and documents are represented as vectors. The focus of traditional information retrieval is on query–document relevance ranking, in order to find the document which best matches a given query. In contrast, information visualization has special interests in interdocument similarities, as measured by the distance between corresponding document vectors. Many visualization systems are designed to visualize a sub-set of a particular collection of documents, in response to a search query. The original collection is therefore narrowed down by the search query. For example, Allan (1997) describes automated construction of hypertext with such a scenario. A hypertext, based on the results of an initial search query, is automatically generated. Users can find documents related to a chosen document in the vector space by selecting documents immediately surrounding the vector of the document. Allan presents an example in which the user’s goal was to find documents related to an encyclopedia article on “March music”. Many of the documents retrieved according to the vector proximity turned out to be relevant to the topic. However, a number of documents retrieved in this way were not relevant, because the meaning of the word “March” is ambiguous: it could refer to a type of music, a month of the year, or other meanings. This is a well-known problem, known in the information retrieval community as the vocabulary mismatch problem, and has drawn much attention from researchers. The way to distinguish the meanings of words like “March” or “Bank” is to examine the contexts in which they occur. Latent semantic indexing (LSI) demonstrates how this problem can be tackled (Deerwester et al., 1990) (see section 2.3.3). Lexical chaining (see section 2.3.5) represents an alternative approach, in which the accurate information about connections between different words is derived from a thesaurus, and the information used to reduce the ambiguity of words as their contexts is taken into account (Green, 1998). Allan (1997) describes yet another approach, where the vector space model is applied to finer-grained analysis within documents. In addition to document
02
13/05/04
18:29
Page 37
Extracting Salient Structures
37
vectors, paragraphs and sentences in each document are also represented in the vector space model. First, two documents are deconstructed into smaller pieces so that they can be compared at a finer-grained inspection, for example, sentence by sentence, or paragraph by paragraph. Second, sentences are transformed into vectors. These sentence vectors are compared, to determine whether or not the documents share a similar context. In Allan’s example, the following criteria are used to select relevant documents:
• • •
there must be at least one pair of sentences in the two documents with a similarity of 70%; there must be at least one pair of sentences with at least two terms in common; and the most heavily weighted term must contribute more than 95% of the similarity.
There exist other alternatives to take the role of a context into account. Latent semantic indexing (LSI), also known as singular value-decomposition (SVD), is such a candidate.
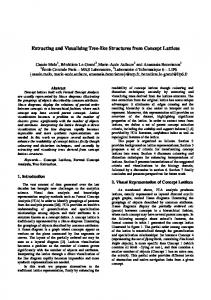
2.3.3 Latent Semantic Indexing Latent semantic indexing (LSI) is designed to overcome the so-called vocabulary mismatch problem faced by information retrieval systems (Deerwester et al., 1990; Dumais, 1995). Individual words in natural language provide unreliable evidence about the conceptual topic or meaning of a document. LSI assumes the existence of some underlying semantic structure in the data, which is partially obscured by the randomness of word choice in a retrieval process, and that the latent semantic structure can be more accurately estimated with statistical techniques. In LSI, a semantic space, based on a large term document matrix, is constructed. Each element of the matrix is the number of occurrences of a term in a document. The document plays a contextual role, specifying the meaning of the term. LSI uses a mathematical technique called singular value decomposition (SVD). The original term document matrix can be approximated with a truncated SVD matrix. A proper truncation can remove noise data from the original data, as well as improve the recall and precision of information retrieval. The diagram in Figure 2.2 illustrates how a large matrix is truncated into a smaller one.
Figure 2.2 Singular value decomposition (SVD) and a truncated SVD matrix.
02
13/05/04
18:29
Page 38
38
Information Visualization
Perhaps the most compelling claim from the LSI is that it allows an information retrieval system to retrieve documents that share no words with the query (Deerwester et al., 1990; Dumais, 1995). Another potentially appealing feature is that the underlying semantic space can be subject to geometric representations. For example, one can project the semantic space into a Euclidean space for a 2D or 3D visualization. On the other hand, in practice, large complex semantic spaces may not always fit into low-dimension spaces comfortably. LSI reduces the dimensionality of a data set in a similar way to standard factor analysis. Each data point can be represented by a smaller number of underlying factors identified by LSI. In Figure 2.3, (a) is a 2D scatter plot of the ACM SIGCHI conference data set, containing 169 documents published between 1995 and 1997. This data set appears to be relatively well captured by the first two dimensions. In contrast, Figure 2.3 (b) shows a scatter plot of the CACM collection, containing more than 3200 documents. A large number of documents are plotted close to the original, suggesting that their positions in the semantic space cannot be adequately represented within its sub-spaces. The two diagrams in Figure 2.4 represent the singular values of the CHI and CACM data sets based on the output of LSI. They were plotted in a similar way to eigenvalue curves in standard factor analysis. The value of each point indicates the uniqueness or significance of a given factor. A higher singular value indicates that the underlying factor explains more variance than a factor with a lower singular value. The first few dimensions typically explain a large amount of variance. Both data sets have a long, flat tail, suggesting that they are high-dimensional spaces in nature.
Figure 2.3 Scatter plot of CHI 95–97 (left) and the CACM collection (right).
Figure 2.4 The singular value curves of the CHI and CACM data sets.
02
13/05/04
18:30
Page 39
Extracting Salient Structures
39
2.3.4 The Use of WordNet® WordNet® is an on-line lexical database developed by the Cognitive Science Laboratory at Princeton University,2 on the basis of contemporary psycholinguistic theories of human lexical memory. It was first created in 1985 as a dictionary based on psycholinguistic theories, and now contains over 50,000 words and 40,000 phrases, collected into more than 70,000 sense meanings. The basic concepts and construction of WordNet® are explained in the so-called “Five Papers on WordNet”, available on the web.3 A comprehensive bibliography, maintained by Joseph Rosenzweig at the University of Pennsylvania, is also available on the web.4 WordNet® divides words up into synonym sets, also known as synsets. Each synonym set includes words that are synonyms of one another.These synsets are then connected by a number of different relations such as “is-a”, “has-a”, or “includes”. A particular word may appear in several synonym sets, depending on how many senses it has. Each sense of a word is identifiable by the word and a sense number. A number of browsers have been designed to facilitate the access to the WordNet®. WordNet Navigator5 is a graphical user interface, developed at the Universidad Complutense de Madrid, Spain. It can be used to display how words are related in the WordNet®. While its user interface was mainly written in Java, the communication with the WordNet® is handled in C. These two components are integrated on the web using Common Gateway Interface (CGI). The information is displayed on the screen in four categories: (1) Navigation Tree, a diagram of relations between words; (2) Node Info, information about a particular word; (3) Control and (4) Navigation Mode, for inputting control parameters and link types for navigation. The local structure surrounding a given word is displayed in the navigation tree, in which nodes represent words, and edges indicate relations such as “is-a”, “hasa”, or “include”. Each node contains a word and a sense number, which identifies its synonym set. The node info displays information about synonyms and definitions. The control specifies the word with which to start. The navigation mode specifies whether the current navigation is based on the structure determined by “is-a” or by “has-a” links. For example, suppose we are interested in the word “place” and its synonyms. To start the navigation, type the word “place” into the control section. The sense number is optional. If a sense number is given, only one node will appear on the screen; otherwise, the navigation tree will include all the meanings of the word “place”. If nothing matches the query word “place”, then we may try a different word or sense number. Once the navigation tree returns, it is time to specify the navigation mode: whether the navigation should rely on “is-a” or “has-a” relationships. If the user selects a node in the navigation tree, the selected node, its parent, siblings, and children will be displayed, according to the chosen navigation mode. This graphical browser provides simple but useful access to the internal structure of the WordNet®.
2
http://www.cogsci.princeton.edu/�wn/ ftp://ftp.cogsci.princeton.edu/pub/wordnet/5papers.pdf 4 http://www.cis.upenn.edu/�josephr/wn-biblio.html 5 http://bogart.sip.ucm.es/demos/navword/ 3
02
13/05/04
18:30
Page 40
40
Information Visualization
2.3.5 Lexical Chaining The classic vector space model and its variants are by far the most popular options in visualizing abstract information spaces for retrieval and exploration. The following example illustrates how the WordNet® can provide semantic knowledge of relationships between words, in the estimation of inter-document similarities. An interesting alternative, lexical chaining, is described by Green (1998)6 in an attempt to deal with two major linguistic factors that may undermine the effectiveness of traditional information retrieval models, namely, synonymy and polysemy. Synonymy refers to the use of different words to describe the same concept, for example, “dog” and “puppy”. Polysemy, on the other hand, refers to the use of the same word to describe different concepts, for example, “bank”. Consequently, term occurrences may underrepresent the connection between synonym words, or overrepresent the connection between documents using the same word in different senses. A lexical chain is a sequence of semantically related words occurring in a document. For example, if text contains the words “apple” and “fruit”, then they should both appear in a chain, since an apple is a kind of fruit. It is believed that the organization of the lexical chains in a document reflects the discourse structure, or the main theme of the document. Lexical chains in text can be recovered using any lexical resource that relates words to their meanings. For example, Roget’s International Thesaurus (Chapman, 1992) and the WordNet® database (Beckwith et al., 1991) have been used to provide such semantics. Estimating the similarity between two documents is therefore equivalent to finding the similarity between lexical chains associated with these documents. Lexical chaining appears to be a promising alternative to the existing information visualization paradigms.
2.4 Complex Network Theory Statistical mechanics of complex networks have recently become the center of attention in several scientific communities, including statistical physics, computer science, and information science (Albert and Barabási, 2002; Barabási et al., 2000; Barabási et al., 2002; Dorogovtsev and Mendes, 2002; Girvan and Newman, 2001). These studies focused on the topological properties of large networks (the Internet, the web, scientific networks) and found some surprising similarities. The latest advances are primarily rooted in two types of networks known as small-world networks (Watts and Strogatz, 1998) and scale-free networks (Barabási et al., 2000). This line of research particularly focuses on mechanisms that can explain, in statistical terms, topological properties demonstrated by a class of networks. Even so, the findings from these studies are not readily adaptable to information technology research and development, and large-scale, detailed experimental studies are necessary to establish links between statistical physics and other fields of study where understanding the dynamics of large-scale network evolution is also of central concern.
6
http://www7.conf.au/programme/fullpapers/1834/com1834.htm
02
13/05/04
18:30
Page 41
Extracting Salient Structures
41
2.4.1 Topological Properties of Networks Small-world networks are large networks characterized by the existence of shortcut links and tighter clustering of nodes than one would find in a random network. The existence of short chains of acquaintances has been documented by socialnetwork scientists for over four decades (Huberman, 2001). The web is one of the first identified small-world networks (Barabási et al., 2000). Scientific collaboration networks based on co-authorship also demonstrate small-world network properties (Newman, 2001a, b). The degree of a node is the number of links to the node. Scale-free networks are characterized by an extremely skewed distribution with a long tail (Albert and Barabási, 2002). Mathematically, such distributions can be described by a power law, which means that the probability of finding a node with k links to other nodes is proportional to k��. The size of the exponent � has been the focus of a large number of studies. For instance, it was found to be 1.5 for networks of words, 2.2 for metabolic networks, 2.5 for protein–protein interactions, 2.5 for collaboration networks, and between 2.5 and 3.0 for citation networks (Dorogovtsev and Mendes, 2002). The power law distribution implies that the majority of nodes have only one or a few links, while a small but significant amount of nodes have a large number of links (Barabási, 2002). Exceedingly well-connected nodes are also known as hubs. The web is a scale-free, as well as a small-world, network. Scale-free networks have a noticeable resilience to random connection failures without losing their global connectivity (Pastor-Satorras and Vespignani, 2001) Topological properties of networks may have far-reaching implications – for example, on the understanding of the spread of disease and rumors, or on the most effective way to search through the web (Barabási, 2001). Recently, research has focused on modeling the growth mechanisms of small-world or scale-free networks. The main interest is whether it is possible to duplicate the evolution of a network so that topological properties of a simulated network match to the real one. However, it should be noted that the analysis of structural and dynamic properties of networks in this context usually did not take into account the nature of individual nodes and links.
2.4.2 Preferential Attachment The simplest network growth model adds one new node at a time and links the new node with a randomly chosen node from the current network. Attachment mechanisms like this have no preference in selecting where the new link should grow. The resultant networks tend to have an exponential degree-distribution. They are called exponentially growing networks (Dorogovtsev and Mendes, 2002). The growth of scale-free networks has been intensively studied. Most network formation mechanisms in this category are motivated by the rich-get-richer effect, also known as the Matthew Effect and cumulative advantage. Instead of randomly selecting a node and linking it to a new node, a new link is most likely given to a node that already has the most links (Barabási, 2002). This mechanism is called preferential attachment. If the preferential attachment probability p is a linear function of the degree k, this method produces a scale-free network with an exponent � of 3. Barabási and his colleagues (Barabási et al., 2002) found that preferential attachment mechanisms could produce the topological properties of
02
13/05/04
18:30
Page 42
42
Information Visualization
the co-authorship networks of mathematicians and neuroscientists over an eightyear period (1991–1998). Steyvers and Tenenbaum (2001) experimented with a growth model for three semantic networks – associative networks, the WordNet®, and Roget’s Thesaurus – by preferentially choosing well-connected concepts and preferentially connecting to nodes with high utility. Their model produced smallworld properties and the power-law degree distributions. However, it has been shown that preferential attachment in general does not guarantee a scale-free network (Krapivsky et al., 2000). Mechanisms for generating scale-free networks without preferential attachment have also been proposed (Caldarelli et al., 2002). It has been shown that, without making rich-get-richer attachments, it is possible to obtain a scale-free network. Rather than relying on the popularity of nodes, the alternative mechanism relies on the fitness of each node and implies that the fitness is a major source of attraction; such nodes are more likely to become hubs. Such mechanisms are called the goodget-richer mechanisms. Similarly, Melian and Bascompte (2002) analyzed the relation between the connectivity of a species and the average connectivity of its nearest neighbors in three of the most resolved community food webs. They found that two highly connected nodes are unlikely to be connected between each other in protein networks, but the reverse happens in food webs. Decay is an equally important part of network evolution: a network may lose its nodes and links over time as well as gain new ones. Prior to the recent interest in statistical mechanics, van Raan and his colleagues in the scientometrics community (van Raan, 2000) identified that the growth of scientific publications and citations is characterized by growing and aging processes.
2.4.3 Challenges It should be noted that the lack of detailed, comprehensive empirical investigations of these statistical mechanisms in the context of an underlying phenomenon is a significant gap between the theories in statistical physics and the potential practice of analyzing large-scale network evolution in specific application domains. Few empirical studies have examined changes in the topological properties of a network over time. The lack of good time-resolved data on how networks grow has been the principal reason (Newman, 2001a). Some of the fundamental challenges are as follows. Perspectives of statistical mechanics at the global, system level do not necessarily lead to detailed, context-dependent decisions at the local, operational level. Knowing that the topology of a large network has small-world properties is one thing; knowing how to algorithmically find a short-cut path is quite another. Kleinberg’s local search algorithm for finding short-cuts in a small-world network is an excellent example of the fundamental connections one needs to build between statistical models and IT-enabled instrumental tools. Related questions include how to actually find hubs if statistical properties suggest their existence. Preferential attachment relies on an assumption that the degree function is readily accessible throughout the entire network in question. In reality, this may not be the case. For instance, in citation networks, which we will discuss in subsequent sections, it is unrealistic to assume that scientists have a global knowledge of the popularity of articles within the entire scientific literature. Detailed empirical examinations are necessary to identify the underlying
•
•
02
13/05/04
18:30
Page 43
Extracting Salient Structures
•
•
43
context-dependent variables so that one can be aware of the validity of such assumptions. For instance, by examining the growth of a citation network, one can reveal the nature of discrepancies between a preferentially growing simulated network and the growth of a real network. In order to maximize the potential of information technology, one needs to know not only the overall statistical properties of the topology of a network, but also the meaning and implications of local and moment-by-moment fluctuations associated with individual nodes and links on our understanding of the underlying phenomenon. Information technology – particularly, animated visualizations of time series of the states of a network – can significantly facilitate information processing and analysis at this level. Statistical mechanics of large-scale networks provide generic mathematical foundations for network analysis. Adapting and incorporating theories of statistic mechanics has a great potential to strengthen and improve the practice of network analysis outside the statistical physics community. For instance, few traditional network visualization studies have statistical mechanics as an integral part of the network, and even fewer have connected visual–spatial properties of the visualization model to statistical properties that may identify the growth pattern of the underlying network. This is a fundamental but potentially rewarding challenge.
These challenges become apparent if one considers complex network theory in the context of information technology. Some challenges identify the potential contributions from information technology to complex network theory, and others the reverse. In one way or another, most challenges have a root in inter-disciplinary differences in terms of perspectives and the level of granularity.
2.5 Structural Analysis and Modeling Botafogo et al. (1992) analyze the structure of a hypertext using graph decomposition methods.A graph can be decomposed into sub-graphs, so that each sub-graph is connected. Using similar methods, several different types of nodes, based on their positions in the graph, are identified. For example, two structural metrics – the relative out centrality (ROC) and relative in centrality (RIC) – are introduced to identify various structural characteristics of a node. The ROC of a node measures whether the node is a good starting point to reach out for other nodes, whereas the RIC of a node indicates how easily the node can be found. Using a high-ROC node as a starting point, the structure of the hypertext can be transformed to one or more hierarchies, and large hierarchies can be displayed with fisheye views, which balance local details and global context (Furnas, 1986). Several examples of how hierarchical structures can be visualized are considered in Chapter 4, including fisheye and hyperbolic views in particular.
2.5.1 Discovering Landmarks in a Web Locality A web locality often refers to a collection of web documents. Documents on a particular HTTP server, a collection of documents gathered from the web using a “spider”, or perhaps even the search results returned by a web search engine, all constitute a web locality. Landmarks in a web locality are simply those nodes
02
13/05/04
18:30
Page 44
44
Information Visualization
important to the locality. However, identifying good landmarks automatically is, in general, a complex and challenging task. Mukherjea and Hara (1997) adopt three heuristic metrics in order to identify landmark nodes within a web locality, including connectivity, frequency of access, and depth in a hierarchy. A landmark node should be highly connected to other nodes. If all roads lead to Rome, then Rome must be a landmark place on this planet. First of all, the “out degree” of a node is the number of outgoing links provided by the node, whereas the “in degree” is the number of incoming links received by the node. A node with high out and/or in degrees should be marked as a landmark. In addition to the first-order connectivity, the second-order connectivity has also been used to identify landmark nodes. This is defined as the number of nodes that can be reached from a particular node by no more than two links. Botafogo et al. (1992) suggest that nodes with high back second-order connectivity also make good landmarks. The back second-order connectivity is defined as the number of nodes that can reach the given node by no more than two links. For example, an index page including many anchors on the web tends to have high connectivity, while the home page of a large corporation is likely to have high back connectivity. Purely connectivity-based heuristics may miss nodes that are significantly important, but are unlikely to be singled out in terms of connectivity alone. Mukherjea’s formula thus takes the frequency of access into account in attempts to identify landmark nodes with reference to the perception of users. The more frequently a node is visited, the more likely that the node should be made a landmark. The majority of web sites put general information higher up in the hierarchy of the web locality. Detailed information, on the other hand, is likely to be placed lower down in the hierarchy. Mukherjea suggests that the depth of a node indicates its importance. The depth of a document on the web can be detected by decomposing its URL. For example, http://www.acm.org/ is a node with a depth of one, whereas http://www.acm.org/sigchi/chi97/ has a depth of three. The following formula is adopted from Mukherjea and Hara (1997) for dis covering landmark nodes (with simplified notations and symbols): landmark (�) �
connectivity • �connectivity max(connectivity) access 1 � • �access � • �depth max(access) depth
connectivity � (in � out ) • � first � (in 2 � out 2) • �second � first � �second � 1 �connectivity � �access � �depth � 1 where �x is a weight that can be configured by users. To be a landmark, the landmark value must exceed the threshold value � to ensure that only real landmark nodes are selected. The default threshold value is 0.1. By default, the first-order connectivity (in and out) is weighted slightly more than the second-order connectivity (in 2 and out 2). A landmark view generated by this formula is shown in Figure 2.5, which visualizes the Georgia Technical College of Computing web server. The aesthetic layout
02
13/05/04
18:30
Page 45
Extracting Salient Structures
45
Figure 2.5 Landmark nodes in a web locality. The taller a node, the greater its importance. Brighter colored nodes are more popular. Reprinted with permission of Sougata Mukherjea.
of the landscape is generated using a force-directed graph layout algorithm (Szirmay-Kalos, 1994). In this map, landmarks are displayed proportional to their importance values. The height of a node represents the importance of the node. Popular nodes are in bright colors, while less popular nodes are displayed in darker colors. The landscape view enables the user to locate important nodes in the web locality quickly, by navigating through the 3D space using mechanisms provided by the VRML browser.
2.5.2 Trajectory Maps So far we have discussed structural models based on feature vectors of documents, images, or other types of objects. In addition to these vector-based models, a structure may represent the dynamics between documents and generic objects. An important family of such structures is known as procedural models, including user-centered information structures. Here, the interrelationship between two objects is determined on the basis of actions or events that directly involve the two objects. When a user navigates the web, a link-following event relates the source document with the destination document. Such events collectively indicate the perceived connection between the two documents. In other words, such interrelationships can be derived from behavioral models of browsing patterns. Similarly, as two publications in the literature are repeatedly cited together, the bond between them is reinforced and strengthened dynamically. Sometimes such structures are referred to as mental maps (Lokuge et al., 1996). The following example is based on Lokuge et al. (1996) and Lokuge and Ishizaki (1995), in which mental maps of various facilities in Boston are derived as user-centered information structures. There are many tourist attractions in Boston. How are these attractions interrelated from the point of view of an individual? Are mental models different from one individual to another? Lokuge et al. (1996) describe a method to structure such information using multidimensional scaling and trajectory mapping techniques. Fifteen different tourist sites are chosen from a tourist guide to form the mental map. The interrelationships between these sites are high dimensional in nature, because they may be uniquely related in a number of ways according to different features, and they tend to vary from individual to individual.
02
13/05/04
46
18:30
Page 46
Information Visualization
At least two mental models of these tourist sites can be derived: one based on their geographic locations, and one based on their functions. To generate these mental models using multidimensional scaling, two subjects gave pairwise similarity judgments according to geographic locations and functions. The judgments based on geographic similarity (Figure 2.6) are completely different from judgments based on content (Figure 2.7). The distance-based MDS plot is similar to the
Figure 2.6 The mental model of Boston tourist sites, based on geographical locations (Lokuge et al., 1996). © 1996 ACM, Inc. Reprinted with permission.
Figure 2.7 The mental model of Boston tourist sites, based on their functions (Lokuge et al., 1996). © 1996 ACM, Inc. Reprinted with permission.
02
13/05/04
18:30
Page 47
Extracting Salient Structures
47
actual map of Boston. In the function-based MDS plot, similar tourist sites, such as the Aquarium and the Zoo appear near each other.
2.5.3 Pathfinder Network Scaling Pathfinder network scaling is a structural modeling technique originally developed by Schvaneveldt et al. (1989) for the analysis of proximity data in psychology. It simplifies a complex representation of data to a much more concise and meaningful network – only the most important links are preserved, to create a Pathfinder network (PFNET). If we consider the following three examples, the major problems with an excessive number of links in a graphical representation of a network should become clear. Figure 2.8 shows a network structure visualized by the NavigationView Builder (Mukherjea et al., 1995), one of the most widely cited works in information visualization. It is clear from this example that a large, connected graph would have even more edges crossing each other. One of the common criteria for general undirected graph drawing is to avoid such crossings if possible. This illustrates the fact that underlying patterns in a complex network can be lost in a large number of links. There are several options to avoid displaying redundant links. For example, multidimensional scaling (MDS) does not usually display any links at all. The relationships between objects are purely represented by their positions in the spatial configuration. In fact, a special class of hypertext, called spatial hypertext, also known as linkless hypertext because of its reliance on spatial proximity (Marshall and Shipman, 1995), is taking a similar approach. Alternatively, redundant links from the original data may be removed in advance, including algorithms such as Pathfinder network scaling and minimal spanning trees. The spanning tree approach is used in LyberWorld (Hemmje et al., 1994) and Hyperbolic 3D (Munzner, 1998b). Visualizing complex information structures is much more difficult than representing regular hierarchical structures. Zizi and Beaudouin-Lafon designed
Figure 2.8 A real-world network may contain a large number of edges. Reprinted with permission of Sougata Mukherjea.
02
13/05/04
18:30
Page 48
48
Information Visualization
SHADOCS, a document retrieval system, to incorporate interactive dynamic maps into the user interface (Zizi and Beaudouin-Lafon, 1994). SHADOCS uses a dynamic clustering technique to divide a large set of document descriptors into smaller clusters. Graphical overview maps are subsequently generated on the screen using a space-filling algorithm. Each region in a map corresponds to a cluster of descriptors, and the size of a region is proportional to the relative importance of those descriptors in the underlying documents. This is very similar to the representation of self-organized maps. There are two types of approach towards the issue of scalability, focusing on either the size (in terms of the number of nodes), or the density of the network (in terms of the number of links). The scalability issue, in terms of the size of new networks, has been largely resolved (Zizi and Beaudouin-Lafon, 1994) by systems such as SHADOCS, which separate large networks into a number of smaller networks by dynamic clustering algorithms. However, a density-related scalability issue turns out to be more difficult. The total number of links in a network consisting of n nodes could be as many as n2. A commonly used strategy is to set a threshold value, and only consider links with values above the threshold. SHADOCS uses a straightforward threshold to control the number of links to be displayed on the screen map. Since the spatial relations have not been taken into account, the linkage in a pruned network may look rather arbitrary, and incompatible with the spatial layout. After all, scalability implies the ability to maintain the original integrity, consistency, and semantics associated with the network representation of an implicit structure. Pathfinder network scaling algorithms provide a useful means of dealing with this challenging problem in a more harmonious way. Pathfinder network scaling can be seen as a link reduction mechanism that preserves the most salient semantic relations. A key assumption is the triangle inequality condition; only those links that satisfy this condition will appear in the final network. In essence, the rationale is that, if the meaning of a semantic relation can be more accurately or reliably derived from other relations, then this particular relation becomes redundant and can therefore be safely omitted. GSA extends this method to a variety of proximity data estimated by statistical and mathematical models (Chen, 1997a, 1998b).A distinct advantage is that the same spatial metaphor can be consistently used across a range of proximity data, a significant advantage for maintaining the integrity of the semantic structures generated by different theories and techniques. Pathfinder relies on Pathfinder network scaling, the so-called triangle inequality to eliminate redundant or counter-intuitive links. The principal assumption is that if a link in the network violates this condition, then the link is likely to be redundant or counter-intuitive and should be pruned from the network. The topology of a PFNET is determined by parameters r and q: the resultant Pathfinder network is denoted as PFNET(r, q). The weight of a path is defined, based on Minkowski metric with the r-parameter. The q-parameter specifies that the triangle inequality must be maintained against all the alternative paths with up to q links connecting nodes n1 and nk:
wn1nk
k�1 wnr n i�1 i i�1
∑
1/r
∀ k � 2, 3, K, q
02
13/05/04
18:30
Page 49
Extracting Salient Structures
49
Figure 2.9 Triangle inequality: the path y–z presents more salient information than link x.
For a network with N nodes, the maximum value of the q-parameter is N � 1. PFNET (r � 1, q � N � 1) consists of the least number of links, where each path is a minimum-cost path. If there is more than one path connecting the same pair of nodes, they must have the same weight. The tightest triangle inequality (q � N � 1) is normally imposed, in order to achieve a concise Pathfinder network for visualization purposes, and must be maintained throughout the entire network. A Pathfinder network can be generated from an existing minimal spanning tree (MST) of the original network by including additional links, provided new links do not violate the triangle inequality. In fact, the minimum-cost Pathfinder network (MCN) is the set union of all the possible MSTs so that the structure of an MCN is unique for each original proximity network. The software allows us to choose an MST instead of a PFNET to represent a large network. Figure 2.9 illustrates how the triangle inequality filter works and how its outcome should be interpreted. Suppose there are three papers: A, B, and C. Paper A describes LSI. Paper B is about information visualization. Paper C applies LSI to an information visualization design. The relationship between papers A and B is established by the content of Paper C. Therefore the path along links y and z reflects the nature of this relationship more profoundly than link x does. Link x becomes redundant and should be removed. Graphical representations of Pathfinder networks are generated using forcedirected graph drawing algorithms (Fruchterman and Reingold, 1991; Kamada and Kawai, 1989), which are increasingly popular in information visualization because they tend to lay out similar nodes near to one another, and put dissimilar ones farther away. Similar algorithms are used by Bead (Chalmers, 1992) and SPIRE (Hetzler et al., 1998). The value of Pathfinder network scaling in visualization is its ability to reduce the number of links in a meaningful way, which results in a concise representation of clarified proximity patterns, a desirable feature for visualizing a complex structure. Pathfinder networks provide not only a fuller representation of the salient semantic structures than minimal spanning trees, but also a more accurate representation of local structures than multidimensional scaling techniques. Let us compare two Pathfinder networks, based on the same set of papers from the CHI 96 proceedings, but with different q parameters. The link structure in Figure 2.10, PFNET(r � 2, q � 1), keeps all the links derived from the proximity data. The meaning of q � 1 is that the triangle inequality is not imposed on alternative paths consisting of two or more links. In contrast, the link structure in Figure 2.11, PFNET (r � 2, q � N � 1), preserves only paths that have the minimal weights, in order to highlight salient relationships with an improved clarity. Such simplified graphs provide a natural basis for an overview map of the information space.
02
13/05/04
50
18:30
Page 50
Information Visualization
Figure 2.10 CHI 96 papers visualized with all the available paths. Source: Chen (1997a).
Figure 2.11 CHI 96 papers visualized with PFNET links only. Source: Chen (1997a).
Pathfinder networks have demonstrated various useful features in co-citation studies (Chen, 2003; White, 2003b). However, the Pathfinder network-scaling algorithm has its limitations. In order to achieve a network of high clarity and legibility, it is necessary to impose the so-called triangular inequality throughout the network. While this requirement leads to the simplest representation of the essence of an underlying proximity network, this is at a considerable computational cost. Additionally, as the size of the original network increases, the algorithm requires a considerable amount of memory to run. Therefore, it would be desirable if either an equivalent but more efficient algorithm can be developed, or a hybrid approach can be used to achieve cost-effectiveness. In contrast, MST algorithms such as Kruskal’s algorithm and Prim’s algorithm can be efficiently implemented, but may not capture local structures as accurate as Pathfinder. Now the question is how these properties influence the visualized network evolution. To our knowledge, this issue has not been specifically addressed.
02
13/05/04
18:30
Page 51
Extracting Salient Structures
51
One of the problems in visualizing complex networks is caused by their structural complexity. A number of algorithms are available to reduce the complexity of a network by reducing the number of links but maintaining the most salient structure untouched; commonly used algorithms include minimum spanning trees (MSTs) and the relatively less known Pathfinder networks (PFNETs). Pathfinder networks are a generalization of MSTs in that an MST is a special subset of a Pathfinder network. The algorithm is originally developed by cognitive scientists to build procedural models based on subjective ratings (Chen, 1998a,b; Chen & Paul, 2001; Schvaneveldt, 1990). The unique advantage of the Pathfinder algorithm is that it can remove a large number of links and retain the most important ones by using a more sophisticated elimination mechanism as compared to, for example, MST. It has increasingly become a strong candidate in a series of KDViz studies (Chen et al., 2001; Chen et al., 2002; Chen and Kuljis, 2003; White, 2003b). The goal of applying the Pathfinder algorithm is, in essence, to prune a dense network to its backbone structure. The topology of a Pathfinder network is determined by two parameters r and q. The r parameter is used to define a metric space over a given network based on the Minkowski distance so that one can measure the length of a path connecting two nodes in the network. The Minkowski distance becomes the familiar Euclidean distance when r � 2. A particularly interesting case is when r � �, in which the weight of a path is defined as the maximum weight of its component links, which is why it is also called the maximum value distance. Given a metric space, a triangle inequality can be defined as: wij � ( k wnr knk�1)1/r where wij is the weight of a direct path between i and j, wnknk�1 is the weight of a path between nk and nk�1, for k � 1, 2, …, m. In particular, i � n1 and j nk. In other words, the alternative path between i and j may go all the way round through nodes n1, n2, …, nk as long as each intermediate link belongs to the network. If wij is greater than the weight of alternative path, then the direct path between i and j violates the inequality condition. Consequently, the link i � j will be removed because it is assumed that such links do not represent the most salient aspects of the association between the nodes i and j. The q parameter specifies the maximum number of links that alternative paths can have for the triangle inequality test. The value of q can be set to any integer between 2 and N � 1, where N is the number of nodes in the network. If an alternative path has a lower cost than the direct path, the direct path will be removed. In this way, Pathfinder reduces the number of links from the original network, while all the nodes remain untouched. The resultant network is also known as a minimum-cost network. However, this is a computationally expensive algorithm; the published algorithm is in the class of O(N 4) (Figure 2.12). KDViz approaches built on the Pathfinder network scaling algorithm have a potential bottleneck if one needs to deal with larger and larger networks. The strength of Pathfinder network scaling is its ability to derive more accurate local structures than other comparable algorithms such as multidimensional scaling (MDS) and minimum spanning tree (MST). The best results are achieved when q � N � 1 and r � �; not surprisingly, this is also the most expensive because all the possible paths must be examined for each link. In addition, the algorithm requires a large amount of memory to store
02
13/05/04
18:30
Page 52
52
Information Visualization
Figure 2.12 Pathfinder’s inner loop is in the order of O(N4).
the intermediate distance matrices. These scalability problems are the major motivations for us to consider a divide-and-conquer strategy.
2.6 Generalized Similarity Analysis Generalized similarity analysis (GSA) is a unifying framework developed through a series of studies in structuring and visualizing complex information spaces (Chen, 1997a, b, 1998a, b; Chen and Czerwinski, 1997, 1998). GSA aims to provide a consistent framework, with associated modeling and visualization tools, to extract and transform a wide variety of structures inherited in a collection of documents into spatial models. For example, a number of inter-document similarity matrices have been derived: content-based similarity, cross reference-based similarity, and usage pattern-based similarity.A key element is the use of Pathfinder network scaling techniques (Schvaneveldt et al., 1989). Visualizing a complex graph often needs to address a challenging problem, caused by an excessive number of links. In a spatial layout of a network representation with a large number of links, fundamental patterns may be lost in a cluttered display, and users may experience a cognitive overload. Pathfinder network scaling simplifies the structure of a network by extracting and displaying only the most salient relationships, and eliminating redundant or counter-intuitive ones from the original network. Pathfinder has some desirable features over techniques, including multidimensional scaling (MDS). In our earlier work (Chen, 1997a), we used the classic vector space model with tf idf weighting (Salton et al., 1994) to compute interdocument similarities. However, the vector space model is subject to an assumption that terms used in document vectors are independent, and it was realized that this assumption may oversimplify the interrelationships between the use of particular terms and their context, consequently leading to counter-intuitive results. Latent semantic indexing (LSI) (Deerwester et al., 1990) was subsequently incorporated into the framework, in order to reveal underlying semantic structures as reflected through a collection of publications in a specific subject domain. (See Sections 2.5.3 and 2.3.3, respectively, for more detailed descriptions of Pathfinder network scaling and LSI.)
02
13/05/04
18:30
Page 53
Extracting Salient Structures
53
The development of GSA was initially based on three distinct interconnectivity models associated with documents on the web: hypertext linkage, term distributions, and navigation patterns. These three examples are included in order to illustrate the extensibility of the framework.
2.6.1 Scalability of Networks Visualizing complex information structures must address two different types of scalability issue: the size of the network (in terms of the number of nodes), and the density of the network (in terms of the number of links). SHADOCS is a document retrieval system that incorporates interactive dynamic maps into the user interface (Zizi and Beaudouin-Lafon, 1994). A large set of document descriptors is divided into smaller clusters using a dynamic clustering technique. Graphic overview maps are generated on the screen using a space-filling algorithm; each region in a map corresponds to a cluster of descriptors. The size of a region is proportional to the relative importance of those descriptors in the underlying documents. On the one hand, a large network can be separated into a number of smaller networks by dynamic clustering algorithms, for example in SHADOCS. On the other hand, a density-related scalability issue remains a relatively challenging one. The maximum number of links in a network consisting of N nodes is N2. When we deal with a network with a large number of nodes, we must also deal with an even larger number of links. A commonly used strategy is to set a threshold, and consider only links whose weights are above the threshold. For instance, SHADOCS uses a straightforward threshold to control the number of links to be displayed on the screen map. However, threshold values may not adequately reflect the intrinsic structure of a network. As a result, a pruned network may look rather arbitrary, and incompatible with the layout nodes. Scalability is the ability to maintain the original integrity, consistency, and semantics associated with the network representation of an implicit structure. In the next section, this challenging problem is addressed in a more harmonious way, by a useful approach based on Pathfinder network scaling algorithms.
2.6.2 Hypertext Linkage The structure of a network can be represented as a matrix. A network of a hypertext with N document nodes can be represented as a distance matrix, an N N matrix. Each element dij in the matrix denotes the distance between node i and j. Botafogo et al. (1992) introduced two structural metrics, the relative out centrality (ROC) and relative in centrality (RIC) metrics, to identify various structural characteristics of a node. A node with a high ROC would be a good starting point to reach out for other nodes, while a node with a high RIC should be readily accessible. Using a highROC node as a starting point, the structure of the hypertext can be transformed into one or more hierarchies. Botafogo et al. suggest that large hierarchies may be displayed with fisheye views, which balance local details and global context (Furnas, 1986). Chapter 4 includes several examples of how hierarchical structures can be visualized, using fisheye and hyperbolic views.
02
13/05/04
18:30
Page 54
54
Information Visualization
HyPursuit is a hierarchical network search engine based on semantic information embedded in hyperlink structures and document contents (Weiss et al., 1996). HyPursuit considers not only links between two documents, but also how their ancestor and descendant documents are related. For example, if two documents have a common ancestor, they are regarded as more similar to each other. In HyPursuit, document similarity by linkage is defined as a linear combination of three components: direct linkage, ancestor, and descendant inheritance. More recently, the design of a very large web search engine, known as Google, also relies on hypertext links to enhance the precision of search results. The Google search engine is described in Chapter 4. Pirolli et al. (1996a) at Xerox also use hypertext links to characterize web documents. Documents in a web locality, a closed subset of WWW documents, can be represented by feature vectors based on attributes such as the number of incoming and outgoing hyperlinks of a document, how frequently the document has been visited, and content similarities between the document and its children. These feature vectors can be used to describe the nature of a page and predict the interests of visitors to that page. In generalized similarity analysis (GSA), document proximity is defined based on similarities between documents. The document similarity by hypertext linkage in GSA is defined as follows: simijlink �
linkij N
∑ linkik
k�1
where linkij is the number of hyperlinks from document Di to Dj in a collection of N documents from the WWW, for example, from a particular server or on a specific topic. Higher-order interrelationships with ancestors and descendants are not considered, because they can be resolved by Pathfinder network scaling algorithms. This definition allows asymmetrical as well as symmetrical relationships between documents. The Pathfinder network scaling algorithms can handle both symmetric and asymmetric data. Without losing generality, we assume that these measures are symmetric unless otherwise stated. According to this definition, a similarity of 0 between two documents implies linkij � 0, which means that one document is not linked to the other at all. On the other hand, a similarity of 1 implies linkik � 0 for all the k j, which means that the two documents are connected by hyperlinks to each other, but not to any other documents. Figure 2.13 shows the structure of a WWW site (SITEA) according to hypertext linkage. Pathfinder extracted 189 salient relationships from 1503 initial similarity measures. The spring energy in this PFNET is less than 0.005 (four isolated nodes are not shown). Structural analysis based on hypertext links can be used to detect general interests from one website to others. Chen et al. (1988a) present a connectivity analysis of the web sites of computer science departments in 13 universities in Scotland. Figure 2.14 shows the number of outgoing hypertext links from each of the 13 departmental websites in Scottish universities. Table 2.3 shows the top ten American and British commercial websites most frequently cited by the 13 Scottish computer science sites. A commercial site was
02
13/05/04
18:30
Page 55
Figure 2.13 The structure of SITEA with 198 salient hyperlinks, shown as a PFNET(q � N � 1 � 126, r � �).
Figure 2.14 Outgoing hyperlinks from each of the 13 Scottish university sites. Source: Chen et al. (1998a).
Table 2.3 Top ten most popular American and British commercial sites cited by Scottish universities (Data: Aug/Sept, 1996) Rank
US Site
Count
Type
UK Site
Count
Type
1 2 3 4 5 6 7 8 9 10
Java Yahoo AltaVista Lycos Microsoft AT&T research Netscape NBA Digital research Lights
188 124 34 29 30 51 32 36 44 36
Software Search Engine Search Engine Search Engine Software Research Software Sport/Music Research Others
Demon Telegraph Bookshop Web13/Future Cityscape Nexor OUP Almac Musicbase Virgin Records
63 27 35 28/28 26 34 16 16 18 17
ISP Media Publisher ISP/Media Media ISP Publisher ISP Sport/Music Sport/Music
02
13/05/04
56
18:30
Page 56
Information Visualization
identified by its domain name, i.e. .com for an American site, and .co.uk for a British site. They were ranked by the number of unique Scottish sites that linked to them. For example, 10 out of 13 Scottish sites had links to Java Development Toolkit at java.sun.com, at the time of the analysis. An interesting pattern emerged. Links to American sites were dominated by companies providing leading Internet-related technologies and services, such as Java programming tools, Yahoo and AltaVista. On the other hand, links to British sites were predominated by mass media and entertainment such as the Daily Telegraph and Channel 4 (at www.cityscape.co.uk). The profile of top-ranked popular commercial sites is mapped into a twodimensional configuration using multidimensional scaling (MDS). Each site is represented as a vector, based on how frequently it was referenced across the 13 Scottish sites. The frequencies are standardized over all the Scottish sites, to minimize the bias towards large sites in Scotland. Figure 2.15 shows the MDS map generated by SPSS, a popular statistical package. It explains 85% of the variance. Annotations in the map are added by hand with lines, to highlight sites that are similar to each other. Along Dimension 1, research laboratories in large American companies are located on the one hand, namely, AT&T and Digital, while two sites at the other end are particularly devoted to music, e.g., Virgin Music Group (VMG). In contrast, Dimension 2 may reflect some aspects of particular cultures. For example, National Basketball Association (NBA) (American) is on the top map, whereas the Daily Telegraph (British) is at the bottom. The positions of Yahoo and AltaVista suggested some connections to the generic nature of their indexing and search facilities. On the other hand, popular British commercial sites clearly reflected the British culture, for example, Daily Telegraph, Channel 4, and Oxford University Press (OUP).
Figure 2.15 The profile of the most popular American and British commercial sites to Scottish universities. Source: Chen et al. (1998a).
02
13/05/04
18:30
Page 57
Extracting Salient Structures
57
2.6.3 Content Similarity The vector-space model was originally developed for information retrieval (Salton et al., 1994, 1996). It is an influential and powerful framework for analyzing and structuring documents. Each document is represented by a vector of terms, and terms are weighted to indicate how important they are in representing the document. The distance between two documents can be determined according to corresponding vector coefficients. A large collection of documents can be split into a number of smaller clusters such that documents within a cluster are more similar than documents in different clusters. By creating links between documents that are sufficiently similar, Salton et al. automatically generated semantically-based hypertext networks using the vector-space model (Salton et al., 1994). In GSA, we have several options to derive interdocument similarities according to term distributions. These may include, among others, the classic vector space model, the latent semantic indexing model, and dice coefficients. The following example is based on the well-known tf idf model, term frequency inverse document frequency, to build term vectors. Each document is represented by a vector of T terms with corresponding term weights. The weight of term Tk to document Di, is determined by: N tfik log nk
wik � T
∑ (tfij )
2
j�1
N log nj
2
where tfik is the occurrences of term Tk in Di, N is the number of documents in the collection (such as the size of a WWW site), and nk represents the number of documents containing term Tk. The document similarity is computed as follows, based on corresponding vectors: Di � (wi1, wi2, …, wiT) and Dj � (wj1, wj2, …, wjT): simijcontent �
T
∑ wik w jk
k�1
Figure 2.16 shows a PFNET for another departmental WWW site, SITEB, with 172 HTML documents. The network has 172 nodes and 242 links. The screen display becomes crowded even if numerical IDs are used in the graphical representation. This is an example of the famous “focus versus context” problem: users need to access local details, while maintaining a meaningful context. In order to resolve this problem, virtual reality modeling language (VRML) comes into play. VRML provides not only new ways of interacting with graphic representations in a two- or three-dimensional space, but also a new metaphor of interaction, ranging from individual use to collaborative work. A graph representation takes shape as the overall spring energy reduces below a threshold given in advance. Figure 2.17 shows the node placement process for CHI
02
13/05/04
18:30
Page 58
58
Information Visualization
96 papers at six discrete points. The value of spring energy at each point is given at the right-hand corner. For example, at an early stage, the energy of the spring system is 0.999, the energy is systematically reduced to 0.900, 0.500, 0.200, 0.100, and eventually the process is terminated at the threshold, 0.005.
Figure 2.16 The structure of SITEB by content similarity, preserving 242 links (PFNET, q � N � 1 � 171, r � �). Source: Chen (1997a).
Figure 2.17 The node placement process. Source: Chen (1998b).
02
13/05/04
18:30
Page 59
Extracting Salient Structures
59
2.6.4 State-transition Patterns There is a growing interest in incorporating usage patterns into the design of large, distributed hypermedia systems, notably on the WWW. Access logs maintained by many WWW servers provide a valuable source of empirical information on how users actually access the information on a server, and which documents appear to attract the attention of users. Sequential patterns of browsing indicate, to some extent, document relatedness perceived by users. For example, Pirolli et al. (1996) use the number of users who followed a hyperlink connecting two documents in the past to estimate the degree of relatedness between the two documents. The dynamics of a browsing process can be captured by state-transition probabilities. Transition probabilities can be used to indicate document similarity with respect to browsing, to some advantage. For example, the construction of the statetransition model is consistent with linkage- and content-based similarity models. In our example, one-step transition probability pij from document Di to Dj is estimated as follows: pij �
f (Di , D j ) N
∑ f (Di , Dk )
k�1
where f (Di, Dj) is the observed occurrences of a transition from Di to Dj, and fk (Di, Dk) is the total number of transitions starting from Di. Transition probability pij is used to derive the similarity between document Di and Dj in the view of users: simijusage � pij The following example is based on state-transition patterns derived from server access logs maintained at SITEA. Figure 2.18 shows three Pathfinder networks, corresponding to three bi-monthly access log data between September 1996 and January 1997, associated with external users’ access to the author’s homepage. A number of predominant cycles emerged
Figure 2.18 The structure of SITEA, containing personal web pages, by usage patterns. Source: Chen (1997a).
02
13/05/04
18:30
Page 60
60
Information Visualization
Figure 2.19 The structure of SITEA based on state-transition patterns, shown as a PFNET (q � N � 1, r � �). Source: Chen (1997a).
from the graph. In fact, there seemed to be some correspondence between a cycle and a set of documents of a particular type. For example, the largest cycle corresponds to top-level documents regarding general information about the homepage (Node 7), the page counters and plans. The cycle (17-19-20-21-6-15) corresponds to some research papers. The cycle (21-22-23-33-6) corresponds to documents used in teaching. It also seemed that larger cycles corresponded to deeper browsing sequences, whereas smaller cycles tended to relate to more specific topics and shorter browsing sequences. Node 0 is an artificial node, to indicate the end of a browsing sequence. A total of 22,209 access requests were made between July 30 and September 31, 1996, from 1125 sources. The behavior of the top 30 most active users is used to establish representative behavioral patterns in terms of first-order state transitions. These 30 users account for 10.7% of all the users who visited the site during this period. The number of pages visited by each of these users varied from 13 pages to 115 pages. Figure 2.19 shows a PFNET derived from similarities based on first-order state-transition probabilities. Cluster A is enlarged to Cluster A*. The spike at the lower left half and the ring in Cluster A* essentially associate with master’s student’s project on web-based interface design. The spike at the upper right half corresponds to some research papers on hypertext. It is possible to integrate several virtual structures derived from the same data using different structural modeling mechanisms. In the following generic formula, an existing hyperlink structure is adjusted, by incorporating the underlying semantic structure derived from content similarities: simijcombined (�ij ) �
�ij • hyperlinksij N
∑
�ik • hyperlinksik k�1 simijlink �content � simijcombined �ij � simijcontent
(
)
02
13/05/04
18:30
Page 61
Extracting Salient Structures
61
Table 2.4 Pearson’s and cosine correlation coefficients among similarities based on linkage, content and usage patterns associated with the SITEA SITEA (N � 127)
Linkage
Content
Usage
Mean Std Dev
0.0735 0.1413
0.1671 0.3121
0.0020 0.0357
SITEA (N � 127)
Pearson
Sig.
Cosine
Linkage–Content Linkage–Usage Content–Usage
0.3201 0.0184 0.0429
0.000 0.017 0.000
0.4682 0.0423 0.0644
where the resultant similarity, simijlink�content, represents a virtual structure, based on both hypertext linkage and term distributions.
2.6.5 Meta-similarities A meta-similarity is an overall estimate of the strength that two similarity variables are related. To illustrate this concept, we computed Pearson’s and cosine correlation coefficients among three sets of similarities associated with the website SITEA, according to hyperlinks, content terms, and usage patterns. A total of 127 valid documents from the SITEA were included in our study. The linkage-content meta-similarity has the highest score on both Pearson’s and cosine correlation coefficients (r � 0.3201 and rc � 0.4682, N � 127) (Table 2.4). The linkage-usage meta-similarity has the lowest score on both Pearson’s and cosine correlation coefficients (r � 0.0184 and rc � 0.0644, N � 127). We analyzed the changes in usage patterns associated with a collection of documents maintained by the author on the WWW over six consecutive months between August 1996 and January 1997. By comparing usage pattern-based similarity measures between adjacent months, it was found that the meta-similarity increased from 0.1967 to 0.4586 over the six months. It appears to be a trend that the meta-similarity is increasing with time. A possible explanation is that usage patterns become increasingly similar as the underlying structure settles down, at least for frequently visited documents. Experimental studies, and a thorough examination of specific documents and associated usage patterns, may lead to further insights into the pattern.
2.6.6 Structuring Heterogeneous Information This example briefly illustrates the design of a novel user interface for exploiting documents accumulated in an information filtering and sharing environment. In addition to visualizing interdocument relationships, the visual user interface reveals the interconnectivity between user profiles and documents. The role of user profiles, based on the notion of reference points, is explored.
02
13/05/04
62
18:30
Page 62
Information Visualization
The exponential growth of widely accessible information in modern society highlights the need for efficient information filtering and sharing. Information filtering techniques are usually based on the notion of user profiles, in order to estimate the relevance of information to a particular person. Jasper is an information filtering and sharing system (Davies et al., 1995), maintaining a growing collection of annotated reference links to documents on the WWW. Currently, the interconnectivity among these accumulated documents and user profiles is not readily available in Jasper. In this chapter, we describe the design of a novel visual user interface in order to uncover the interconnectivity. The concept of reference points was originated in psychological studies of similarity data and spatial density (Kruskal, 1977). The underlying principle is that geometric properties such as symmetry, perpendicularity, and parallelism are particularly useful in communicating graphical patterns. For example, people often focus on structural patterns such as stars, rings and spikes, in a network representation. Reference points, conceptually or visually, play the role of a reference framework in which other points can be placed. In this example, it is hypothesized that a number of star-shaped, profile-centered document clusters would emerge if the role of reference points was activated by user profiles. Users would be able to share information more effectively, based on the additional information provided by user profiles through the visual user interface. Based on a random sample of 127 documents and 11 user profiles from Jasper, the heterogeneous information structure is visualized within the generalized similarity analysis (GSA) framework. First, we extract and preserve only the most salient semantic relationships, in order to reduce the complexity of the visualization network. Second, we incorporate user profile-based reference points in order to improve the clarity of the visual user interface. Unique behavioral heuristics are applied to distinguish user profiles and documents, in order to speed up the convergence of our self-organized clustering process. These emergent structures are derived without any prior knowledge of structural relationships. Additional structural cues are likely to result in more efficient results. The impact of user profile-based reference points can be seen in Figure 2.20. The left sub-figure shows the self-organized spatial layout without using the mechanism of reference points. The sub-figure in the middle shows the layout if the mechanism of reference points was utilized.
Figure 2.20 The role of reference points: disabled (left), enabled (middle), and a close-up look at a cluster (right) (cube � profile; sphere � document).
02
13/05/04
18:30
Page 63
Extracting Salient Structures
63
In fact, the 11 user profiles, which make up merely 8% of the 138 nodes, were associated with 69% of the links in the network, whereas the remaining 127 documents, which make up 92% of the nodes, only shared 31% of the links. Reference points have clearly improved the clarity of the overall structure. Users may now track relevant documents based on their knowledge of their colleagues’ expertise. The quality of information visualization can be improved by incorporating user profile-based reference points, which is potentially useful for visual user interface design. The focus of empirical analyses on this type of visual user interface is usually the human factors. There are many usability evaluation methodologies available to assess whether a particular design feature, or the entire ecological system, is appropriate for users.
2.7 Summary In this chapter, we have introduced several major aspects of information visualization: structural modeling, in particular, the use of the vector space model and its variants, multidimensional scaling and trajectory mapping. There was also an introduction to the generalized similarity analysis (GSA) framework, giving several examples to illustrate its extensibility and flexibility. More examples are cited in subsequent chapters. The next chapter focuses on graphic representation, another fundamental aspect of information visualization, introducing some of the most popular and advanced spatial layout algorithms.