Hydrology and Earth System Sciences Discussions
Department of Hydrogeology, Helmholtz-Centre for Environmental Research (UFZ), 06120 Halle, Germany 2 Remote Sensing Group, Institute of Geology, Freiberg University of Mining and Technology, 09599 Freiberg, Germany
Discussion Paper
1
HESSD 8, 1399–1431, 2011
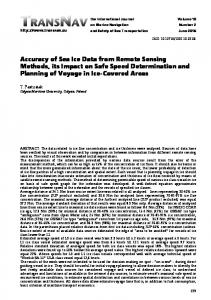
Extraction of lineaments from remote sensing data U. Mallast et al.
Title Page Abstract
Introduction
Conclusions
References
Tables
Figures
J
I
J
I
Back
Close
|
1 ¨ U. Mallast1,2 , R. Gloaguen2 , S. Geyer1 , T. Rodiger , and C. Siebert1
Discussion Paper
Semi-automatic extraction of lineaments from remote sensing data and the derivation of groundwater flow-paths
|
This discussion paper is/has been under review for the journal Hydrology and Earth System Sciences (HESS). Please refer to the corresponding final paper in HESS if available.
Discussion Paper
Hydrol. Earth Syst. Sci. Discuss., 8, 1399–1431, 2011 www.hydrol-earth-syst-sci-discuss.net/8/1399/2011/ doi:10.5194/hessd-8-1399-2011 © Author(s) 2011. CC Attribution 3.0 License.
|
Received: 22 December 2010 – Accepted: 7 January 2011 – Published: 28 January 2011
Published by Copernicus Publications on behalf of the European Geosciences Union.
|
1399
Discussion Paper
Correspondence to: U. Mallast (
[email protected])
Full Screen / Esc
Printer-friendly Version Interactive Discussion
5
Discussion Paper |
1400
|
25
Discussion Paper
20
Since Hobbs (1904) introduced the term lineament, it was used in different fields (e.g. petrology, geology and hydrogeology) as indicator for remote detection of the respective objects of interest. O’Leary et al. (1976, 1467) define lineaments “as a mappable, simple or composite linear feature of a surface whose parts are aligned in a rectilinear or slightly curvilinear relationship and which differ from the pattern of adjacent features and presumably reflects some sub-surface phenomenon”. In terms of groundwater it is apparent that fractures and faults have surface expressions and thus can serve as indicator for water flow-paths (Anisimova and Koronovsky, 2007; Dinger et al., 2002; Fernandes and Rudolph, 2001; Meijerink et al., 2007). To prove that applicability of
HESSD 8, 1399–1431, 2011
Extraction of lineaments from remote sensing data U. Mallast et al.
Title Page Abstract
Introduction
Conclusions
References
Tables
Figures
J
I
J
I
Back
Close
|
1 Introduction
Discussion Paper
15
|
10
We describe a semi-automatic method to objectively and reproducibly extract lineaments based on the global one arc-second ASTER GDEM. The combined method of linear filtering and object-based classification ensures a high degree of accuracy resulting in a lineament map. Subsequently lineaments are differentiated into geological and morphological lineaments to assign a probable origin and hence a hydro-geological significance. In the western catchment area of the Dead Sea (Israel) the orientation and location of the differentiated lineaments are compared to characteristics of known structural features. The authors demonstrate that a strong correlation between lineaments and structural features exist, being either influenced by the Syrian Arc paleostress field or the Dead Sea stress field or by both. Subsequently, we analyse the distances between lineaments and wells thereby creating an assessment criterion concerning the hydraulic significance of detected lineaments. Derived from this analysis the authors suggest that the statistic analysis of lineaments allows a delineation of flow-paths and thus significant information for groundwater analysis. We validate the flow-path delineation by comparison with existing groundwater model results based on well data.
Discussion Paper
Abstract
Full Screen / Esc
Printer-friendly Version Interactive Discussion
1401
|
Discussion Paper | Discussion Paper
25
HESSD 8, 1399–1431, 2011
Extraction of lineaments from remote sensing data U. Mallast et al.
Title Page Abstract
Introduction
Conclusions
References
Tables
Figures
J
I
J
I
Back
Close
|
20
Discussion Paper
15
|
10
Discussion Paper
5
lineaments as indicator for either fault systems and/ or assumable preferential groundwater flow-paths many authors compared both features and revealed a strong correlation in shallow and deeper aquifers (Fernandes and Rudolph, 2001; Oguchi et al., 2003; Salvi, 1995; Sander, 1997). Classical approaches of lineament extraction are conducted manually. Based on experience and expert knowledge they can be evaluated as objective but irreproducible and inefficient in terms of time and labour, especially with macroscale focus (Costa and Starkey, 2001; Hung et al., 2005; Sander, 2007; Vaz et al., 2008). Thus, in order to meet reproducible and objective criterions as well as efficiency automated and semiautomated algorithms (segment tracing algorithm (STA), Hough Transform, PCI LINE) were developed (Karnieli et al., 1996). Methodically, semi-automatic and automatic approaches base either on linear, nonlinear and morphological spatial filter (Morris, 1991; Philip, 1996; Suzen and Toprak, 1998), edge tracing and linking methods (Fitton and Cox, 1998; Karnieli et al., 1996; Koike et al., 1995), or knowledge based systems (Argialas and Mavrantza, 2004; Gloaguen et al., 2007; Marpu et al., 2008; Mavrantza and Argialas, 2006). Inaccuracies emerge mostly from the input data, as multispectral or aerial images contain semantic linear features not originating from geological, but from man-made background. Hence, a mostly manually conducted “correction-step” was introduced in many cases excluding non-geologic lineaments (Hung et al., 2005; Kocal et al., 2004). By using digital elevation models (DEM) extracted lineaments solely rely on topography and per se exclude man-made features, if ground sampling distance (GSD) remains in medium scale or coarser. Therefore, DEMs present a promising basis for semi-automatic lineament extraction that was proven by many authors (Gloaguen et al., 2007; Jordan and Schott, 2005; Wladis, 1999). Despite representing only topographical features different authors mention critical aspects concerning lineaments with nongeologic background derived from elevation data (Arenas Abarca, 2006; Jordan and Schott, 2005). Reasons can be related to morphology and lithology causing identical linear topographic expressions that have to be treated carefully.
Full Screen / Esc
Printer-friendly Version Interactive Discussion
Discussion Paper |
2.1 Geology
25
The geological formations of the western mountain range dip fairly eastwards. The base of the western escarpment is represented by Lower Cretaceous sandstones of the Kurnub Group, which crop out in the southern study area. Above, the 800–850 m thick hardly erodible limestones and dolomites of the Judea Group (Cenoman-Turon) are the predominantly formation in the area (Fig. 1b) and constitutes the important Lower
|
1402
Discussion Paper
20
HESSD 8, 1399–1431, 2011
Extraction of lineaments from remote sensing data U. Mallast et al.
Title Page Abstract
Introduction
Conclusions
References
Tables
Figures
J
I
J
I
Back
Close
|
15
The study area is represented by the western direct sub-terranean catchment of the Dead Sea and includes 4160 km2 being located between 34.73◦ E and 35.51◦ E and ◦ ◦ 30.83 N and 32.05 N (Lat/Lon WGS 84). It is comprised of major parts of the Judean Mountains in the west, the Negev desert in the south and the Dead Sea in the east (Fig. 1a). Within the area a topographical west-east altitude gradient of around 1000 m exists between the Judean Mountains and the brim located next to the Dead Sea and a further steep gradient of around 400 m from the brim to the current Dead Sea level of −425 m (WGS84-EGM96), (own GPS measurements March 2010). The entire region is faulted and folded and since Eocene finally shaped and modified by the strike slip movement of the Dead Sea transform (Garfunkel, 2001), which is part of the Syrian-East African Rift system.
Discussion Paper
10
|
2 Geological and structural setting
Discussion Paper
5
Thus, the objective of this study is to (1) present a semi-automatic approach of extracting lineaments based on the global one arc-second ASTER GDEM (ERSDAC, 2009). Derived from the result the authors investigate the (2) lineament distribution in the western catchment of the Dead Sea (Israel) (3) compare it to geological maps and structural data and (4) assess it in terms of hydrogeologic and hydraulic significance. Based on gained information (5) possible groundwater flow-paths that contribute to the Dead Sea are identified and (6) underlined by field and well data.
Full Screen / Esc
Printer-friendly Version Interactive Discussion
– Faults of the Group A have an orientation of around 90◦ (E-W) and are mainly located in the north-western part of the study area. They may results from the Syrian-Arc deformation with the maximum compressive stress trending NNW during Creataceous to Eocene ages (Eyal and Reches, 1983).
|
20
Discussion Paper |
– Group C faults, trending 310◦ to 315◦ (NW-SE) are the result of the compressional phase of the Syrian-Arc deformation during the Turonian. Faults of that type are also described by Gilat (2005) as compressional features that follow TuronianSenonian faults. The distribution within the study area is mainly in the westerly 1403
|
25
◦
Discussion Paper
◦
– Group B is built by faults showing a main NNW-SSE orientation (330 to 360 ) that are found from the north-western corner till the Dead Sea region, where their abundance increases significantly (Fig. 1b). These structures may be related to the Dead Sea strike-slip transform, activated in the Miocene (Garfunkel and BenAvraham, 1996; Garfunkel, 2001). The major fault within that group is the N-S oriented western fault of the Dead Sea transform.
Discussion Paper
15
|
10
Discussion Paper
5
(L-JGA) and Upper (U-JGA) Aquifers (Guttman, 2000). At the top of the range, the soft Mt. Scopus Group (Senonian-Paleocene) with marl, chalk and clay occurs and reaches thickness of 100 m to 400 m. These variations are controlled by anti- and synclinal structures of the compressional Syrian Arc phase (Flexer and Honigstein, 1984). The entire range is deeply cut by wadis, draining towards the Dead Sea. Products of those Plio-Holocene erosional processes are found within the wadis, their fans and along the Dead Sea coast that are composed of gravel, sand, clay silt, marl and gypsum (Dead Sea Group). On the western border of the study area, the Hebron anticline stretches with a SWNE orientation (Fig. 1b), thus representing a main structural feature. A series of secondary mostly parallel asymmetric anticlines and synclines were developed among smaller fault systems observable throughout the entire area. The principal fault is represented by the western fault of the Dead Sea rhomb-shaped pull-apart basin. The dominating trends of all faults can be categorized into the following groups:
HESSD 8, 1399–1431, 2011
Extraction of lineaments from remote sensing data U. Mallast et al.
Title Page Abstract
Introduction
Conclusions
References
Tables
Figures
J
I
J
I
Back
Close
Full Screen / Esc
Printer-friendly Version Interactive Discussion
2.2 Hydrogeology
5
Discussion Paper | Discussion Paper
25
HESSD 8, 1399–1431, 2011
Extraction of lineaments from remote sensing data U. Mallast et al.
Title Page Abstract
Introduction
Conclusions
References
Tables
Figures
J
I
J
I
Back
Close
|
20
Discussion Paper
15
|
10
|
The major groundwater bearing strata are the Kurnub sandstone and the overlaying limy Judea Group with the two distinct aquifers. Both are hydraulically separated by the Bet Meir Formation, forming an aquiclude composed of clay, marl and chalk with varying thickness (Laronne Ben-Itzhak and Gvirtzman, 2005). Hence, and as a result of the eastwards inclination of the rocks, the L-JGA becomes confined towards the Dead Sea while the U-JGA is entirely phreatic. Where the separating aquicludes locally thin out and deep reaching faults exist, it is assumed that groundwater is able to percolate locally into adjoining aquifers. Consequently, groundwater-flow is defined either structurally or lithologically, meaning heterogeneities in transmissivity forces groundwater to bypass zones of low transmissivity (Guttman, 2000). Precipitation amounts vary between 600 mm/a in the highest elevated parts of the Judea Mountain range and around 100 mm/a along the Dead Sea coast (C. Siebert, personal communication, 2010). However, the precipitation gradient does not decline homogeneously. From the Judean Mountains it slowly decreases towards the brim west of the Dead Sea. Between the brim and the graben the decrease is dramatic as a result of the important change in elevation. The highest amount of the almost solely between October and April occurring precipitation falls on outcrops of the Judea Group aquifers. This aspect makes the west of the study area to the major region of recharge (Guttman, 2000). The highest natural discharge of the aquifers in form of springs can be distinguished based on their location (Table 1). Approaching the Dead Sea the spring discharges rise from low values at hinterland springs (Quilt, Jericho) to high values at the northern springs (Feshka, Kane & Samar) along the DS to decrease again at the southern springs (Kedem, Ein Gedi). Based on isotopic analysis it can be concluded that 1404
Discussion Paper
central part and in the north of the study area extending the western fault of the Dead Sea towards NW.
Full Screen / Esc
Printer-friendly Version Interactive Discussion
3 Methodology
Discussion Paper |
1405
|
25
Discussion Paper
20
HESSD 8, 1399–1431, 2011
Extraction of lineaments from remote sensing data U. Mallast et al.
Title Page Abstract
Introduction
Conclusions
References
Tables
Figures
J
I
J
I
Back
Close
|
15
The study bases on the ASTER GDEM with a GSD of 30 m being adequate for a medium scale study (Abdullah et al., 2009; Hung, 2007) (Fig. 2). During the first step, a median filter with a matrix of 30 × 30 is calculated. The usage of a 30 × 30 filter size contains the risk to suppress smaller structures with a pulse function having the size of less than one-half of the matrix (Pratt, 2007). However, the advantages prevail as it eliminates artefacts inherited in the DEM and equally preserves topographic structures like ridges, ramps, peaks and steps usually having either sizes above one-half of the matrix or do not represent a pulse-function (Quackenbush, 2004; Yang and Huang, 1981). Subsequently, a set of 2nd order Laplacian linear filters of four main directions (N; NW; W; SW) introduced by Pratt, (2007) is applied using a 5 × 5 matrix (Fig. 3). The result enhances all edges that are defined by a series of adjacent pixels of similar high value which we assume here representing topographic features. The advantage of using 2nd order filter is the accentuation of edges that are marked a significant spatial change in the second derivative (Pratt, 2007; Wladis, 1999). Together with the small matrix that enhances even small structures without neglecting large ones as suggested by Wladis (1999) this type of filters provides a good basis for a subsequent object-based classification. Concluding the linear filtering step, all directional images were merged to one omni-directional image keeping the maximum value of a pixel from all directional images (Fig. 3).
Discussion Paper
10
3.1 Pre-processing
|
5
Discussion Paper
spring water is fed by the U-JGA and derived from precipitation in the recharge area (C. Siebert, personal communication, 2010). Only for the Kedem and Mazor springs a mixture of both Judea Group Aquifers is assumed (Guttman, 2000).
Full Screen / Esc
Printer-friendly Version Interactive Discussion
5
| Discussion Paper |
1406
Discussion Paper
25
HESSD 8, 1399–1431, 2011
Extraction of lineaments from remote sensing data U. Mallast et al.
Title Page Abstract
Introduction
Conclusions
References
Tables
Figures
J
I
J
I
Back
Close
|
20
Discussion Paper
15
|
10
The above described omni-directional image serves as basis for the object-based classification using Imagine Objective (ERDAS). Within this approach firstly the authors conducted a classification based on 30 manually chosen training samples including background and objective pixels. The resulting probability image contains a value range of 0 to 1 with high numbers representing objective pixels. During the second step, a combined threshold and clump algorithm is applied converting the image into a binary image by assigning pixels with a threshold of ≥0.8 to 1 and remaining pixels to 0 with a concurrent contiguity operation. After segmenting the image into primitive objects (Marpu et al., 2008), we applied a size filter to exclude objects with less than 20 pixels. Subsequently we perform a mathematical morphology closing. First, a dilation operation is performed twofold to concretize and simplify the neighbourhood connectivity of adjacent pixels. This morphological operation increases the objects by one pixel on their boundaries per iteration. As a possible effect, gaps within the object or between near objects are closed (Costa and Starkey, 2001; Pratt, 2007). The concatenated erosion operation then removes single not connected pixels. Concluding, almost explicitly connected pixels are left and represent different topographic features. Both combined processes clear boundary irregularities of pixel objects enhancing further processing (Costa and Starkey, 2001). To vectorize the so far simplified and exaggerated pixel-objects the implemented “centerline convert” algorithm was applied to thin the pixel objects to lines (ERDAS, 2008). At that point, we defined suitable line-link parameters based on own criteria by including maximum gaps between line-ends (300 m), minimum output-lengths (390 m), minimum link-lengths (210 m) and tolerance (30 m). The criteria are selected to focus more on the detection of small lineaments and furthermore to use less interpolation in between detected lineaments. The synergetic effect of both criteria represents most likely the closest possible image to reality.
Discussion Paper
3.2 Object-based image analysis
Full Screen / Esc
Printer-friendly Version Interactive Discussion
5
Discussion Paper |
1407
|
25
As briefly mentioned before, lineaments directly derived from elevation data solely rely on topographic features. Thus, man-made features such as streets, canals, field boundaries etc. can per se be excluded for the study area as they are not contained in the ASTER GDEM DEM.
Discussion Paper
3.4 Differentiation of lineaments
HESSD 8, 1399–1431, 2011
Extraction of lineaments from remote sensing data U. Mallast et al.
Title Page Abstract
Introduction
Conclusions
References
Tables
Figures
J
I
J
I
Back
Close
|
20
Discussion Paper
15
|
10
Initially, we intended to compare the result of the object-based approach to a result produced by the widely applied PCI algorithm LINE (PCI Geomatics). The basic approach is similar as the previous algorithm besides the fact that the LINE algorithm bases on the robust Canny edge detection algorithm. This algorithm filters the DEM with a Gaussian function depending on the chosen RADI from which subsequently the gradient is computed. These pixels that do not represent a local maximum are suppressed. The next step binarizes the image being controlled by a threshold value (GTHR), a thinning algorithm is applied and followed by a vector conversion to extract lines. Defining parameters include (LTHR) for a specified minimum pixel size, (FTHR) for fitting lines and (ATHR) and (DTHR) for linking lines over a specified distance and angular difference (Kocal et al., 2004). Based on this knowledge and the chosen parameters (Table 2) we expected to have small differences but general agreement between the results. After comparing the results it could clearly been seen that the expectations are met, yet some larger lineaments from LINE are not detected using the object-based approach. Vice-versa, smaller lineaments are detected by the object-based approach not being detected by the LINE approach. Hence, to obtain a complete and complementary lineament map the authors combined both lineament results. Thereby, identical lineaments detected by both approaches are singularized during a GIS analysis. The focus was on smaller lineaments as they represent to high degree the objective topographic differences (Fig. 4).
Discussion Paper
3.3 Combination with PCI line algorithm
Full Screen / Esc
Printer-friendly Version Interactive Discussion
| Discussion Paper
25
|
The drainage vector layer that was calculated with the eight-direction (D8) flow model incorporated in ArcMap 9.3 contains steadily changing orientations of drainage lines over pixel distances (30 m). Therefore, in order to be able to objectively compare the drainage system to the lineament map in terms of orientation we generalize the drainage vector lines over a span of 180 m. The resulting vector layer contains rather straight lines but keeps the general orientation. This process ensures an enhanced 1408
Discussion Paper
3.4.1 Drainage system
HESSD 8, 1399–1431, 2011
Extraction of lineaments from remote sensing data U. Mallast et al.
Title Page Abstract
Introduction
Conclusions
References
Tables
Figures
J
I
J
I
Back
Close
|
20
Discussion Paper
15
|
10
Discussion Paper
5
However, in (semi-) arid regions abrupt changes in topography resulting in linear morphological expressions are not necessarily bound to tectonic processes. Instead, erosion (aeolian/fluvial) and different resistivities of rocks can be responsible (Arenas Abarca, 2006; Jordan et al., 2005; Sander, 1997). Though, interaction of tectonic and erosion processes surely occurs. Tectonic processes weaken the earth crust forming fractures. Thereby, the erosion resistance is lowered. Water flows along the least resistance downhill following and enhancing the fractures due to its erosive character. This process determines the drainage system orientation and linear flow structures enhanced by erosion but initialized by tectonic processes before (Nur, 1982). Furthermore, edges or brims of different geological formation representing linear structures may also be caused by tectonical processes initially. We assumed the lineaments to be statistically representative of tectonic structures and therefore as preferential flowpaths potentially indicating subsurface flow. However, to characterize the hydrogeologic importance of lineaments we use ancillary data (drainage system information, geological maps) as suggested by Jordan et al. (2005) and Sander (2007) to strongly improve our results. Accounting for these aspects the produced lineament map, geological maps (1:200 000) and a derived drainage system from the same DEM are incorporated into a GIS and subsequently differentiated into geological lineaments (true structural origin) and morphological lineaments (mainly morphological origin with possible structural background).
Full Screen / Esc
Printer-friendly Version Interactive Discussion
Discussion Paper
3.4.2 Geological map
|
10
Discussion Paper
5
result during the following comparison. Afterwards, all lines were split at their nodes to be able to assign correct vectors to each line segment. Additionally to the vector, the length of each line segment was calculated. Within the lineament layer we calculated the Euclidean distance to the nearest line segment of the drainage layer (“Near” function of ArcGIS 9.3) and assigned the corresponding orientation. This forms the basis for the subsequent automatic comparison of the drainage and lineament layer that was conducted within the attribute table of the lineament layer. Selected parameters include (1) 500 m distance between both, assuming that depth-line of valleys and valley shoulders in the study area are within that distance and (2) an angle difference of ±20◦ for at least 20% of the line segment to account for either generalization errors or slightly atypical shaped valleys. Lineaments that fulfil these requirements are characterised as morphological lineaments.
HESSD 8, 1399–1431, 2011
Extraction of lineaments from remote sensing data U. Mallast et al.
Title Page Introduction
Conclusions
References
Tables
Figures
J
I
J
I
Back
Close
|
Abstract
20
|
1409
Discussion Paper
25
After comparing lineaments to structural features and subsequently evaluating their geologic significance, the hydraulic significance of lineaments needs to be assessed in order to gain information for the possibility of deriving groundwater flow-paths. Under the assumption that lineaments close to wells by contrast to lineaments further
|
3.5 General assessment of hydraulic significance and derivation of flow-paths
Discussion Paper
15
Due to the lack of a digitized geological map, which would have made the process of characterization similarly objective as in the step before, we visually compared all lineaments to the scanned and co-referenced geological map. In order to define lineaments most likely being induced by edges of geological formation, a buffer of 300 m around each detected lineament was created and compared with lithological boundaries of the geological map. Each lineament being located within this buffer to a lithological boundary and with a similar orientation was characterized as morphological lineament as well.
Full Screen / Esc
Printer-friendly Version Interactive Discussion
Discussion Paper |
1410
|
25
Discussion Paper
20
751 lineaments with lengths varying between 376 m and 9647 m were detected in total (Fig. 5). A lineament density analysis was performed for a first descriptive evaluation of the lineament map. The density map applying a 5 km search radius exhibits primarily a higher lineament density in the northern and north-western parts of the study area. Secondarily, lineament density areas are located along the western fault of the Dead Sea extended by an additional high density spot in the south-east. It is apparent that lineaments within these high-density areas have smaller lengths compared to those in lower density regions.
HESSD 8, 1399–1431, 2011
Extraction of lineaments from remote sensing data U. Mallast et al.
Title Page Abstract
Introduction
Conclusions
References
Tables
Figures
J
I
J
I
Back
Close
|
4 Results
Discussion Paper
15
|
10
Discussion Paper
5
away reflect the probable hydraulic flow conditions, we calculate the Euclidean distance to the nearest well location for each lineament. Additionally, a parallel comparison to mapped faults of similar scale (structural map 1:200 000) is conducted to define a second assessment criterion. We assume all water wells, mostly located in the north and western study area (Fig. 1a), to produce water since only coordinates, name and well type were available. The same assumption applies for oil and gas wells based on Salhov et al. (1982) who described water fluxes being encountered during drilling. The data basis stems from Laronne Ben-Itzhak and Gvirtzman (2005), Mekorot Co. Ltd. (2007), Tel Aviv University (2007) for water wells and Fleischer and Varshavsky (2002), for oil wells. The general assessment of the hydraulic significance of the lineament map enables the possibility to infer general ground water flow-paths under the co-consideration of topography and outlets (springs). Topography provides the general flow as water tends always to the lowest point. Lineaments in contrast, present a rather defined local flow direction characteristic whereas springs represent the final outlet of the system. Taking all facts into account we visually and manually derived the most probable groundwater flow-paths by drawing vector lines on the plotted 3-D surface and lineament map.
Full Screen / Esc
Printer-friendly Version Interactive Discussion
1411
|
Discussion Paper | Discussion Paper
25
HESSD 8, 1399–1431, 2011
Extraction of lineaments from remote sensing data U. Mallast et al.
Title Page Abstract
Introduction
Conclusions
References
Tables
Figures
J
I
J
I
Back
Close
|
20
Discussion Paper
15
|
10
Discussion Paper
5
The frequency-rose diagram (Fig. 5) illustrates the strike directions of all detected lineaments and additionally the differentiation of geological and morphological lineaments. The diagram of all lineaments (Lineaments total) displays that two main strike ◦ ◦ directions are prominent. Most lineaments are oriented around 0–5 and 30–40 . A smaller amount strikes between both main trending directions. Equally noticeable is a similar frequency distribution of lineaments with an orientation between 290◦ to 340◦ ◦ ◦ ◦ ◦ and 45 to 60 . Apparently, only few lineaments have an orientation of 90 or 270 . Splitting the total lineaments in the detected geological and morphological lineaments reveals that geological lineaments match the main strike directions of the total lineaments almost explicitly. Small numbers represent orientations around 315◦ to 350◦ but none are around 90◦ or 270◦ . For the morphological lineaments three main strike directions are detected: (a) 295– ◦ ◦ ◦ 330 (b) 0–5 (c) 35–65 . Most of the lineaments belonging to group b are assigned to be of morphological origin due to their lithological-boundary characteristic (Fig. 6). A smaller number of lithological-boundary induced lineaments display strike directions of 295–300◦ (group a) and 50–55◦ (group c). Similar strike directions as group a and group c with an even higher frequency can be observed at the fluvial induced lineaments. Equally striking is the fact that less northern and only few western orientated lineaments are represented. Considering the distance from lineaments to wells within the 500 m and 1000 m classes shows that the number of morphological lineaments (n = 26/n = 19) is above the number of geological lineaments (n = 15/n = 17) (Fig. 7). The smallest distance of both lineament types is comparable within 1 m. Between the 1500 m and the 3500 m class, the number of both types is steadily declining, reaching maximal distances of 3110 m and 2658 m, respectively. Therefore, concerning the distance to wells a clear differentiation of lineament types cannot be conducted. Both types behave equally in distribution and very similarly in total number per class. Prior assumptions of morphological lineaments not having the same significance as geological lineaments concerning groundwater cannot be
Full Screen / Esc
Printer-friendly Version Interactive Discussion
Discussion Paper |
◦
25
◦
The detected northern (0–5 ) as well as the north-eastern (25–35 ) geological lineament orientations can be associated to the Syrian Arc system formed since Turonian ages (Flexer et al., 1989). Since the structural map does only include similar northoriented fault directions, it has to be assumed that the detected lineaments clearly describe the NE trending synclines, anticlines and monoclines structures with vertical
|
1412
Discussion Paper
5 Discussion
HESSD 8, 1399–1431, 2011
Extraction of lineaments from remote sensing data U. Mallast et al.
Title Page Abstract
Introduction
Conclusions
References
Tables
Figures
J
I
J
I
Back
Close
|
20
Discussion Paper
15
|
10
Discussion Paper
5
underlined. Morphological lineaments even generally exhibit better numbers in respect to minimum and mean distance as well as the standard deviation. Moreover, based on those results we calculated the number of geological and morphological lineaments together revealing that almost 75% of all lineaments are within a distance of 1000 m towards a known well with a mean value of 879 m. To even create a further assessment criterion we calculated the distances to wells based on the mapped faults from the structural map. Concerning the general distribution it reveals that more lineaments (10 to 21) are contained within the closer distance classes (≤2000 m) whereas in greater distance classes (>2000 m) the number remains almost constant with 4 to 8 wells per class. The absolute distances of mapped faults to wells are minimal 13 m and maximal 6767 m. Even though those numbers are similar to the previous numbers from the “lineaments-to-wells-distances”, it is diminished by taking the mean (2140 m) and the standard deviation (1868 m) values into account that differ strongly. Summarizing, in terms of distance to wells, the detected lineaments suggest to be a better indicator compared to mapped faults. This is most of all emphasized by the normal distribution of lineaments enclosing ca. 75% of all lineaments to be within 1000 m distance to wells. Achieving the same percentage for mapped faults the related distance would be within the 3000 m class. Furthermore, the mean and standard deviation values are three orders of magnitude smaller for the distance to wells from lineaments than from mapped faults.
Full Screen / Esc
Printer-friendly Version Interactive Discussion
1413
|
Discussion Paper | Discussion Paper
25
HESSD 8, 1399–1431, 2011
Extraction of lineaments from remote sensing data U. Mallast et al.
Title Page Abstract
Introduction
Conclusions
References
Tables
Figures
J
I
J
I
Back
Close
|
20
Discussion Paper
15
|
10
Discussion Paper
5
displacements of up to 0.3 km (Gilat, 2005). We furthermore suppose that those lineament orientations equally represent faults that trend parallel to the hinge lines of the Syn-/Anticlines that e.g. is proven by Flexer et al. (1989) for the Hebron anticline. The cluster of morphological and particularly fluvial induced lineament directions around 45◦ (+/−15◦ ) suggests that the drainage system follows the NE trending syncline/ anticline structures. The second cluster around 315◦ (+/−30◦ ) that also matches structural map fault orientations possibly originates from small NW trending faults. Those structures branch from the western Dead Sea fault partly following older Turonian-Senonian faults (Ginat et al., 1998). Those assumptions are supported by investigations of Freund et al. (1968); Kafri and Heimann (1994) and Matmon et al. (1999), who proved the adjustment of the drainage system to morpho-tectonic fea◦ tures in the study area. The north-oriented (0–5 ) morphological lineaments explicitly stem from lithological edges and align along the western fault of the Dead Sea most likely relating them to the Dead Sea stress field. The general missing 90◦ lineament orientation could be due to the fact that those to the Syrian Arc stress field related strike directions have been superimposed and/or displaced by younger movements (Gilat, 2005) evoking smaller structures that were either already included in the explanation or could not be detected. The remarkably well matching orientations of lineaments and faults suggest a strong correlation among both. Based on the fact that faults have hydrogeologic significance by either hindering or improving groundwater flow this implicitly also accounts for lineaments within the study area. If we additionally take the distance analysis which indicates that almost 75% of all detected lineaments are within 1000 m to the next well we propose that the extracted lineaments not only have a hydrogeologic but also a hydraulic/groundwater significance. This in contrast enables us to derive general groundwater flow-paths. Hence, taking the lineament importance for groundwater flow into account together with altitude information and known springs along the Dead Sea we suggest possible groundwater flow-paths (Fig. 8)
Full Screen / Esc
Printer-friendly Version Interactive Discussion
1414
|
Discussion Paper | Discussion Paper
25
HESSD 8, 1399–1431, 2011
Extraction of lineaments from remote sensing data U. Mallast et al.
Title Page Abstract
Introduction
Conclusions
References
Tables
Figures
J
I
J
I
Back
Close
|
20
Discussion Paper
15
|
10
Discussion Paper
5
The derived flow-paths clearly exhibit a general E-W or SW-NE flow from the recharge areas in the western and the south-western part of the study area towards four main spring areas at the Dead Sea. The flow-paths in the northern part derive from the Ramallah anticline. They turn southward as they reach the western fault of the Dead Sea basin oriented NW in this region. Most likely there are also flow-paths there are most likely also flow-paths coming from the northern part of the Hebron anticline having an E-NE trend. Both flow-paths merge and feed the Ein Feshka spring area. Those flow-paths together with the catchment size and the precipitation amount in the recharge area lead to the high discharge of the Ein Feshka spring. The southward located spring area Kane, Samar and Darga exhibits similar characteristics. This area is mainly fed by groundwater that follows ESE oriented flow-paths and partly NE trending groundwater, which most likely flows only towards the Darga springs. The catchment is smaller thus reducing the potential amount of produced recharge which de-facto results in less discharge. The groundwater that feeds Ein Gedi spring area can be divided in two main flowpaths. The NE trending flow-path is the longest of all flow-paths in the area but presumably bears only a small amount of water as the precipitation in the south-western area does not exceed an average of 220 mm/a and is associated to high evaporation (Diskin, 1970). ESE trending flow-paths with recharge areas in the Judean-Mountains with 600 mm/a of precipitation are rather significant. Taking those facts with respect to the number of lineaments and in particular the overall trend towards Ein Gedi spring area into account suggests a higher amount of flow and discharge than so far reported. Based on the lineament map the spring area around Mineral Beach and Kedem gets probably a very small amount of groundwater as only three lineaments are nearby and oriented towards that area. This could be due to the fact that these springs are fed by the deeper L-JGA, resulting in thermal springs with higher mineral concentrations (Guttman, 2000; Gvirtzman et al., 1997).
Full Screen / Esc
Printer-friendly Version Interactive Discussion
Discussion Paper | Discussion Paper |
1415
HESSD 8, 1399–1431, 2011
Extraction of lineaments from remote sensing data U. Mallast et al.
Title Page Abstract
Introduction
Conclusions
References
Tables
Figures
J
I
J
I
Back
Close
|
20
Discussion Paper
15
|
10
Discussion Paper
5
Since structures related to the deeper L-JGA could apparently not be revealed, this appears to be the boundary condition for the lineament analysis. Thus, it is assumed that based on the lineament analysis only flow-paths of the U-JGA can be derived from the lineament analysis and that only the structural developments of according Turonian to Pliocene ages are reflected. This assumption is partly underlined by Gilat (2005), who describes mega-lineaments visible on satellite images as reflections of Late Miocene-Pliocene structural developments. What remains unclear is the hydraulic potential of lineaments. Anisimova and Koronovsky (2007) describe lineaments in general as permeable for fluids. However, in the central and northern part of the study area Ilani et al. (1988) pointed out that particularly in carbonate rocks of the Cretaceous Judea Group along structural lineaments with E-W orientation and NE trending monoclines iron mineralization and dolomitization occurred thus inhibiting fluid flow. Similar processes could also characterize other lineaments with different orientations in the study area. Another aspect incorporates reverse faults mentioned in Eyal and Reches (1983) and Flexer et al. (1989), where different hydraulic rock characteristics could possibly be moved against each other hindering fluid flow as well. These aspects should be further investigated, if it is intended to prove hydraulic significance of individual lineaments. Taking into account that limitations exist, the produced flow-path map shows a strong correlation with existing groundwater flow models (Guttman, 2000; Laronne Ben-Itzhak and Gvirtzman, 2005). Additionally, an interpolated contour map of the groundwater level based on well data (Fig. 8) underlines the derived flow-paths in the general flow and in complex sub-regions with varying flow directions in the north-west and west. Thus, based on these correlations it can be inferred that the flow-path map is valid.
Full Screen / Esc
Printer-friendly Version Interactive Discussion
5
Discussion Paper |
3. Taking both points into account it was suggested that together with an elevation map and the locations of spring areas along the Dead Sea the lineament map is appropriate to derive possible groundwater flow-paths. The manually delineated flow-paths were compared to results obtained from groundwater modelling of Guttman (2000 and Gvirtzman et al. (1997) which are based on water level 1416
|
25
2. It was shown that 75% of all lineaments, independent of lineament type, are located within a Euclidean distance of 1000 m to the nearest well. This implies that a high number of lineaments possess groundwater significance.
Discussion Paper
20
HESSD 8, 1399–1431, 2011
Extraction of lineaments from remote sensing data U. Mallast et al.
Title Page Abstract
Introduction
Conclusions
References
Tables
Figures
J
I
J
I
Back
Close
|
1. Detected lineaments within the study area have strong correlation with hydrogeological relevant structural features since lineament orientations match remarkably well either Syrian Arc or Dead Sea stress field related structural features that mainly have hydro-geological significance.
Discussion Paper
15
|
10
In terms of efficient large scale groundwater mapping the usage of remote sensing data to detect lineaments as indicators for hydraulic flow conditions is undoubtful. Besides efficiency, objectivity is eminent to be able to be reproducible. Both aspects are fulfilled by applying a semi-automatic approach using the ASTER GDEM and a combined linear filtering and object based classification approach. The linear filtering step exclusively relies on matrix based algorithms, whereas the object-based classification with Imagine Objective (ERDAS) needs only small adjustments during the process. Combining the lineament result with the similar automatic extraction algorithm PCI Geomatica LINE (PCI Geomatics) produces a lineament map that can be evaluated as objective and efficient. Classifying and interpreting the result using ancillary information as suggested by (Sander, 2007) helps to understand the hydro-geological and hydraulic significance of each lineament and hence enables to derive groundwater flow-paths. Based on this analysis it is finally concluded that:
Discussion Paper
6 Conclusions
Full Screen / Esc
Printer-friendly Version Interactive Discussion
Discussion Paper |
1417
|
25
Discussion Paper
20
Abdullah, A., Akhir, J. M., and Abdullah, I.: A comparison of Landsat TM and Spot data for Lineament Mapping in Hulu Lepar Area, Pahang, Malaysia, European Journal of Scientific Research, 34(3), 406–415, 2009. Anisimova, O. and Koronovsky, N.: Lineaments in the central part of the Moscow Syneclise and their relations to faults in the basement, Geotectonics, 41(4), 315–332, 2007. Arad, A.: Hydrogeochemistry of Groundwater in Central Israel, International Association of Scientific Hydrology Bulletin, 11(1), 122–146, 1966. Arenas Abarca, M. A.: Lineament extraction from digital terrain models: case study San Antonio del Sur area, South Eastern Cuba, ITC, Enschede, 2006. Argialas, D. P. and Mavrantza, O. D.: Comparison of edge detection and Hough Transform techniques for the extraction of geologic features, Proceedings of the XXth ISPRS Congress
HESSD 8, 1399–1431, 2011
Extraction of lineaments from remote sensing data U. Mallast et al.
Title Page Abstract
Introduction
Conclusions
References
Tables
Figures
J
I
J
I
Back
Close
|
References
Discussion Paper
15
Acknowledgements. The study was carried out by the BMBF funded project SUMAR (support code: 02WM0848). Moreover, this work was supported by Helmholtz Impulse and Networking Fund through Helmholtz Interdisciplinary Graduate School for Environmental Research (HIGRADE). Additional acknowledgement is addressed to Geosystems GmbH for kindly providing Imagine Objective.
5
|
10
These results prove the applicability of the presented semi-automatic extraction method to objectively delineate lineaments and subsequently derive groundwater flow-paths. Using auxiliary information helped to gain insights in the connection between lineaments and geological structures and thus in hydrogeological relevance of lineaments. Furthermore, the developed method can easily be transferred to other study sites as the ASTER GDEM is globally available. Among others it can preferably be applied before field trips in order to choose suitable sampling sites especially in regions with limited geological/structural map availability and well information.
Discussion Paper
data of wells showing high correlation. In return the high correlation suggests the delineated flow-paths from the lineation map to be valid.
Full Screen / Esc
Printer-friendly Version Interactive Discussion
1418
|
| Discussion Paper
30
Discussion Paper
25
HESSD 8, 1399–1431, 2011
Extraction of lineaments from remote sensing data U. Mallast et al.
Title Page Abstract
Introduction
Conclusions
References
Tables
Figures
J
I
J
I
Back
Close
|
20
Discussion Paper
15
|
10
Discussion Paper
5
of the International Society of Photogrammetry and Remote Sensing, Istanbul, Turkey, 1682– 1750, 2004. Costa, R. D.n d. and Starkey, J.: PhotoLin: a program to identify and analyze linear structures in aerial photographs, satellite images and maps, Comput. Geosci., 27(5), 527–534, 2001. Dinger, J. S., Andrews, R. E., Wunsch, D. R., and Dunno, G. A.: Remote sensing and field techniques to locate fracture zones for highly-yield water wells in the Appalachian Plateau, Kentucky, Proceedings of the National Ground Water Association Fractured-Rock Aquifer 2002 Conference, Denver, Colorado, 2002. Diskin, M. H.: Factors affecting variationsof mean annual rainfall in Israel, International Association of Scientific Hydrology Bulletin, 15(4), 41–49, 1970. ERDAS: Imagine Objective – User’s Guide. Erdas Inc., Norcross, USA, 2008. ERSDAC: ASTER GDEM is a product of METI and NASA, available at: http://www.ersdac.or. jp/GDEM/E/index.html, 2009. Eyal, Y. and Reches, Z. E.: Tectonic Analysis of the Dead Sea Rift region ince the LateCreataceous based on meso-structures, Tectonics, 2(2), 167–185, 1983. Fernandes, A. and Rudolph, D.: The influence of Cenozoic tectonics on the groundwaterproduction capacity of fractured zones: a case study in Sao Paulo, Brazil, Hydrogeology Journal, 9(2), 151–167, 2001. Fitton, N. C. and Cox, S. J. D.: Optimising the application of the Hough transform for automatic feature extraction from geoscientific images, Comput. Geosci., 24(10), 933–951, 1998. Flexer, A. and Honigstein, A.:. The Senonian Succession in Israel-Lithostratigraphy, Biostratigraphy and Sea Level Changes, Cretaceous Research, 5(4), 303–312, 1984. Flexer, A., Gilat, A., Hirsch, F., Honigstein, A., Rosenfeld, A., and Rueffer, T.: Late Cretaceous evolution of the Judean Mountains as indicated by ostracodes, Terra Nova, 1(4), 349–358, 1989. Fleischer, L. and Varshavsky, A.: A Lithostratigraphic data base of oil and gas wells drilled in Israel, Geological Survey of Israel (GSI), Jerusalem, 2002. Freund, R., Zak, I., and Garfunkel, Z. W. I.: Age and Rate of the Sinistral Movement along the Dead Sea Rift, Nature, 220(5164), 253–255, 1968. Gilat, A.: Strike-slip faulting west of the Dead Sea Escarpment, in: Geological Framework of the Levant, edited by: Hall, J. K., Krasheninnikov, V. A., Hirsch, F., Benjamini, C., and Flexer, A., Historical Productions-Hall, Jerusalem, 515–522, 2005. Ginat, H., Enzel, Y., and Avni, Y.: Translocated Plio-Pleistocene drainage systems along the
Full Screen / Esc
Printer-friendly Version Interactive Discussion
1419
|
| Discussion Paper
30
Discussion Paper
25
HESSD 8, 1399–1431, 2011
Extraction of lineaments from remote sensing data U. Mallast et al.
Title Page Abstract
Introduction
Conclusions
References
Tables
Figures
J
I
J
I
Back
Close
|
20
Discussion Paper
15
|
10
Discussion Paper
5
Arava fault of the Dead Sea transform. Tectonophysics, 284(1–2), 151–160, 1998. Gloaguen, R., Marpu, P. R., and Niemeyer, I.: Automatic extraction of faults and fractal analysis from remote sensing data, Nonlin. Processes Geophys., 14, 131–138, doi:10.5194/npg-14131-2007, 2007. Guttman, Y.: Hydrogeology of the Eastern Aquifer in the Judea Hills and Jordan Valley, Mekorot, 2000. Gvirtzman, H., Garven, G., and Gvirtzman, G.: Thermal anomalies associated with forced and free ground-water convection in the Dead Sea rift valley, Geological Society of America Bulletin, 109(9), 1167–1176, 1997. Hung, L. Q.: Integrated Analysis of Sub-Tropical Mountain Karst Geohydrology in NW Vietnam ¨ by Field and Multisource Remotely Sensed Data Vrije Universiteit, Brussel, 2007. Hung, L. Q., Batelaan, O., and De Smedt, F.: Lineament extraction and analysis, comparison of Landsat ETM and ASTER imagery. Case study: Suoimuoi tropical karst catchment, Vietnam, Remote Sensing for Environmental Monitoring, GIS Applications, and Geology V. SPIE, Brugge, Belgium, 59830T-12, 2005. Ilani, S., Rosenthal, E., Kronfeld, J., and Flexer, A.: Epigenetic dolomitization and iron mineralization along faults and their possible relation to the paleohydrology of southern Israel, Appl. Geochem., 3(5), 487–498, 1988. Jordan, G. and Schott, B.: Application of wavelet analysis to the study of spatial pattern of morphotectonic lineaments in digital terrain models. A case study, Remote Sens. Environ., 94(1), 31–38, 2005. Jordan, G., Meijninger, B. M. L., Hinsbergen, D. J. J. v., Meulenkamp, J. E., and Dijk, P. M. v.: Extraction of morphotectonic features from DEMs: Development and applications for study areas in Hungary and NW Greece, International Journal of Applied Earth Observation and Geoinformation, 7(3), 163–182, 2005. Kafri, U. and Heimann, A.: Reversal of the palaeodrainage system in the Sea of Galilee area as an indicator of the formation timing of the Dead Sea Rift valley base level in northern Israel, Palaeogeogr. Palaeoclim. Palaeoecol., 109(1), 101–109, 1994. Karnieli, A., Meisels, A., Fisher, L., and Arkin, Y.: Automatic extraction and evaluation of geological linear features from digital remote sensing data using a hough transform, 62, American Society for Photogrammetry and Remote Sensing, Bethesda, MD, USA, 1996. Kocal, A., Duzgun, H. S., and Karpuz, C.: Discontinuity mapping with automatic lineament extraction from High resolution satellite imagery, ISPRS XX, Istanbul, 2004.
Full Screen / Esc
Printer-friendly Version Interactive Discussion
1420
|
| Discussion Paper
30
Discussion Paper
25
HESSD 8, 1399–1431, 2011
Extraction of lineaments from remote sensing data U. Mallast et al.
Title Page Abstract
Introduction
Conclusions
References
Tables
Figures
J
I
J
I
Back
Close
|
20
Discussion Paper
15
|
10
Discussion Paper
5
Koike, K., Nagano, S., and Ohmi, M.: Lineament analysis of satellite images using a Segment Tracing Algorithm (STA), Comput. Geosci., 21(9), 1091–1104, 2005. Laronne Ben-Itzhak, L. and Gvirtzman, H.: Groundwater flow along and across structural folding: an example from the Judean Desert, Israel, J. Hydrol., 312(1–4), 51–69, 2005. Marpu, P. R., Niemeyer, I., Nussbaum, S., and Gloaguen, R.: A procedure for automatic objectbased classification, in: Object-Based Image Analysis Spatial Concepts for KnowledgeDriven Remote Sensing Applications, edited by: Blaschke, T., Lang, S., and Hay, G., Series, Lecture Notes in Geoinformation and Cartography, Springer, Berlin, 169–184, 2008. Matmon, A., Enzel, Y., Zilberman, E., and Heimann, A.: Late Pliocene and Pleistocene reversal of drainage systems in northern Israel: tectonic implications, Geomorphology, 28(1–2), 43– 59, 1999. Mavrantza, O. D. and Argialas, D. P.: Object-Oriented Image Analysis for the Identification of Geologic Lineaments. International Archives of Photogrammetry, Remote Sensing and Spatial Information Sciences XXXVI (4/C42), 2006. Meijerink, A. M. J., Bannert, D., Batelaan, O., Lubczynski, M. W., and Pointet, T.: Remote Sensing Applications to Groundwater. IHP-VI series on groundwater. United Nations Educational, Scientific and Cultural Organization, Paris, 311 pp., 2007. Mekorot Co. Ltd.: 9 Lincoln Street, POB 2012, Tel Aviv 61201, 2007. Morris, K.: Using knowledge-base rules to map the three-dimensional nature of geological features, Photogrammetric Engineering and Remote Sensing, 57(9), 989–1002, 1991. Nur, A.: The origin of tensile fracture lineaments, Journal of Structural Geology, 4(1), 31–40, 1982. O’Leary, D. W., Friedman, J. D., and Pohn, H. A.: Lineament, linear, lineation: Some proposed new standards for old terms, Geological Society of America Bulletin, 87(10), 1463–1469, 1976. Oguchi, T., Aoki, T., and Matsuta, N.: Identification of an active fault in the Japanese Alps from DEM-based hill shading, Comput. Geosci., 29(7), 885–891, 2003. Philip, G.: Landsat Thematic Mapper data analysis for Quaternary tectonics in parts of the Doon valley, NW Himalaya, India, Int. J. Remote Sens., 17(1), 143–153, 1996. Pratt, W.: Digital Image Processing. Wiley-Interscience, Los Altos, CA, 771 pp., 2007. Quackenbush, L. J.: A Review of Techniques for Extracting Linear Features from Imagery, Photogrammetric Engineering & Remote Sensing, 70(12), 1383–1392, 2004. Salhov, S., Schlein, N., and Croker, P. F.: Gurim 4 – Recommendation for drilling, 82/55, Geo-
Full Screen / Esc
Printer-friendly Version Interactive Discussion
Discussion Paper | Discussion Paper |
1421
HESSD 8, 1399–1431, 2011
Extraction of lineaments from remote sensing data U. Mallast et al.
Title Page Abstract
Introduction
Conclusions
References
Tables
Figures
J
I
J
I
Back
Close
|
20
Discussion Paper
15
|
10
Discussion Paper
5
logical Survey of Israel (GSI), Tel Aviv, 1982. Salvi, S.: Analysis and interpretation of Landsat synthetic stereo pair for the detection of active fault zones in the Abruzzi region (Central Italy), Remote Sens. Environ., 53(3), 153–163, 1995. Sander, P.: Lineaments in groundwater exploration: a review of applications and limitations, Hydrogeol. J., 15(1), 71–74, 2007. Sander, P., Minor, T. B., and Chesley, M. M.: Ground-Water Exploration based on Lineament Analysis and Reproducibility Tests, Ground Water, 35(5), 888–894, 1997. Suzen, M. L. and Toprak, V.: Filtering of satellite images in geological lineament analyses: an application to a fault zone in Central Turkey, Int. J. Remote Sens., 19(6), 1101–1114, 1998. Tel Aviv University: Dept. for Geophysics and Planetary Sciences, Tel Aviv University, POB 39040, Tel Aviv, 69978, 2007. Vaz, D. A., Di Achille, G., Barata, M. T., and Alves, E. I.: Manual and Automatic Lineament Mapping: Comparing results, Lunar and Planetary Science XXXIX, 2008. Vengosh, A., Hening, S., Ganor, J., Mayer, B., Weyhenmeyer, C. E., Bullen, T. D., and Paytan, A.: New isotopic evidence for the origin of groundwater from the Nubian Sandstone Aquifer in the Negev, Israel, Appl. Geochem., 22(5), 1052–1073, 2007. Wladis, D.: Automatic Lineament Detection Using Digital Elevation Models with Second Derivative Filters, Photogrammetric Engineering & Remote Sensing, 65(4), 6, 1999. Yang, G. J. and Huang, T. S.: The effect of median filtering on edge location estimation, Computer Graphics and Image Processing, 15(3), 224–245, 1981.
Full Screen / Esc
Printer-friendly Version Interactive Discussion
Discussion Paper |
Spring
Guttman (2000) Guttman (2000) Fink (1973), Shachnai et al. (1983) Greenboim (1992), Guttman and Simon (1984) Guttman and Simon (1984) Laronne Ben-Itzhak and Gvirtzman (2005)
Discussion Paper
5 14 80-85 30–40 4–5 3–4
Source
| Discussion Paper |
1422
8, 1399–1431, 2011
Extraction of lineaments from remote sensing data U. Mallast et al.
Title Page Abstract
Introduction
Conclusions
References
Tables
Figures
J
I
J
I
Back
Close
|
Quilt & Fawwar Jericho Springs DS – Feschka DS – Kane, Samar DS – Kedem, Mazor DS – En Gedi
Discharge (MCM/a)
Discussion Paper
Table 1. Annual spring discharge of known spring locations within the study area (DS: Dead Sea shore).
HESSD
Full Screen / Esc
Printer-friendly Version Interactive Discussion
Discussion Paper |
Applied Value
RADI GTHR LTHR FTHR ATHR DTHR
Filter radius Edge Gradient Threshold Curve Length Threshold Line Fitting Error Threshold Angular Difference Threshold Linking Distance Threshold
60 10 60 3 15 10
Discussion Paper
Description
| Discussion Paper |
1423
8, 1399–1431, 2011
Extraction of lineaments from remote sensing data U. Mallast et al.
Title Page Abstract
Introduction
Conclusions
References
Tables
Figures
J
I
J
I
Back
Close
|
Parameter
Discussion Paper
Table 2. Chosen parameter values for LINE algorithm.
HESSD
Full Screen / Esc
Printer-friendly Version Interactive Discussion
Discussion Paper
HESSD 8, 1399–1431, 2011
| Discussion Paper
Extraction of lineaments from remote sensing data U. Mallast et al.
Title Page Introduction
Conclusions
References
Tables
Figures
J
I
J
I
Back
Close
|
Abstract
Discussion Paper | Fig. 1. This figure describes (a) topographical features of the study area (“Water wells assumed” refers to three water wells in the southern area taken from (Arad, 1966; Vengosh et al., 2007) and gives (b) a lithological and structural overview.
Discussion Paper
1424
|
Full Screen / Esc
Printer-friendly Version Interactive Discussion
Discussion Paper
HESSD 8, 1399–1431, 2011
| Discussion Paper
Extraction of lineaments from remote sensing data U. Mallast et al.
Title Page Introduction
Conclusions
References
Tables
Figures
J
I
J
I
Back
Close
|
Abstract
Discussion Paper | |
1425
Discussion Paper
Fig. 2. Workflow of the applied methods for semi-automatic extraction of lineaments.
Full Screen / Esc
Printer-friendly Version Interactive Discussion
Discussion Paper
HESSD 8, 1399–1431, 2011
| Discussion Paper
Extraction of lineaments from remote sensing data U. Mallast et al.
Title Page Introduction
Conclusions
References
Tables
Figures
J
I
J
I
Back
Close
|
Abstract
Discussion Paper
Fig. 3. Applied 5 × 5 2nd order Laplacian linear filter on ASTER GDEM and the result after merging maximum values of all directions.
| Discussion Paper |
1426
Full Screen / Esc
Printer-friendly Version Interactive Discussion
Discussion Paper
HESSD 8, 1399–1431, 2011
| Discussion Paper
Extraction of lineaments from remote sensing data U. Mallast et al.
Title Page Introduction
Conclusions
References
Tables
Figures
J
I
J
I
Back
Close
|
Abstract
| Discussion Paper |
1427
Discussion Paper
Fig. 4. Left figure shows a subset of the comparison of lineaments resulting from object-based classification (white lines) to lineaments obtained from PCI LINE algorithm (black lines) – right figure shows the same subset after singularization of identical results with respect to the object based result.
Full Screen / Esc
Printer-friendly Version Interactive Discussion
Discussion Paper
HESSD 8, 1399–1431, 2011
| Discussion Paper
Extraction of lineaments from remote sensing data U. Mallast et al.
Title Page Introduction
Conclusions
References
Tables
Figures
J
I
J
I
Back
Close
|
Abstract
Discussion Paper | |
1428
Discussion Paper
Fig. 5. Lineament map with rose diagrams for all lineaments and the differentiation of geological and morphological lineaments – in the background a calculated lineament density map with an 5 km radius is displayed.
Full Screen / Esc
Printer-friendly Version Interactive Discussion
Discussion Paper
HESSD 8, 1399–1431, 2011
| Discussion Paper
Extraction of lineaments from remote sensing data U. Mallast et al.
Title Page Introduction
Conclusions
References
Tables
Figures
J
I
J
I
Back
Close
|
Abstract
Discussion Paper | |
1429
Discussion Paper
Fig. 6. Frequency-rose diagrams differentiating morphological lineaments in fluvial induced lineaments and lithological boundary induced lineaments (some lineaments are double-counted since they correspond to both characteristics).
Full Screen / Esc
Printer-friendly Version Interactive Discussion
Discussion Paper
HESSD 8, 1399–1431, 2011
| Discussion Paper
Extraction of lineaments from remote sensing data U. Mallast et al.
Title Page Introduction
Conclusions
References
Tables
Figures
J
I
J
I
Back
Close
|
Abstract
Discussion Paper | |
1430
Discussion Paper
Fig. 7. Comparison of Euclidean distances from wells towards the nearest lineament (geological and morphological are differentiated) and faults contained in the structural map 1:200 000).
Full Screen / Esc
Printer-friendly Version Interactive Discussion
Discussion Paper
HESSD 8, 1399–1431, 2011
| Discussion Paper
Extraction of lineaments from remote sensing data U. Mallast et al.
Title Page Introduction
Conclusions
References
Tables
Figures
J
I
J
I
Back
Close
|
Abstract
Discussion Paper | Derived groundwater flow-paths based on lineament map, altitude and Dead Sea spring locations – for comparison the modeling results of
the insecurity of only three water wells in the southern area taken from Arad, 1966; Vengosh et al., 2007).
|
1431
Discussion Paper
Fig. 8.
Guttman (2000) and Laronne Ben-Itzhak and Gvirtzman (2005) and the groundwater level contour map are added (Groundwater level extrapolated refers to
Full Screen / Esc
Printer-friendly Version Interactive Discussion