Aquatic Mammals 2016, 42(1), 1-11, DOI 10.1578/AM.42.1.2016.1
Factors Affecting the Reliability and Validity of Behavioural Datasets: Assessing the Impact of Observers’ Experience and Native Language on Studies of Wild Animals Ailbhe S. Kavanagh,1 Anne W. Goldizen,2 Simon P. Blomberg,2 Michael J. Noad,1 and Rebecca A. Dunlop1 Cetacean Ecology and Acoustics Laboratory, School of Veterinary Science, University of Queensland, Gatton, QLD, 4343, Australia E-mail:
[email protected] 2 School of Biological Sciences, University of Queensland, Brisbane, QLD, 4072, Australia 1
Abstract
Introduction
In animal behaviour studies, particularly those involving wild animals, the reliability and validity of behavioural data collected by observers are not often examined. It is rarer still to see an assessment of the factors that may influence data collection. Variation in the reliability (the consistency of measurements) and the validity (the accuracy of measurements) by different observers may occur. This variability in data collection may have a significant impact on the accuracy of the results of a study. While the impact of observers’ experience on reliability has been demonstrated in some studies, the influence of factors such as observers’ native language is unknown. Herein, we used pre-recorded digital footage of migrating humpback whales (Megaptera novaeangliae) to examine the effects of observers’ experience and native language on the reliability and validity of their data collection. We found that neither factor (experience nor native language) had a significant effect overall. However, within the dataset, specific behavioural types were found to be more accurately and consistently recorded than others. The results of this study help identify behavioural types that may require redefinition in the ethogram as well as those that were not reliably recorded and that should be excluded from further analysis. This information enables future research to optimise the reliability and validity of behavioural data collected at the site and to help identify robust variables for inclusion in data analysis.
Scientific studies of animal behaviour typically rely on data collected by one or more human observers. These studies usually involve the direct observation of animal behaviour in real time or observations made from video recordings (Martin & Bateson, 2010). To standardise collection of these observations, an ethogram, which is a catalogue of clearly defined behaviours exhibited by a species, is typically used (Martin & Bateson, 2010). Despite this, issues with the subjectivity of observers may persist, and variation in the reliability and validity of their observations may impact the accuracy of the results of a study. The reliability of a measurement or observation relates to how repeatable and consistent it is (Martin & Bateson, 2010); in other words, how consistently multiple observers identify the same measurement or observation. Validity, on the other hand, indicates the accuracy and specificity with which a measurement or observation is taken (Martin & Bateson, 2010). For behavioural studies, assessment of reliability and validity can be achieved by quantifying the accuracy and repeatability with which an observer or group of observers correctly detects, and then classifies, a set of behaviours. Studies have shown the reliability and validity of observations to be affected by many factors, including the number of categories used by observers (Mash & McElwee, 1974), the presence of peers (Fradenburg et al., 1995), and observers’ experience (Kaufman et al., 2008). There has been less research, however, into the effects of these and other factors on data collected in animal behaviour research (Kaufman & Rosenthal, 2009). In well-designed studies under field conditions, all observers should be using the same data collection method, the same ethogram of behaviours,
Key Words: Kappa statistics, interobserver agreement, interobserver reliability, experience, native language, humpback whale, Megaptera novaeangliae
2
Kavanagh et al.
and have similar environmental surroundings in the form of peers or supervisors. However, observers’ experience and native language may vary, particularly when large numbers of observers are involved, and the effect of this variation on the reliability and validity of their observations is unclear. While Kaufman et al. (2008) found that more experienced observers achieved higher levels of inter-rater reliability than inexperienced ones, Jones et al. (2001) found that observers with different levels of experience performed similarly. This suggests that the effect of observers’ experience may not be consistent—that is, greater experience does not automatically result in higher reliability as might be expected. Although variation in the impact of observers’ experience has been shown, the influence of other factors such as their language is not known. As the scale of behavioural studies increases, so does the number of observers who may be required for data collection. If large numbers of observers are involved, they may vary in their level of experience. Additionally, training and data collection for a study are generally carried out in a single language. If observers speak different native languages, they may have different levels of proficiency in the language of instruction. Therefore, training needs to be adequate to ensure all observers, irrespective of both experience and native language, are brought to a similar level of competency for the purposes of data collection. Even in studies that achieve high overall reliability and validity across all observers or behavioural categories, the performance of individual observers and the scores for specific categories of behaviours may still vary when these are examined separately. This was the case in Weib et al.’s (2011) study in which interobserver reliability was high for their classification of killer whale (Orcinus orca) calls overall, but no agreement was achieved for two specific call types. This variation in results can suggest either situations in which specific observers require extra training or where disagreement is high for particular categories of behaviour. Defining such behaviours more clearly may reduce this disagreement. In instances where disagreements among observers cannot be corrected, researchers can increase the accuracy and consistency of their datasets by selecting the most reliably recorded variables for analysis and excluding those deemed unreliable (Bateson & Young, 1981; Weib et al., 2001). To examine the effects of observers’ experience and native language on the reliability and validity of the scoring of behaviours of wild animals, humpback whales (Megaptera novaeangliae) were chosen as a model species. Humpbacks are
the most surface active of the baleen whales, displaying a large number of individually identifiable behaviours (Appendix 1). On the east coast of Australia, large numbers of humpback whales travel relatively close to the coast on their southerly migration as they pass Peregian Beach. As a result, these animals can be tracked from landbased locations, enabling large volumes of data on behaviour to be collected by multiple observers (e.g., Cato et al., 2013). The aims of this study were (1) to determine whether observers’ experience and language affected the overall reliability and validity of the behavioural data they collected, (2) to ascertain if particular behaviours differed in their reliability and validity scores depending on observers’ experience and language, and (3) to identify the sources of error in observers’ data. English was the language of instruction for this study, and observers had varying years of experience on the project. Therefore, if the reliability and validity of the data collected by inexperienced or non-native English language speaking observers were shown to differ significantly from those of the data collected by experienced or native English speakers, this would provide researchers with valuable guidance regarding the training needs of observers prior to data collection. Simultaneously, the identification of sources of error in the detection and correct classification of specific behaviours would highlight behavioural definitions that require amendment and help identify robust variables for inclusion in data analysis. Methods Data for this study were collected during the BRAHSS (Behavioural Response of Australian Humpback whales to Seismic Surveys) project (Cato et al., 2013) carried out at Peregian Beach on the east coast of Australia (26° 30' S, 153° 05' E) in September/October 2011. This project involved 49 observers collecting behavioural data from two land-based locations. In the field, an ethogram of 23 behaviours (Appendix 1) and a focal sampling methodology (Altmann, 1974; Martin & Bateson, 2010) were used to collect data. Observers used this methodology to follow a group of focal whales and record every behaviour carried out by all members of the group. Groups of whales were primarily observed through a surveyor’s theodolite, and the computer tracking program VADAR (Visual and Acoustic Detection and Ranging; http://cyclopstracker.com/E. Kniest, University of Newcastle) was used to record their behaviour. Observers were rotated daily between the two land-based locations and the different data collection roles (theodolite and VADAR operation). Prior to testing, all
observers had received 2 wks of training (carried out in English) in behavioural data collection on humpback whales and had been working regularly on the project for a subsequent 3 wks. English was the primary language used on this project; however, the observers involved in data collection came from 13 different countries, and their native languages and English proficiency varied. In addition, observers involved in data collection had between 1 and 3 y of experience working on the BRAHSS project. Therefore, to examine whether experience or native language had an effect on reliability and validity scores and to determine if the training provided was adequate irrespective of native language or experience level, observers were divided into four groups. Twelve observers had more than 1 y of experience on the project and were placed into the experienced group (all were native English speakers). Only 10 observers did not speak English as their first language, and they were placed into the non-native English speakers group (all but one were inexperienced). The remaining 27 observers were all in their first season with the project and spoke English as their first language. They, therefore, were randomly assigned to either the inexperienced (n = 13) or the native English speakers (n = 14) groups. Testing To collect test data for this study, pre-recorded video footage of migrating humpback whale groups was used. The use of video footage rather than real-time observations enabled identical testing to be conducted on all observers independently. Eighty-six minutes of footage of humpback whale behaviour were recorded over a week using a high-definition digital camcorder (Canon Legeria HF M31, 3.9 MP, 15x optical zoom). All footage was shot from one of the land-based observation locations used in the study, and whales were on average 2 km away when recorded (measured using a theodolite with 30x magnification). By comparing images viewed through the theodolite at different distances to images recorded using the camcorder and viewed on a laptop screen, we determined that whales on the laptop screen were the same approximate size (i.e., the same visual angle) as those viewed through the theodolite at a distance of 5 km. This was also the average distance of surveyed whales from the land-based observation locations over the course of the field season. All footage was collected in weather conditions between Beaufort 1 and 3 (wind speeds 2 to 19 km/h). From this catalogue of footage, 18 min (hereafter referred to as the “experimental footage”) were selected based on the quality of the footage and the repertoire of surface behaviours
exhibited by the humpback whale groups. The experimental footage contained 186 individual behaviours in total (details in Table 1). Table 1. The number of each behaviour occurring in the experimental footage Behaviour
Blow Back Breach Half-breach Pectoral slap Inverted pectoral slap Bilateral pectoral slap Fluke slap Inverted fluke slap Peduncle slap Peduncle throw Round out Fluke down dive Fluke up dive Pectoral wave Fluke wave
No. of behaviours 44 3 2 4 12 3 4 13 39 28 8 9 3 3 2 9
Testing was carried out over a 3-d period at two testing stations. Observers were given instructions on how to run the experimental footage on a laptop computer (Dell Latitude E6410ATG) and how to operate an audio recorder (Zoom Handy Recorder H1). They were then left alone and asked to watch the footage and record all observed behaviours vocally. Observers were instructed not to pause or rewind the experimental footage and were asked not to discuss the testing with other observers afterwards. In total, 49 observers were tested. An experienced researcher (A. S. Kavanagh) also focal sampled the behaviour in the experimental footage to obtain an accurate baseline to which all observers’ data could be compared. Unlike the other observers, this researcher was given the opportunity to pause and rewind the footage to ensure all behaviours had been recorded accurately. All focal sample recordings were transcribed using Adobe Audition, Version CS5; the final output included time-stamped behavioural observations. Data Analysis The data collected by each observer were analysed in two ways. First, each was independently compared to the baseline sample in order to assess the validity of each dataset. Second, the reliability of the data collected was evaluated by comparing
4
Kavanagh et al.
datasets across all observers, excluding the baseline. When comparing datasets, a match was assigned if the same behaviour was recorded within 5 s by an observer and the baseline (validity testing) or between at least two observers (reliability testing). This 5-s period was chosen to allow for differences in reaction times between observers. If a behaviour was not recorded by an observer (i.e., if it was missed), this was designated as a nondetection. All statistical analyses were carried out in R, Version 2.13.0 (R Development Core Team, 2012). Validity Analysis: Percentage Agreement with Baseline Data To quantify the validity of the datasets, a measure of percentage agreement was used. This is a measure of how often two observers agree on the detection and correct classification of a behaviour (Martin & Bateson, 2010). Percentage agreement scores were calculated using the following formula:
𝐴𝐴 =
𝑇𝑇 𝑎𝑎𝑎𝑎𝑎𝑎𝑎𝑎𝑎𝑎 𝑇𝑇 𝑚𝑚𝑚𝑚𝑚𝑚
where A is the percentage agreement of an individual observer with the baseline data, T agree is the total number of agreements on the occurrence of a behaviour, and T max is the maximum number of behavioural occurrences recorded in the baseline data (or by the observer if they recorded more). Validity data were unpaired, non-normally distributed, and had homogeneous variance (Levene’s test). Thus, to compare validity scores between categories of observers (experience or language groups), Mann-Whitney U tests were used (MASS, Version 7.3-12 package for R; Venables & Ripley, 2002). Percentage agreement scores were calculated for individual observers separately and for individual behaviours by pooling all data within each group (experienced, inexperienced, native English speaker, and non-native English speaker). Reliability Analysis: Fleiss’s Kappa Fleiss’s (1971) Kappa scores were used to examine overall reliability of the data collected by observers for which all behaviours were considered
simultaneously. Category-wise Kappas were used to measure the reliability of the recording of individual behaviours by observers (Conger, 1980). Both measures were calculated using the irr, Version 0.83 package for R (Gamer et al., 2012). Kappa statistics include a correction for chance agreement and have been adapted for testing the reliability of multiple observers (Cohen, 1960; Landis & Koch, 1977; Berry & Mielke, 1988). Kappa scores range from -1 to 1, where 1 indicates perfect agreement and < 0 indicates that the observed agreement is less than expected by chance (agreement expected if observers made behaviour identifications at random) (Cohen, 1960; Conger, 1980). Types of Inaccuracies in the Behavioural Data There were two types of errors associated with the behavioural data collection: (1) misclassifications for which an observer classified an observed behaviour differently to the baseline, and (2) nondetections for which an observer did not record the occurrence of a behaviour that was recorded in the baseline data. We calculated the percentage of non-detections and misclassifications for data overall, for observer groups overall, and for individual behaviours for each observer group. In the case of misclassifications of a behaviour, we also determined the proportions of what behaviour each was misclassified as. Misclassification by observers also included instances in which an observer recorded the occurrence of a behaviour that was not recorded in the baseline data. The proportion of these extra detections were also calculated for observer groups and for each behaviour. Results Reliability and Validity of Observers’ Data The overall validity of observers’ behavioural data (the average of their individual percentage agreement scores) was 50.8%. The Kappa score, which quantifies the reliability of data collection across all observers, was 0.55. Validity did not differ significantly between inexperienced and experienced observers (Mann-Whitney U test: W = 77, p = 0.98), and Kappa scores obtained for observers in each experience group were similar (Table 2).
Table 2. Mean validity scores (percentage agreement) with standard deviations and reliability scores (Fleiss’s Kappa, range from -1 to 1) for each experience group: inexperienced (< 1 y on the BRAHSS project) and experienced (> 1 y on the BRAHSS project); and for language groups: non-native English speakers and native English speakers. Scores Reliability Validity
Experience Inexperienced Experienced 0.57 50.5 ± 10.6
0.56 51.0 ± 9.9
Non-native
0.52 52.0 ± 10.1
Language
Native
0.55 50.0 ± 9.3
Reliability and Validity of Behavioural Datasets 5 There was also no significant difference between the validity scores (percentage agreement) for native and non-native English speakers (MannWhitney U test: W = 62, p = 0.66) nor was reliability (the Kappa score) affected by language (Table 2). Reliability and Validity of Data on Individual Behaviours Half-breaches and breaches had high reliability and validity scores for experience and language groups, while inverted pectoral slaps consistently had the lowest reliability and validity scores across all observer groups (Tables 3 & 4). Four and 5 of the 17 behaviours tested had a validity score above 80% for inexperienced and experienced groups, respectively (Table 3). For language groups, two behaviours had a validity score above 80% for non-Native English speakers, while four had scores above 80% for native English speakers (Table 4). When the reliability and validity of the data from observers in the two experience groups or the two language groups were examined, a subset of behaviours were found to show higher reliability and validity scores in one group than the other (Table 5). Observers in the experienced observer group performed better in four behaviours (had higher reliability and validity scores) than those in the inexperienced group, while
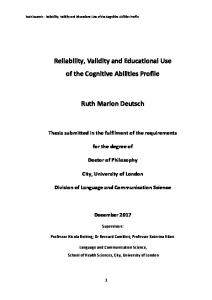
inexperienced observers performed better in only two behaviours (Table 5). For language groups, native speakers performed better in five behaviours, while non-native speakers performed better in only two behaviours (Table 5). There were no behaviours with low validity scores but with high reliability scores for any language or experience groups (Tables 3 & 4)—that is, there were no behaviours for which observers performed poorly against the baseline but showed high agreement between each other. Types of Inaccuracies in the Behavioural Data Overall, 78% of all disagreements between observers’ data and the baseline dataset resulted from misclassifications, while the remaining 22% were due to non-detections. These proportions were similar for observer groups with different levels of experience and for native or non-native English speakers (Table 6). However, in both cases, experienced and native English speakers had a slightly higher proportion of misclassification errors than inexperienced and non-native speakers (Table 6). Some degree of error, non-detection or misclassification, occurred in the recording of most behaviours, with the exception of breaches in the native English speaker language group (Figure 1b). However, the relative proportions of these errors
Table 3. Validity (percentage agreement) and reliability (category-wise Kappa) scores for behaviours for each experience group: inexperienced (< 1 y on the BRAHSS project) and experienced (> 1 y on the BRAHSS project) Inexperienced Behaviour
Validity Reliability score score
Blow Back Breach Half-breach Pectoral slap Inverted pectoral slap Bilateral pectoral slap Fluke slap Inverted fluke slap Peduncle slap Peduncle throw Round out Fluke down dive
83.0 33.3 80.8 90.4 87.2 7.7 48.1 75.7 29.6 37.1 56.7 18.0 48.7
0.79 0.26 0.66 0.82 0.70 0.01 0.44 0.51 0.25 0.35 0.41 0.16 0.44
Fluke up dive Pectoral wave Fluke wave
74.4 34.6 21.0
0.55 0.19 0.24
Most common misclassification Back Blow/Pectoral slap Half-breach Breach Inverted pectoral slap Pectoral slap Pectoral slap Peduncle slap Fluke slap Fluke slap Fluke slap Back Round out/Fluke up dive Fluke down dive Pectoral slap Fluke slap
Experienced Validity Reliability score score 90.0 41.7 87.5 91.7 83.3 5.6 45.8 67.3 30.8 22.0 77.1 37.0 44.4
0.82 0.21 0.73 0.86 0.70 0.06 0.34 0.49 0.23 0.11 0.61 0.35 0.52
94.4 41.7 34.9
0.72 0.23 0.35
Most common misclassification Back Blow Half-breach Breach Pectoral wave Pectoral slap Pectoral slap Peduncle slap Fluke slap Fluke slap Fluke slap Back Round out/Fluke up dive Fluke down dive Pectoral slap Fluke slap
6
Kavanagh et al.
Table 4. Validity (percentage agreement) and reliability (category-wise Kappa) scores for behaviours for each language group: non-native English speakers and native English speakers Non-native English speakers Validity Reliability score score
Behaviour
Blow Back Breach Half-breach Pectoral slap Inverted pectoral slap Bilateral pectoral slap Fluke slap Inverted fluke slap Peduncle slap Peduncle throw Round out Fluke down dive Fluke up dive Pectoral wave Fluke wave
Most common misclassification
78.9 33.3 85.0 70.0 81.7
0.80 0.23 0.63 0.63 0.64
Back Unidentified behaviour Half-breach Breach Inverted pectoral slap
0.0 55.0 62.3 44.8 35.0 73.8 27.8 36.7 80.0 55.0 20.0
0.00 0.48 0.37 0.35 0.26 0.50 0.25 0.26 0.58 0.38 0.18
Pectoral slap Inverted pectoral slap Peduncle slap Fluke slap Fluke Slap Fluke slap Back Round out Fluke down dive Bilateral pectoral slap Pectoral wave
Table 5. Summary of results, behaviours with higher reliability scores R (> 0.10 difference in Kappa) or higher validity scores V (> 10% difference in percentage agreement) for observers in one of the experience groups (inexperienced and experienced) or in one of the language groups (non-native English speakers and native English speakers) (i.e., experienced observers achieved higher reliability and validity scores for peduncle throws when compared to inexperienced observers). Inexperienced
Experienced
Peduncle slap R, V Bilateral pectoral slap R
Peduncle throw R, V Round out R, V Fluke up dive R, V Fluke waves R, V
Non-native
Native
Inverted fluke slap Pectoral wave R, V
R, V
Native English speakers
Breach R, V Half-breach R, V Inverted pectoral slap V Fluke slap R Fluke down dive R
varied depending on the behaviour in question. Furthermore, there was also variation in the performance of experienced vs inexperienced observers and native vs non-native English speakers, depending on the behaviour. No statistical testing was carried out on the proportion data;
Validity Reliability score score 83.8 40.5 100.0 94.6 89.9
0.78 0.26 0.91 0.95 0.70
12.2 51.8 71.6 22.5 36.0 66.1 23.0 40.5 88.1 39.3 27.0
0.07 0.45 0.49 0.13 0.24 0.54 0.25 0.37 0.65 0.26 0.24
Most common misclassification
Back Blow NA Breach Bilateral pectoral slap Pectoral slap Pectoral slap Peduncle slap Fluke slap Fluke slap Fluke slap Back Round out Fluke down dive Pectoral slap Fluke slap
however, behaviours for which the proportions of non-detections and misclassifications differed between observer groups by more than 10% are indicated in Figure 1 for comparative purposes. Inexperienced observers had a higher proportion of misclassification error for pectoral slap and pectoral wave behaviours and a lower proportion of misclassification for fluke slap and fluke up dive behaviours, when compared to experienced observers (Figure 1a). Non-native English speakers had a higher proportion of misclassification error for breach behaviours and a lower proportion of misclassification for pectoral slap, bilateral pectoral slap, pectoral wave, and fluke wave behaviours when compared to native English speakers. The most common misclassification for each behaviour for each observer group are presented in Tables 3 and 4. In general, behaviours were most commonly misclassified as others that are carried out with the same body part (i.e., a fluke) and create the same observed effect (i.e., slapping or breaching). Breach and half-breach behaviours were always misclassified as one another for all observer groups (Tables 3 & 4). Similarly, if slapping behaviours involving the fluke (e.g., fluke slap, inverted fluke slap, peduncle slap, and peduncle throw) were misclassified, it was always as another fluke slapping behaviour (Tables 3 & 4). A similar result was found for slapping behaviours
Reliability and Validity of Behavioural Datasets 7 Table 6. The overall % disagreement between observers and the baseline for each experience and language group, and the proportion of that disagreement value due to either non-detection or misclassification of a behaviour. Overall % disagreement
Proportion due to misclassifications
Proportion due to non-detections
Inexperienced Experienced
49.5 50.0
0.80 0.84
0.20 0.16
Non-native language Native language
47.9 50.0
0.75 0.81
0.25 0.19
involving the pectoral fin for all observer groups, with the exception of pectoral slaps misclassified by the experienced observer group. Experienced observers most commonly misclassified pectoral slaps as pectoral waves. In general, the occurrence of extra detections by observers was low. Although the proportions were relatively small, the native language observer group displayed a slightly higher proportion of extra detections when compared to the non-native language group: 6.14 and 4.64%, respectively. Similarly, the experienced observer group displayed a slightly higher proportion of extra detections than the inexperienced observer group: 6.86 and 4.99%, respectively. For all observer groups, blows and backs were the behaviours most commonly recorded by observers that were not recorded in the baseline data. Discussion The findings of this study indicate that variability introduced by individual observers may be a greater source of error in this behavioural dataset than either their experience or language. Contrary to expected results, experience and language did not significantly influence the overall reliability and validity of the behavioural data collected by the observers studied. This suggests that the training provided prior to testing was sufficient to bring all observers, regardless of initial experience and language, to a similar standard. Before undertaking this experiment, we had expected that more experienced observers would achieve higher scores both overall and for each individual behavioural category as in Kaufman et al. (2008). In the Kaufman study, the results of inexperienced observers were not consistent with those of experienced observers, and they achieved lower reliability scores. However, in the current study, although experience did not significantly affect overall results, there were some differences in the reliability and validity scores for specific behaviours collected by the different observer groups (experienced vs inexperienced). Our
results are similar to Jones et al. (2001) who also found that, on average, observer groups (experienced and inexperienced) performed similarly but identified differences at the group level in performance on specific elements tested. While scores for individual behavioural categories in this study varied with observers’ experience, no clear pattern emerged; experienced observers’ data were not consistently more reliable or valid than those of inexperienced ones. There may be several reasons for this finding. Perhaps inexperienced observers were less confident with the ethogram and so took greater care in applying it to observed behaviours. Alternatively, experienced observers may have been overconfident in their memory of the ethogram definitions and inadvertently misclassified behaviours. Another possible explanation is that the previous experience of observers on other projects influenced their performance. This may be particularly significant if that previous experience included the use of similar but not identical behavioural ethograms as observers may have difficulty relearning new definitions for similar behaviours. Although previous experience on other projects was not examined in this study, future studies should address this factor. A similar result was found when the reliability and validity of data collected by native and nonnative English speaking observers were compared, with neither group achieving consistently higher scores overall. If training was inadequate and, therefore, having English as a second language was a disadvantage, we would have expected data for all or most behaviours to have lower reliability and validity scores for this group. This was not the case in this study. To the best of our knowledge, no other study on wild animals has examined the effect of observers’ native language on their reliability and validity results, and this should be addressed in future multilingual studies. Given that observers’ experience and language were not driving the variation in reliability and validity scores observed in this study, we examined the errors in the dataset more closely at the level of individual behaviours. Behaviours
8
Kavanagh et al.
Figure 1. Percentage disagreement between observers’ data and baseline data for each behaviour for both experience groups (a) and both language groups (b). The disagreement is further divided into percentage due to non-detection error or misclassifications. Behaviours for which these proportions differed by more than 10% between groups are indicated with an asterisk (*). Behaviour codes: blow (BL), back (BA), breach (BR), half-breach (HB), pectoral slap (PS), inverted pectoral slap (IPS), bilateral pectoral slap (BPS), pectoral wave (PW), peduncle slap (PDS), peduncle throw (PDT), fluke slap (FS), inverted fluke slap (IFS), fluke wave (FW), round out (RO), fluke down dive (FDD), and fluke up dive (FUD).
recorded with low levels of error (i.e., high validity scores) can be included with confidence in an analysis using data collected by these observers, while those with high levels of error (i.e., low validity scores) need to be examined in detail before being included. If the majority of errors were due to non-detections, these latter behaviours may need to be omitted from future analyses. On the other hand, if error consisted primarily of misclassifications, this indicates that observers are not able to accurately distinguish between similar behaviours. This may occur for two reasons: (1) the ethogram definitions may not be sufficiently clear to allow observers to accurately distinguish between similar behaviours or (2) the definitions may be too specific or detailed and, under field conditions, this level of detail may not be visible to observers. In this study, the behaviour definitions were comprehensive, and so it is possible that this level of detail was not visible to observers under field conditions. Future research at this site should consider broadening behavioural definitions and examining if this improves the reliability and validity of the data collected.
However, broader behavioural categories need to make biological sense as well as improving reliability of the dataset. When choosing to broaden behavioural definitions or to omit behaviours from an analysis, as in Weib et al (2011), the functions of these individual behaviours should be considered. The functions of the humpback whale behaviours that were used to illustrate observer reliability and validity in this study are not well understood. No study has distinguished between the possible functions of very similar behaviours such as bilateral pectoral slaps and inverted pectoral slaps; and as we have shown, when these were individually recorded, neither behaviour achieved high reliability and validity scores. Therefore, balance is needed between the level of detail required from behavioural data, the possible biological significance of the behaviours in question, and the reliability of the data collected. Achieving a balance between these factors is central to obtaining reliable data with sufficient detail to test a hypothesis. In the field, many factors affect how reliably data are collected, including the behaviour of focal
Reliability and Validity of Behavioural Datasets 9 animals, their distance from the observer, and environmental conditions such as glare and sea state. In this study, these factors were controlled for by using the same video footage to test each observer, which contained footage of whales close to shore and recorded in calm weather conditions. We recommend examining these and other factors in future research to achieve a better understanding of how to maximise the reliability and validity of behavioural data under varied field conditions. Although experience and language were not significantly influential in this study, these factors may have been important had testing been carried out prior to the 3 wks of actual data collection, before observers gained this experience. We, therefore, also recommend that reliability and validity testing be carried out both after initial training and prior to any data collection, and again midway through a season of data collection. Initial testing would enable issues with individual observers or specific behaviours in an ethogram to be addressed prior to collecting data. Mid-season testing would offer the opportunity to ensure all observers maintained the same level of reliability and validity throughout a project. Although there was some variation in the reliability and validity scores for individual behaviours between the different observer groups, the results of this study highlighted the behaviours that could be included in future analyses with confidence and those that should potentially be omitted. The majority of error in this study was due to the misclassification of behaviours rather than to non-detections; therefore, future research should examine whether this issue can be rectified through clearer or broader ethogram definitions. This could be achieved by comparing data collected by two groups of observers using either a detailed ethogram or one with broader definitions of behaviour. This information, in turn, would provide insight into the most effective ethogram to use to optimise the reliability and validity of behavioural data collected by observers at this site. Acknowledgments This project would not have been possible without the assistance and hard work of all the BRAHSS volunteers and field team members, particularly Dr. Hendrik Kniest (VADAR). We are grateful for the comments and suggestions received from two anonymous referees, which improved this manuscript. Thank you to all the members of CEAL (Cetacean Ecology and Acoustics Lab) and to Michael Williamson, Louise Bennett, Verity Steptoe, and Michael Carroll. BRAHSS is funded by the E&P Sound and Marine Life Joint Industry
Program (JIP) and the U.S. Bureau of Ocean Energy Management (BOEM). The JIP is managed by the International Association of Oil and Gas Producers (OGP) and sponsored by ExxonMobil, Chevron, Eni, Statoil, ConocoPhillips, BG Group, BHP Billiton, the International Association of Geophysical Contractors, Santos, and Woodside, with additional support from Origin Energy, Beach Energy, and AWE. Literature Cited Altmann, J. (1974). Observational study of behaviour: Sampling methods. Behaviour, 49, 227-267. http://dx. doi.org/10.1163/156853974X00534 Bateson, P., & Young, M. (1981). Separation from the mother and the development of play in cats. Animal Behaviour, 29, 173-180. http://dx.doi.org/10.1016/S00 03-3472(81)80163-7 Berry, K. J., & Mielke, P. W. (1988). A generalization of Cohen’s Kappa agreement measure to interval measurement and multiple raters. Educational and Psychological Measurement, 48, 921-933. http://dx.doi. org/10.1177/0013164488484007 Cato, D. H., Noad, M. J., Dunlop, R. A., McCauley, R. D., Gales, N. J., Salgado Kent, C. P., . . . Duncan, A. J. (2013). A study of the behavioural response of whales to the noise of seismic air guns: Design, methods and progress. Acoustics Australia, 41, 88-97. Cohen, J. (1960). A coefficient of agreement for nominal scales. Educational and Psychological Measurement, 20, 37-46. http://dx.doi.org/10.1177/001316446002000104 Conger, A. J. (1980). Integration and generalization of Kappas for multiple raters. Psychological Bulletin, 88, 322-328. http://dx.doi.org/10.1037/0033-2909.88.2.322 Fleiss, J. L. (1971). Measuring nominal scale agreement among many raters. Psychological Bulletin, 76, 378382. http://dx.doi.org/10.1037/h0031619 Fradenburg, L. A., Harrison, R. J., & Baer, D. M. (1995). The effect of some environmental factors on interobserver agreement. Research in Developmental Disabilities, 16, 425-437. http://dx.doi.org/10.1016/0891-4222(95)000 28-3 Gamer, M., Lemon, J., Fellows, I., & Singh, P. (2012). irr: Various coefficients of interrater reliability and agreement. R Package, Version 0.83. Retrieved from www.rproject.org Jones, A. E., ten Cate, C., & Bijleveld, C. J. H. (2001). The interobserver reliability of scoring sonograms by eye: A study on methods, illustrated on zebra finch songs. Animal Behaviour, 62, 791-801. http://dx.doi.org/10. 1006/anbe.2001.1810 Kaufman, A. B., & Rosenthal, R. (2009). Can you believe my eyes? The importance of interobserver reliability statistics in observations of animal behaviour. Animal Behaviour, 78, 1487-1491. http://dx.doi.org/10.1016/j. anbehav.2009.09.014
10
Kavanagh et al.
Kaufman, J. C., Baer, J., Cole, J. C., & Sexton, J. D. (2008). A comparison of expert and nonexpert raters using the consensual assessment technique. Creativity Research Journal, 20, 171-178. http://dx.doi.org/10.1080/10400 410802059929 Landis, J. R., & Koch, G. G. (1977). An application of hierarchical Kappa-type statistics in the assessment of majority agreement among multiple observers. Biometrics, 33, 363-374. http://dx.doi.org/10.2307/2529786 Martin, P., & Bateson, P. (2010). Measuring behaviour: An introductory guide (3rd ed.). New York: Cambridge University Press. http://dx.doi.org/10.1163/ 000579510X520989 Mash, E. J., & McElwee, J. D. (1974). Situational effects on observer accuracy: Behavioral predictability, prior experience, and complexity of coding categories. Child Development, 367-377. http://dx.doi.org/ 10.2307/1127957 R Development Core Team. (2012). R: A language and environment for statistical computing. Vienna, Austria: R Foundation for Statistical Computing. ISBN 3-900051-07-0. Retrieved from www.R-project.org Venables, W. N., & Ripley, B. D. (2002). Modern applied statistics with S (4th ed.). New York: Springer. http:// dx.doi.org/10.1007/978-0-387-21706-2 Weib, B. M., Symonds, H., Spong, P., & Ladich, F. (2011). Call sharing across vocal clans of killer whales: Evidence for vocal imitation? Marine Mammal Science, 27, E1-E13. http://dx.doi.org/10.1111/j.17487692.2010.00397.x
Reliability and Validity of Behavioural Datasets 11 Appendix 1. Asterisk (*) indicates behaviours appearing in the experimental footage used for observer testing. Behaviour
Definition
Blow*
Visible plume of exhaled air and water vapour from the whale upon surfacing.
Back*
The dorsal surface/back of the whale is visible briefly at the surface of the water, but a blow is not observed.
Breach*
Leap in which most or all of the whale’s body (> 60%) exits the water. The whale usually, but not always, twists in the air and lands on its dorsal or lateral aspect.
Half breach*
Leap in which roughly half of the whale’s body exits the water. The whale usually, but not always, twists in the air and lands on its dorsal or lateral aspect. The whale can land directly onto its ventrum (a belly flop), but this is differentiated from a head lunge by being predominantly vertical rather than having forward motion.
Head lunge
Energetic forward motion where the whale appears to be attempting to “porpoise.” A forward lunge of the head, with less than 40% of the body leaving the water. The angle to the water is < 45°, resulting in more of a forward dive than a breach. The whale is lunging forwards but barely lifting out of the water.
Pectoral slap*
The left or right pectoral fin is raised out of the water and forcibly slapped with its ventral surface against the water; the whale is usually positioned on its side.
Inverted pectoral slap*
The left or right pectoral fin is raised out of the water and forcibly slapped with the dorsal surface against the water; the whale is usually positioned on its back (i.e., belly up).
Bilateral pectoral slap*
Both pectoral fins are raised out of the water and forcibly slapped with their dorsal surfaces against the water; the whale is positioned on its back.
Pectoral wave*
The lifting of the pectoral fin clear of the water, without a violent slapping motion.
Peduncle slap*
The entire fluke and peduncle are raised clear out of the water and forcibly slapped against the water surface, either ventrally or laterally; more energetic than a fluke slap.
Peduncle throw*
The throwing of the entire fluke and peduncle out of the water in a lateral motion. No initial lifting from the water as in a peduncle or tail slap, just a single high scything motion; high energy behaviour.
Fluke slap*
The fluke is raised out of the water and slapped ventrally against the water surface; less energetic than peduncle slap.
Inverted fluke slap*
While the whale is belly up in the water, the fluke is lifted clear of the water and slapped, dorsal surface down, against the water’s surface.
Fluke wave*
The lifting of the fluke clear of the water and waving around, without a violent slapping motion.
Round out*
A dive in which the peduncle is arched upward out of the water, but the flukes are not lifted from the water. Usually heralds a deep dive by the whale. Same as a peduncle arch dive or a high arch dive.
Fluke down dive* A dive in which a peduncle arch is followed by the fluke lifted from the water as the whale dives. The fluke is not lifted far from the water; it remains parallel to the water, and its ventral surface cannot be seen from behind. Fluke up dive*
A dive in which a peduncle arch is followed by the fluke lifted from the water as the whale dives; the fluke is held vertically so that its ventral surface can be seen from behind.
Surface activity*
An undetermined behaviour that resulted in a splash, usually recorded when the whale is far away.
Spy hop
A vertical lifting of the head (usually exposing the entire rostrum and head) above the water surface. Usually a single low-energy bobbing motion.
Sailing
The whale holds its fluke vertically out of the water for extended periods of time without slapping motions.
Footprint
Upwelling of water causing circular ripples on the surface caused by underwater upward fluke stroke.
Logging*
Where the whale is lying on the water’s surface with very little activity.
Milling
When the whale is moving slowly in various directions within a similar area.