Biogeochemistry 00: 1–33, 2002. © 2002 Kluwer Academic Publishers. Printed in the Netherlands.
Factors controlling concentration, export, and decomposition of dissolved organic nutrients in the Everglades of Florida ROBERT G. QUALLS 1,* and CURTIS J. RICHARDSON 2 1
Department of Environmental and Resource Sciences, University of Nevada, Reno, NV 89557, USA; Nicholas School of the Environment and Earth Sciences, Duke University, Durham, NC 27708, USA; *Author for correspondence (e-mail:
[email protected]) 2
Received 17 January 2002; accepted in revised form 17 January 2002
Key words: Adsorption, Biodegradation, Carbon, Decomposition, Dissolved organic matter, Everglades, Humic substances, Mineralization, Nitrogen, Nutrients, Peat, Phosphorus, Photochemical, Wetlands Abstract. Water draining from the Everglades marshes of southern Florida contains high concentrations of dissolved organic C (DOC), N (DON), and in some locations, P (DOP). These dissolved organic nutrients carry over 90% of the N and organic C, and about 25% of the P exported downstream in the Everglades. Our objectives were to describe the most important aspects of the origin and fate of dissolved organic matter (DOM) in the Everglades, and to describe the processes controlling its concentration and export. Concentrations of dissolved organic nutrients are influenced by local plant production, decomposition, and sorption equilibrium with peat. The drained peat soils of the Everglades Agricultural Area and the more productive marshes of the northern Everglades produce some of the highest concentrations of DOC and DON in the Everglades watershed. In portions of the marshes of the northern Everglades, P enrichment was correlated with higher local DOC and DON concentrations and greater production of soluble plant matter. Microbial degradation of Everglades DOM was very slow; less than 10% of the DOC was lost after 6 months of incubation in the laboratory and supplements of inorganic nutrients failed to speed the decomposition. Exposure to solar radiation increased the subsequent decay rate of the remaining DOC (25% in 6 mo.). Solar radiation alone mineralized 20.5% of the DOC, 7% of the DON, and degraded about 50% of the humic substances over 21 days in sterile porewater samples and thus degraded DOM faster than microbial degradation. The humic substances appeared to inhibit biodegradation of the other fractions of the DOC since hydrophilic organic acids decomposed faster when isolated from the humic substances. The fate of DOC and DON is closely linked as indicated by a generally narrow range of C/N ratios. In contrast, high concentrations of DOP were associated with P enrichment (at least in pore water). The DOC was composed of about 50% humic substances, 33% hydrophilic acids, and 15% hydrophilic neutral substances, typical of DOC from other environments, despite the fact that it originates from a neutral to slightly alkaline peatland. Despite high exports of DON (3.9 g m −2 y −1 from one area), the marshes of the northern Everglades are a sink for DON on a landscape scale. The agricultural fields of the Everglades Agricultural Area, however, exported net quantities of DON. High concentrations of DOC desorbed from the agricultural soils when water with no DOC was added. Sorption experiments indicated that high concentrations of dissolved organic matter flowing into the marshes from the Everglades Agricultural Area could suppress the further desorption of additional soluble organic matter through physicochemical mechanisms. While biological factors, plant production and microbial decomposition are important in producing potentially soluble organic nutrients, physicochemical sorption equilibria, hydrology, and degradation by solar radiation are also likely to control the export of this material on the landscape scale.
XPS 0086981TX (BIOG) – product element 402624 – Grafikon - 2002-09-25 12:53:12
2 Abbreviations: (DOC) – Dissolved organic carbon, (DOM) – Dissolved organic matter, (DON) – Dissolved organic nitrogen, (DOP) – Dissolved organic phosphorus, (EAA) – Everglades Agricultural Area, (WCA) – Water Conservation Area
Introduction Water draining from wetlands often contains high concentrations of darkly colored dissolved organic matter (DOM). This dissolved organic matter carries not only carbon, but also nitrogen, phosphorus and metals. The DOM functions in several important ways in wetland ecosystems: • it is a major mode of export for N (Lewis 2002) and P (Qualls et al. 2002 (in press)) in many ecosystems, • since it represents an important form of export, it plays a major role in determining the balance and accumulation of N, P, and perhaps even C over the long period of soil development, • because natural DOM is a powerful agent for complexation of metals, it plays an important role in metal toxicity and metal export, e.g. mercury (Strober et al. 1995), • it provides a potential source of carbon for microbial growth (Travnik 1992), and • it controls the pH of many wetland waters (Hemond 1980; McKnight et al. 1985). Our understanding of the processes that control the concentration and export of DOM and the elements carried by it in wetlands is limited. Although it is understood that the high concentrations of DOM originate from plants, the factors controlling its concentration and fate are poorly understood. The availability of the nutrients N and P carried in dissolved organic matter is also poorly understood. Furthermore, DOM is variously viewed as a resource for bacteria in some studies (Travnik 1992) while in others it is regarded it as refractory. Wetlands around the world are experiencing disturbances such as drainage, eutrophication, and problems with heavy metal toxicity which either influence dissolved organic matter or are influenced by dissolved organic matter. The Everglades of Florida present a case in which all three disturbances are important. A large portion has been drained (Tate 1980). Agricultural nutrients have been draining from the Everglades Agricultural Area into the northern Everglades for at least three decades, causing enrichment of certain areas and there is a growing concern about the transport of nutrients to Florida Bay (Reddy et al. 1999). Mercury toxicity is also a major problem as it is in many wetlands around the world (Lodenius et al. 1983) and mercury is largely transported by DOC in the Everglades (Strober et al. 1995). The Everglades, at a subtropical latitude, also experiences relatively high levels of solar UV radiation which could increase in the future if stratospheric ozone continues to decline. Solar UV radiation has been shown to alter aquatic DOM (Keiber et al. 1990; Bushaw et al. 1996).
XPS 0086981TX (BIOG) – product element 402624 – Grafikon - 2002-09-25 12:53:12
3
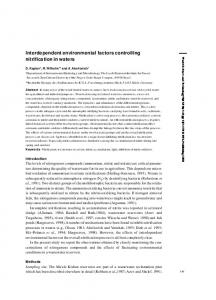
Figure 1. Main processes generating and consuming dissolved organic carbon in a marsh ecosystem. Dissolved organic matter is important in transport of DON and DOP. Processes generating DOC are direct leaching of soluble substances produced from plants and litter, exudation of substances from roots, microbial solubilization of substances that were not originally soluble, and production of DOC by algae. Processes consuming DOC are microbial mineralization, microbial mineralization catalyzed by photolysis of DOC to low molecular size compounds, and photochemical mineralization. We also hypothesize a pool of potentially soluble organic carbon in solid phase sorbed onto solid soil organic matter that can sorb or desorb from the solid phase. This study is concerned with import and export, leaching from litter, microbial mineralization, abiotic photochemical mineralization, and sorption/desorption. We did not explore algal production.
A conceptual diagram (Figure 1) illustrates what we believe to be the most significant processes generating and consuming DOC and the associated nutrient atoms (N and P). This study will explore the potential importance of these processes either by studying natural patterns of concentrations or laboratory experiments. Our objectives in this paper are to describe the most important aspects of the origin and fate of DOM in the Everglades and the factors controlling concentration of DOM. Our specific objectives in this study were to: 1. determine which landscapes in the Everglades produce the highest concentration of dissolved organic nutrients, 2. determine whether there is a net production and export of dissolved organic nutrients in the marshes of the catchment Water Conservation Area 2A, 3. determine whether sorption of potentially soluble organic matter can play a role
XPS 0086981TX (BIOG) – product element 402624 – Grafikon - 2002-09-25 12:53:13
4 in regulating concentration of dissolved organic nutrients, 4. characterize the functional group characteristics of the DOM, 5. determine the relative importance of biodegradation and solar radiation in mineralization of C, N, and P from DOM, and 6. determine whether humic substances inhibit biodegradation of other fractions of DOM.
Materials and methods Study area The Everglades lie in the interior of the southern tip of the Florida peninsula, originally extending from Lake Okeechobee to the southern tip of Florida (Figure 2a). In the humid subtropical climate, the marsh plants grow year-round (Davis (1989, 1991)), but 75% of the 136 cm average annual rain falls in the wet season between May and October (South Florida Water Management District 1992). Much of the Everglades consists of vast expanses of sawgrass (Cladium jamaicense) marsh interspersed with islands of short trees and areas of deeper water called wet prairies and sloughs. The area just south of Lake Okeechobee, called the Everglades Agricultural Area (EAA), has been drained and produces mainly sugar cane, vegetables, and rice. These drained peat soils are now generally 60 to 120 cm deep but have subsided as much as 2 m from their original depth, due largely to aerobic decomposition (Tate 1980). The Water Conservation Areas (WCA) consist largely of marshes surrounded by dikes and canals (Figures 2a & 2b). The area south of Interstate highway 75 (the “southern Everglades”) consists of marshes, mangroves, and a variety of other communities. The depth of peat soil generally declines from 2–3 m in the remaining marshes of the northern Everglades southward to depths of only a few cm. The peat is underlain by limestone. The pH of the peat is nearly neutral except in the center of WCA-1 and some nearby agricultural peat soils where pH is between 6 and 7. The pH of surface water is generally neutral to slightly alkaline but pH’s as high as 9 can occur over algal mats. This study will deal with the portion of the Everglades watershed south of Lake Okeechobee. Surface water flow is generally from north to south, potentially from the southern shore of Lake Okeechobee, through canals in the EAA, into the Water Conservation Areas and then into the Shark River Slough in the Everglades National Park. However, flow is regulated by an extensive canal system (Figure 2b). During the dry season, water from Lake Okeechobee is used to irrigate the EAA. During the wet season, water is generally pumped from the EAA into the Water Conservation Areas along with runoff containing excess nutrients. These inputs of excess P have created a nutrient enrichment and plant productivity gradient in WCA-2A extending several km from the Hillsboro Canal south into the interior of the WCA-2A marsh and a shift from Cladium jamaicense to Typha domengensis dominated communities (Figures 2a & 2b), (Davis 1989; Craft and Richardson 1993). Some flow
XPS 0086981TX (BIOG) – product element 402624 – Grafikon - 2002-09-25 12:53:13
Figure 2. a. Map of the Everglades. We divided the Everglades region into the Everglades Agricultural Area, the northern Everglades (the Water Conservation Areas north of Interstate 75, and the southern Everglades (south of Interstate 75). Sampling locations are indicated with a solid dot. The dashed line indicates the original boundary of the Everglades watershed south of L. Okeechobee. Marshes are indicated by the triangular (䉭) stipled pattern. Figure 2b. Map of catchments used for budgets, the Everglades Agricultural Area, WCA-1, WCA-2A, and WCA-3A indicating levees surrounding the areas, pumping stations, and gauged spillways where runoff in and out was measured. (modified from South Florida Water Management District (1992)).
5
XPS 0086981TX (BIOG) – product element 402624 – Grafikon - 2002-09-25 12:53:13
6 from the Water Conservation Areas can also drain to the East Coast. Water from WCA-3A can enter the Everglades National Park. There, water eventually flows into the mangrove areas and to Florida Bay. Survey of dissolved organic nutrient concentrations over the Everglades Landscape Samples of surface water and soil pore water were collected in winter 1992, spring 1993, and summer 1993 over a broad area of the Everglades watershed (Figure 2a). Pore water samples were taken at a depth of 12.5 cm, and where possible, at a depth of 60 cm. Surface water samples were taken at mid-depth in the water column or at 25 cm in water over 50 cm in depth. To serve as a crude index of plant biomass at each marsh sampling site, we measured number of leaves and average plant height in three 0.5 m 2 quadrats and used the product of the number of leaves per m 2 and average height as an index. The relationship of biomass to primary productivity was shown by Davis (1989, 1991) who found that within either sawgrass or cattail communities, net primary productivity was proportional to aboveground biomass because leaf turnover was consistent. For all water samples in the study, samples were immediately stored on ice and were filtered through combusted glass fiber filters within about 12 hours. Samples were analyzed for DOC, inorganic carbon, and phosphate within 5 days; NO 3−, NO 2−, NH 4+ within 7 days; and total N and total P within 14 days. The DOC was measured using a Shimadzu TOC 500 Total Organic Carbon Analyzer (Shimadzu Corp., Columbia, MD). Total N and total P, on both unfiltered and filtered samples, were digested by persulfate oxidation (Koroleff 1985; Wetzel et al. 1995). We calculated DON as (total dissolved N)–(NO 3-N + NH 4-N). We calculated DOP as (total dissolved P)–(PO 4- P), assuming that polyphosphates were not significant. Other analytical methods are summarized in Qualls and Richardson (2000). During one sampling period a parallel set of samples was filtered and frozen on dry ice within 20 minutes of collection but these samples were not significantly different in any analysis compared to samples processed as above. Absorbance in the UV region, reported at 320 nm, was measured because of the role of DOC in limiting the penetration of UV radiation. The ratio of UV absorbance/DOC concentration was used to indicate possible photo-bleaching of DOC (Keiber et al. 1990). Intensive Survey in WCA-2A In WCA-2A, samples were taken along a nutrient enrichment gradient approximately 10 km long along 3 transects in 18 plots (Figure 2). A detailed map of sites is in Qualls and Richardson (1995). Samples of surface water and soil pore water at 12.5, 25, and 60 cm below the soil surface were gathered at 2-month intervals between January, 1990 and April, 1991. Soil pore water was collected in screen covered PVC pipe wells. Older pore water was pumped from the wells and new pore water was allowed to infiltrate the well before sampling.
XPS 0086981TX (BIOG) – product element 402624 – Grafikon - 2002-09-25 12:53:13
7 Because most of the input of nutrients from the Hillsboro canal to WCA-2A flowed in from 3 different gates with different loads of nutrients a single flow weighted distance for each plot in WCA 2A was calculated as detailed in Qualls and Richardson (1995). Budget of DON for Water Conservation Areas The Everglades Agricultural Area and the Water Conservation Areas are surrounded by dikes and water flow in and out of each is measured by an extensive system of pumps stations and metered spillways (Figure 2b). Consequently it is possible to treat these as catchments. The South Florida Water Management District (1992) maintained a budget of water, total N and total P for water entering and leaving the Water Conservation Areas for the period 1978–1989 (Walker 1999). The water budget for the Everglades Agricultural Area was published by Abtew and Khanal (1994). It was possible to calculate total organic N concentrations (including suspended particulate N) from these data. For each input or output point (Figure 2b), during periods of water flow, we calculated the DON concentration as: total Kjeldahl N–NH 3 − estimated particulate N). Dissolved organic N and particulate N were measured separately only during the period 1978–1979, so for this period we calculated a regression between particulate N and turbidity. We then used turbidity as a predictor to estimate particulate N during the 10-year period (r=0.69). Generally less than 10% of the total N was particulate N so the error in using a surrogate estimator was small. Flow weighted average DON concentrations were calculated for each input and output point (Figure 2b) and multiplied by the average annual water flows reported by the South Florida Water Management District (1992). Interpolation of concentrations to daily water flow measurements followed the methods outlined in South Florida Water Management District (1992). Production of soluble organic nutrients in plant litter One source of dissolved organic matter is the leaching of water-soluble organic matter from litter produced directly by plants. Recently senesced leaves were gathered from cattail (Typha domengensis), sawgrass (Cladium jamaicense), spike rush (Eleocharis cellulosa), and sugar cane (Saccharum saccharinum) during autumn. In order to harvest only material which had not been leached, only plant material above the water surface was gathered in a period when the leaves had not been leached by rain for at least 14 days. The samples of cattail and sawgrass leaves were gathered in both phosphorus enriched and non-enriched areas of WCA-2A. Field moist samples were ground and shaken for 6 days in three successive aliquots of water adjusted to pH 7.8 and preserved with 20 mg L −1 HgCl 2. Our objective was not to simulate natural leaching rates, but to estimate the total content of water extractable substances. The total DOC, DON, and DOP extracted was measured and expressed as a percentage of the initial total C, N, and P in the senesced tissue. We used measurements of the net primary productivity in WCA-2A by Davis (1989, 1991) to estimate production rates of soluble organic matter (C, N,
XPS 0086981TX (BIOG) – product element 402624 – Grafikon - 2002-09-25 12:53:13
8 or P) in litterfall: (net primary productivity) × (g of soluble organic element/g dry mass of senesced tissue) = annual production of soluble organic nutrients in plant litter. Since biomass turns over several times a year (Davis 1989), biomass alone was not sufficient to estimate production of soluble organic nutrients. Solubility or sorption of soluble organic matter An adsorption isotherm experiment was designed to show whether a solubility or sorption equilibrium might exist between DOC and solid organic matter in peat that might be capable of regulating concentration and export. Initial pore water from peat samples was extracted by 0.07 MPa suction to minimize the influence of the pore water in the peat. This extracted water was analyzed for DOC. Peat soil samples (1.0 g dry mass equivalent) from the 0–5 cm depth were shaken for five days in a solution (30 mL) in which the concentration of DOC was varied. Preliminary experiments indicated that 5 days was sufficient for equilibration. The equilibrium DOC concentration was then measured. To make solutions in which the DOC varied, natural soil pore water from the Everglades (44 mg L −1 DOC) was diluted with an artificial solution that simulated the inorganic components of the water sample. Some DOC was also concentrated by ultrafiltration with a 500 MW cutoff membrane (YC-05 membrane, Amicon Inc., Beverly, MA,) that retained 93% of the DOC, and was then mixed with artificial inorganic solution. Five concentrations of DOC were used: approximately 120, 44, 22, 12, and 1 mg L −1. The pH of all solutions was adjusted to the same value as the initial porewater sample. Samples of each solution were also shaken without any peat and later filtered to determine whether precipitation occurred in the absence of the solid phase. This experiment was repeated using peat (0–5 cm depth) from a sugar cane field in the Everglades Agricultural Area. In order to estimate the total pool of potentially soluble (or desorbable) DOC, we repeatedly extracted a 1 g dry mass equivalent sample of peat once each day for 24 days using 20 mL of deionized water either with, or without, 20 mg L −1 HgCl 2. Each sample was shaken for 24 hours, centrifuged, the supernatant poured off, a new solution added, and the process repeated for 24 days. The rationale for this experiment was that the cumulative amount of DOC in repeated extractions with water would approach an asymptote corresponding to the total pool of soluble organic matter. This curve of cumulative mg of DOC extracted vs. number of extractions was fitted to a model for the accumulation of the product of a first order reaction that is also used to determine potentially mineralizable nitrogen (Ellert and Bettany 1988). In order to assess the influence of microbial dissolution or decomposition, we suppressed microbial activity by adding 20 mg L −1 of HgCl 2 to two tubes in each extraction and, for comparison, omitted the HgCl 2 in two others. The difference between the sequentially extracted samples with and without HgCl 2 was also used to attempt to measure the rate of microbial dissolution. If microbial dissolution was significant we reasoned that the cumulative amount leached would be greater without HgCl 2 and this difference would be more apparent after the most of the initially soluble carbon was removed by sequential extractions. A
XPS 0086981TX (BIOG) – product element 402624 – Grafikon - 2002-09-25 12:53:13
9 methodological experiment was also done to determine whether the 20 mg L −1 HgCl 2 affected sorption of DOC. A DOC adsorption experiment using the methods of the peat experiment with either 0, 5, 10, 20 or 40 mg L −1 HgCl 2 added was done by shaking the peat for only an hour (to minimize microbial changes in the control without HgCl 2). DOC adsorption isotherms did not differ with different concentrations of added HgCl 2, indicating no affect on DOC sorption. Composition of DOC We evaluated the composition of the DOC by using a fractionation that related to the mobility of DOM. The procedure separates the DOC into hydrophobic and hydrophilic substances, then further separates these classes into acid, base, and neutral substances (Leenheer (1981); as detailed in Qualls and Haines (1991)). We did not separate the “weak hydrophobic acids” from the humic substances, however. This fractionation procedure was used for pore water collected at the 0–5 cm depth in WCA-2A, a surface water sample from the same site, and a surface water sample from the southern Everglades. In one experiment, samples of the DOC from the soil pore water were exposed to solar radiation and then fractionated to determine the chemical changes caused by sunlight. Mineralization of DOC and DON by solar radiation Two experiments were done to show the effect of solar radiation on the following: (1) the potential maximal rate of mineralization by solar radiation, (2) the relative mineralization of C and N from DOM, (3) the time sequence of alterations to the DOM and (4) which fractions of DOM are mineralized. For both experiments samples of pore water were gathered from the 0–5 cm depth in WCA-2A. We used shallow pore water because we believed that most DOC originates from that zone and because it had not been exposed to sunlight. For the first experiment, samples were sterilized by aseptic filtration through a 0.2 m membrane filter into previously autoclaved quartz tubes and sealed with sterilized Teflon film backed by a septum leaving a headspace. Duplicate tubes were wrapped in aluminum foil to serve as dark controls. Tubes were placed in a tub of deionized water to moderate temperature and exposed to sun in Loxahatchee FL, USA (26°41⬘00⬙ N, 80°16⬘48⬙ W) in spring, 1992. A temperature probe was inserted into an extra tube and showed that temperatures remained within the range of natural water in the marsh. Samples were mixed by inverting every two days to maintain aeration. Initial and final samples were analyzed (in triplicate) for DOC, NH 4-N, and NO 3+NO 2-N, and DON. Subsamples of 50 L and swabs of the tube walls were plated on nutrient agar and tripticase soy agar to check for microbial contamination. Subsamples of the initial and sunlight exposed water were also subjected to the DOC fractionation procedure in order do determine what fractions were selectively broken down by sunlight. In a second experiment, dissolved organic matter was prepared, sterilized, incubated, and analyzed as described in the first solar radiation experiment in order to
XPS 0086981TX (BIOG) – product element 402624 – Grafikon - 2002-09-25 12:53:13
10 follow the kinetics of loss of DOC and DON over a period of 53 days. These samples were incubated outdoors in Durham, NC (36°00⬘47⬙ N, 78°54⬘32⬙ W) where temperature ranged from 19 to 26 °C. Biodegradation A biodegradation experiment was designed to show: (1) the biodegradability of the natural DOM, (2) the relative biodegradability of various fractions, (3) whether humic substances inhibit biodegradation of other fractions, (4) whether exposure to solar radiation makes the remaining DOM more biodegradable, and (5) whether biodegradation is stimulated by inorganic nutrient supplements. Initial water samples, sunlight exposed samples from experiment one (see preceding section), and isolated fractions of initial and sunlight-exposed samples were subjected to an assay of biodegradability. The procedure of the assay was detailed in Qualls and Haines (1992). Nutrient supplements of either ammonia + nitrate, PO 4, micronutrients, or combinations of these 3 supplements were added to subsamples of the initial water and some fractions to determine if the enriched water conditions in the north of WCA-2A might increase biodegradation of dissolved organic matter. These samples were incubated with a mixed microbial inoculum for 184 d with subsamples analyzed at 21 days. Samples were analyzed for dissolved organic and inorganic C, N, and P.
Results Patterns of concentrations of dissolved organic nutrients in the Everglades Landscape Concentrations of DOC, DON, and DOP in the water along the south shore of Lake Okeechobee at the entrances to the major canals leading into the Everglades region were considerably lower than those in the rest of the northern Everglades (DOC = 18 mg L −1), (Figure 3, Table 1). In general, however, DOC and DON concentrations in water are highest in the EAA and the northern Everglades and concentrations tend to decline toward the south. This trend is evident in canals, internal surface water, and soil pore water. In canals in the EAA, the DOC concentrations tend to be relatively low when water from Lake Okeechobee is being discharged into the main canals but they were higher when the canals contained local runoff or water from the Water Conservation Areas (a seasonal event, not shown). In the drained peatlands of the EAA, soil porewater and water in farm ditches contain concentrations of DOC and DON which are as high or higher than soil water in the northern marshes. Concentrations of DOC and DON are lower in the southern Everglades than in the marshes to the north (Figure 3, Table 1). The concentrations in soil porewater were generally greater than in the overlying surface water but the differences were
XPS 0086981TX (BIOG) – product element 402624 – Grafikon - 2002-09-25 12:53:14
11
Figure 3. Average DOC concentrations in the Everglades watershed. Error bars are ± SE. Means with the same letter above bar were not significantly different (P < 0.05).
not as great as in the northern Everglades. The DOC and DON concentration was very high in the brackish water of the mangrove zone. In water from all environments in the Everglades, the C/N ratio of the DOM varied in a relatively narrow range–generally between 16 and 22. The DOC/DON ratio was, however, significantly lower in surface and shallow pore water of the southern Everglades (16) than in the northern Everglades (20 and 22, respectively). The concentrations of DOP are not so closely related to the concentration of DOC. Instead, the concentrations of DOP seem more related to a history of P enrichment since they are highest in the canals and porewater of the EAA and marsh areas near the canals of the northern Everglades that carry P enriched water (Izuno et al. 1991). Nevertheless, DOP concentrations were generally less than 40 g L −1.
XPS 0086981TX (BIOG) – product element 402624 – Grafikon - 2002-09-25 12:53:14
1580(100)cd 1850(130)c 2770(270)b 4030(280)a 1000(70)de 1360(160)de 1930(240)(cd) 1630(280)cd 388(40)f 970(290)e 1830(550)c 4060(1300)ab 770(180)e
8 8 8 5 6 11 9 8 7 10 10 3 2 2 6 4 3
the units are: (abs. × 10 3 mg −1 L)
1510(120)cd 1820(150)c 5010(840)a 4160(800)a
2
L. Okeechobee at outlet Everglades Ag. Area Canals Farm ditches Shallow porewater Deep porewater N. Eeverglades Canals Marsh surface water Shallow porewater Deep porewater S. Everglades Canals Marsh surface water Shallow porewater Deep porewater Hammock depressions Mangrove Canals Surface water Shallow porewater Florida Bay shore
*
870(60)
Sites
Region
DON ( L −1)
ND 13(6.2)cd 25(2.1)b 11(2.0)cde
4(0.6)e 4(0.8)e 13(2.0)b 14(5.0)cd 8(1.5)de
16(2.6)bc 15(2.3)bcd 20(2.9)bc 15(3.9)cd
13(2.1)cd 22(7.8)b 40(8.6)a 17(4.4)bc
8(2.3)
DOP ( L −1)
16(0.6)c 26(6.4)abc 17(4.1)abc 14(3.1)abc
22(1.6)a 16(0.8)c 16(0.8)c 20(2.9)ab 26(1.0)a
21(0.5)ab 20(0.3)b 22(0.7)ab 24(1.0)a
21(0.8)ab 20(0.8)b 17(0.9)c 20(0.8)ab
21(0.9)
ND 1000(8100)abc 3200(950)c 760(70)e
9900(2100)a 9100(1800)a 2800(500)d 3400(1900)c 1400(270)de
3500(720)c 4100(630)c 4400(700)c 13000(2200)a
4700(1500)c 3500(960)c 2400(520)d 4800(1300)c
5500(3300)
DOC/DON ratio DOC/DOP ratio
0.1(0.04)ef 0.6(0.30)ab 1.5(0.56)a 0.1(0.04)ef
0.2(0.02)e 0.1(0.01)f 0.2(0.03)de 0.4(0.17)bc ND
0.4(0.05)c 0.4(0.06)c 0.9(0.18)ab 0.7(0.19)ab
0.4(0.04)c 0.5(0.05)c 1.0(0.23)ab 0.7(0.27)b
9(0.5)cd 11(2.0)abc 16(27.0)abcd 11(3.0)abcd
9(1.0)cde 6(0.4)e 8(0.7)d 11(0.9)bcd ND
12(0.8)bcd 12(1.0)bcd 11(1.6)bcd 11(1.0)bcd
12(0.8)cd 13(1.0)bc 14(1.5)ab 10(2.5)abcd
8(0.6)
nm/DOC ( *)
(abs. units) 0.1(0.01)
abs. 320
abs. at 320 nm
Table 1. Survey of concentrations of organic C, N, and P, elemental ratios in dissolved organic matter, and UV light absorbance at 320 nm wavelength in the Everglades watershed. The mean of 3 seasonal samplings at a number of sites is shown with the standard error in parenthesis. Means with same letter to the right of the parenthesis are not significantly different (P < 0.05) according to Duncan’s multiple range test.
12
XPS 0086981TX (BIOG) – product element 402624 – Grafikon - 2002-09-25 12:53:14
13
Figure 4. Average proportion of particulate, dissolved organic, and dissolved inorganic P (PO 4-P) in surface water in three plots in the unenriched (southern areas) of Water Conservation Area 2A over the sampling period. Total P concentration was 30 g L −1 (± 16 SD).
In surface water of the northern Everglades about 90% of the solar radiation at 320 nm is absorbed at a depth of only 2.5 cm while in surface water of the southern Everglades the corresponding depth was about 10 cm. The ratio of absorbance at 320 nm to the DOC concentration is lowest in water from Lake Okeechobee and surface water in the southern Everglades. Distribution of dissolved organic nutrients in WCA-2A In WCA-2A we had the opportunity to observe changes along a well documented P enrichment and plant production gradient (Davis (1989, 1991); Craft and Richardson 1993) and we examined the water chemistry over a longer time period in much more detail than in other areas. Dissolved organic P was not the dominant form of P in water in the unenriched area of WCA-2A but it was a significant fraction, averaging about 23% of total P (Figure 4). In contrast, generally over 95% of the N in surface water of WCA-2A was dissolved organic N (not shown). Particulate N generally comprised only 0–3% of the total N. Dissolved organic C and N decreased with distance south along the nutrient enrichment gradient in WCA-2A, both in surface and soil pore water (Figures 5 and 6). The highest concentrations of DOC and DON in surface water occurred in the marsh near the Hillsboro Canal, not in the water entering from the Canal (represented by distance of 0 in Figures 5 and 6) so the pattern of concentration did not simply reflect dilution of runoff entering from the canal. The pattern of DOC concentration followed a general gradient of plant production (Davis 1991) and soil P concentrations (Qualls and Richardson 1995). The correlation of DOC concentration in water vs. soil P concentration (to 25 cm depth) was 0. 96. (P < 0.05). The concentrations of DOC in soil pore water tend to be 1.5 to 2 times those in the surface water. As in other areas of the Everglades, the nitrogen content of the dissolved organic matter was generally consistent as indicated by a C/N ratio close to
XPS 0086981TX (BIOG) – product element 402624 – Grafikon - 2002-09-25 12:53:15
14
Figure 5. DOC in surface water and soil pore water (12.5 cm depth below the soil surface) along a P and plant productivity gradient in WCA-2A. Error bars indicate ±SE for 7 to 8 samplings over time at each plot. Regressions were significant (P < 0.05). DOC concentrations at the 25 and 60 cm depth also declined significantly with distance along the gradient (not shown).
20 (Figure 7a). Therefore, the high concentrations of DON simply reflect the high concentrations of DOM. Surface water concentrations of DOP were quite variable and in some months when no water was flowing into WCA-2A from the P enriched Hillsboro Canal, there was no significant trend along the gradient (Figure 8). However, there was a highly significant trend in April when the canal water was flowing into WCA-2A (shown as a separate regression in Figure 8). There was also a trend of decreasing DOP along the gradient in the pore water at 12.5 cm depth which is similar to a trend in soil pore water PO 4, solid soil bicarbonate exchangeable organic P and soil humic acid P (Qualls and Richardson 1995). The dissolved organic matter is very low in organic P content with organic C/P ratios generally well above 1000. Figure 7b shows the lack of relationship between DOC and DOP, indicating that the P content of the dissolved organic matter is much more variable than the N content.
XPS 0086981TX (BIOG) – product element 402624 – Grafikon - 2002-09-25 12:53:15
15
Figure 6. DON in surface water and soil pore water (12.5 cm depth below the soil surface) along a P and plant productivity gradient in WCA-2A. Error bars indicate ±SE for 7 to 8 samplings. Regressions were significant (P < 0.05). DON concentrations at the 25 and 60 cm depth also declined significantly with distance along the gradient (not shown).
Causes of patterns in concentration of dissolved organic nutrients Although actual measurements of production are rare, in the Everglades watershed in general, the plant biomass is lower and peat depths are shallower in the marshes of the southern everglades where the DOC concentrations tended to be lower. Using the data set for the survey of the Everglades watershed shown in Table 1, we found that the DOC concentration in marsh surface water was significantly correlated to the log of our index of approximate plant biomass (r=0.72). There was also a similar relationship for DOC concentration in shallow pore water (r=0.80). There was also a significant but poorer relationship between the log of DOC concentration and the depth of peat (r=0.55). Although this index of plant biomass was only intended as a crude comparison of plant biomass among a large number of sites it suggests that higher plant productivity contributes to higher DOC concentrations through leaching of plants and litter. We also used our data on soluble organics and along with Davis (1989, 1991) aboveground primary production data, to estimate the average annual production of soluble organic nutrients in WCA-2A in plant leaf litter (Table 2). As such, our
XPS 0086981TX (BIOG) – product element 402624 – Grafikon - 2002-09-25 12:53:15
16
Figure 7. (a) Generally consistent DON content in dissolved organic matter in surface water from WCA-2A. Points represent individual samples for 18 plots over the sampling period. The dashed line represents a C/N ratio of 20. (b) DOP vs. DOC in surface water in WCA-2A showing a variable content of P in dissolved organic matter.
estimate is an underestimate of all soluble organic matter produced by plants because we did not consider soluble organic matter exuded from living leaves, algae, and belowground production. Plant production is greater and species composition is different in the nutrient enriched northern area of WCA-2A where DOC concentrations are high. In WCA-2A, Davis (1989, 1991) measured aboveground foliar production in cattail stands ranging from 3035 g m −2 y −1 in the enriched area to 1077 g m −2 y −1 in the unenriched area along the same gradient where our samples were taken. Productivity in sawgrass stands was lower, ranging from 1943 g m −2 y −1 in the enriched area to 986 g m −2 y −1 in the unenriched area. Cattail has largely replaced sawgrass in the most enriched areas near the Hillsboro Canal. This greater plant production and the dominance of cattail in the enriched area results in a higher production of soluble organic C, N and P in litterfall (Table 2). Senescent cattail leaves contain more soluble organic C than sawgrass leaves, so the changes in species composition have also affected the production of soluble organics. There was only a 7% greater soluble C content in sawgrass leaves in the enriched area compared to those from the unenriched area. Thus the most important factors in-
XPS 0086981TX (BIOG) – product element 402624 – Grafikon - 2002-09-25 12:53:15
17
Figure 8. DOP in surface water and soil pore water (12.5 cm depth below the soil surface) along a P and plant productivity gradient in WCA-2A. Error bars indicate ±SE for 7 to 8 samplings. The regression for surface water was significant for April (shown separately) but was not significant for the means of other dates (P < 0.05).
fluencing production of soluble nutrients in the litterfall was the difference in cattail vs. sawgrass and the difference in NPP along the gradient. In each of the species of plants, the P leached from the senescent leaves was much higher in those from the P enriched area (Table 2) although a higher % initial P was extracted from cattail from the unenriched area. Budgets for the marsh areas of the Everglades Despite the high concentrations of dissolved organic nutrients in the marshes and high production of soluble organics by plants and decomposers, there was no net export of dissolved organic nutrients from the marsh areas of WCA-1, WCA 2A, and WCA 3A (Table 3). There was a large gross export of DON in runoff from the Water Conservation Areas but large amounts also flow into the areas. The DON flowing in and out of WCA-2A might be construed as simply flowing through. The WCA-1 and WCA-3A marshes are a net sink for a portion of the DON entering the areas. The drained soils of the Everglades Agricultural Area export less DON on an areal basis than the marshes but they show a high net export because the source of
XPS 0086981TX (BIOG) – product element 402624 – Grafikon - 2002-09-25 12:53:15
*
17 10 20 24 26 60
extracted
% initial P
(g element extracted/g dry mass)
12.4 7.1 10.0 7.4 20.6 36.3
extracted
extracted
10.8 9.6 5.6 6.0 8.4 11.3
% initial N
% initial C
expressed on a dry mass basis † Calculated as: primary productivity ** N.D. = Not determined
*
Cattail, non-enriched area Cattail, enriched area Sawgrass, non-enriched area Sawgrass, enriched area Spike rush Sugar Cane
Plant
m −2 y −1)
m −2 y −1)
4.3 13.4 4.5 13.9 N.D. N.D.
organic N† (g organic C† (g
y −1)
54 139 25.1 56.2 N.D. N.D.
tion of soluble
tion of soluble
tivity * (g m −2
1077 3035 986 1943 N.D. ** N.D.
Annual produc-
Primary produc- Annual produc-
0.019 0.083 0.016 0.23 N.D. N.D.
P†(g m −2 y −1)
tion of soluble
Annual produc-
Table 2. Soluble C, N, and P extracted with water from freshly senesced plant litter. For C and N, only the dissolved organic form was included but for P, both the organic and inorganic forms leached from litter were included. Primary productivity data are taken from Davis (1989).
18
XPS 0086981TX (BIOG) – product element 402624 – Grafikon - 2002-09-25 12:53:16
19 Table 3. Budgets of DON and water for the Everglades Agricultural Area (EAA), and Water Conservation Areas (WCA) 1, 2A, and 3A. The budget covers the period Oct. 1, 1978–Sept. 30 1988 and is derived from data furnished by the South Florida Water Management District. The water budget and total N budget were reported directly by the South Florida Water Management District (1992). The water budget for the Everglades Agricultural Area was taken from Abtew and Khanal (1994). The DON budget was estimated from the total N budget as summarized in the text. Net export is export minus import. Material DON (g m
−2
−1
y )
Water (cm)
Water residence time (y) Area (km 2)
import export net export runoff in runoff out rain evapo-transpiration *
EAA
WCA-1
WCA-2A
WCA-3A
0.26 1.4 1.2 24.7 59.6 117.5 82.6 N.A. 2401
3.0 2.5 −0.5 99.0 94.2 120.7 129.9 0.36 588
3.9 3.9 0 162.5 187.5 113.4 133.5 0.2 448
1.4 0.9 −0.8 77.0 48.1 110.7 133.2 0.73 2063
* For EAA, calculated as rain + runoff in–runoff out. For WCA areas, calculated from pan evaporation for comparison to rain + runoff in–runoff out.
water for the EAA is rainfall and water from Lake Okeechobee that is relatively low in DON concentration (see Table 1). The relative amounts of runoff in and out of the EAA and WCA’s also influence the import and export of DON. Rainfall in excess of evapotranspiration accounted for a greater net runoff of water from the Everglades Agricultural Area while WCA-2A was dominated by runoff moving through the area. Sorption-desorption equilibria of DOC with peat soil Our experiments show that peat can desorb or release potentially soluble organic matter into solution but high initial DOC concentrations can suppress this desorption or even cause DOC to sorb to the solid peat (Figure 9a). When water with no DOC added was shaken with the marsh peat, the solid peat released 22.6 mg L −1 organic carbon into solution. Only 52% of this DOC could be accounted for by the DOC of pore water in the moist peat added initially. Thus the equivalent of 10.8 mg L −1 of C desorbed from the solid peat. When undiluted pore water was shaken with the marsh peat, the DOC concentration remained the same–apparently the DOC concentration was at equilibrium and the higher concentration suppressed the desorption of additional potentially soluble organic matter from the solid peat. When concentrated DOC was shaken with the marsh peat, 25% of the DOC was removed from solution and presumably was sorbed to the solid peat. Sorption, not precipitation was indicated because DOC did not precipitate in a control that contained DOC without peat (not shown). The peat soil from a sugar cane field in the Everglades Agricultural Area exhibited the same tendency to desorb and sorb DOC as the marsh peat except it initially
XPS 0086981TX (BIOG) – product element 402624 – Grafikon - 2002-09-25 12:53:16
20
Figure 9. The DOC concentration in solution limits the desorption and sorption of soluble organic matter on peat. (a) shows a marsh peat, 0–5 cm depth and (b) a drained agricultural peat (0–5 cm depth) from the same original soil series. The final equilibrium concentration is plotted vs. the concentration in the solution initially added to the soil (solid points) along with the solid regression line. The dashed line indicates no change in the initial vs. final concentration. The line for (a) indicates that the soil released soluble organic C to solution when the initial DOC concentration was below about 42 mg L −1 but the solid peat sorbed DOC from solution when the initial added DOC concentration was higher. The 42 mg L −1 equilibrium point also corresponded well with the porewater drained from the sample from the field.
contained much more potentially soluble organic matter, releasing 45.5 mg L −1 DOC into the water with no added DOC (Figure 9b). The equilibrium DOC concentration was much higher (about 97 mg L −1) but the slope was remarkably similar to that of the marsh soil. This high equilibrium concentration also corresponded to the high DOC concentrations found in pore water in other surface soil in the drained agricultural area (Table 1).
XPS 0086981TX (BIOG) – product element 402624 – Grafikon - 2002-09-25 12:53:16
21
Figure 10. An estimate of the total pool of soluble organic matter in a peat sample by sequentially extracting 1 g dry mass equivalent of peat with 20 mL of water with or without 20 mg L −1 HgCl 2 once each day for 21 days. The calculated asymptote, an estimate of the total pool of soluble organic carbon, was 2.7 mg which was 0.58% of the C in the peat. The 95% confidence interval for the asymptote corresponded to 2.5 to 3.0 mg.
Sequential extraction of the peat from the 0–5 cm depth in WCA-2A indicated that approximately 2.7 mg C per gram dry mass of peat, or 0.58% of the C was potentially soluble in water (Figure 10). The pool of potentially soluble organic matter was less than 1% of the carbon in the peat sample but the very large amount of this organic soil underlying the water column corresponds to large pools of potentially soluble organic matter. The capacity of this pool to buffer DOC concentrations over long periods of time is indicated by the persistently high concentrations leached even after a large number of extractions. The similarity of the sequential extraction curves (Figure 9) with and without HgCl 2 suggests that microbial dissolution was low relative to the leaching rate of potentially soluble organic matter. We use the term microbial dissolution to refer to the production of water-soluble organic matter from insoluble organic matter as a by-product of microbial decomposition. The slowness of the biodegradation rate of the DOC in water alone in the biodegradation experiments (presented later) suggested that that the simultaneous decomposition of the DOC in the solution phase was negligible during this experiment. Composition of dissolved organic matter In the shallow porewater sample, the largest single fraction of the DOC was the humic substances, which comprised about 46 to 50% of the DOC (Figure 11, the “initial” sample). The hydrophilic acids comprised 32 to 33% of the DOC. These hydrophilic acids consist of small carboxylic acids, fulvic acid-like substances with
XPS 0086981TX (BIOG) – product element 402624 – Grafikon - 2002-09-25 12:53:16
22
Figure 11. Change in composition of dissolved organic matter taken from shallow porewater after exposure to 21 d of sunlight. Water from the solar radiation experiment (Table 4) including the initial sample, the light exposed sample, and the dark control were subjected to a fractionation procedure. Error bars indicate ± 1 S.E. (n=3). The initial, dark control and light exposed treatment means for a given fraction were compared with Duncan’s multiple range test and similar means (P < 0.05) are indicated with the same letter above the bar.
lower molecular size and more COOH groups per unit carbon, and sugar phosphates which are believed to be the major form of organic P (Qualls and Haines 1991). Thus about 78 to 83% of the DOC consists of organic acids, mostly highly colored and of large molecular size. A third important fraction was the hydrophilic neutral compounds comprising about 14% of the DOC. This class is likely to contain polysaccharides and low molecular weight alcohols, some of which might be the more biologically available substances. The sample of surface water from WCA-2A that was fractionated contained 44% humic substances and 26% hydrophilic acids and a sample of surface water from the southern Everglades contained 52% humic substances and 34% hydrophilic acids (not shown). Degradation by solar radiation When the filter sterilized shallow pore water was exposed to sunlight in sterile quartz tubes in the Everglades Area for 21 days during Spring, 20.5% of the DOC was mineralized (Table 4). At the same time about 7% of the DON was mineralized and a concomitant increase in ammonium could account for 68% of the decrease in DON (as show by the decrease in DON compared to the increase in ammonium). While the increase in ammonium was not enough to account for 100% of the decrease in DON, the discrepancy might have reflected analytical error. Controls incubated in the darkened tubes did not measurably change in DOC, DON, or ammonium concentration. In a longer incubation in sunlight over 51 d, 30.4% of
XPS 0086981TX (BIOG) – product element 402624 – Grafikon - 2002-09-25 12:53:16
23 Table 4. Mineralization of dissolved organic nitrogen and dissolved organic carbon in water from shallow porewater in WCA-2A after 21 days of exposure to sunlight in sterile quartz tubes. Treatment
Initial
Dark Control
Light Exposed
Time of exposure (d) DON (mg L −1) NH 4-N (mg L −1) NO 3+NO 2-N (mg L −1) % of initial DON change in DON (mg L −1) change in NH 4-N (mg L −1) % of initial DOC
0 2.20 (0.008) 0.526 (0.003) 0.050 (0.002) 100 (0.4) – – 100 (0.2)
21 2.19 (0.012) 0.524 (0.031) 0.052 (0.007) 99.6 (0.7) −0.01 (0.015) −0.002 (0.015) 98.9 (0.7)
21 2.05 (0.020) * 0.627 (0.018) * 0.052 (0.005) 93.3 (1.1) * −0.15 (0.025) * 0.101 (0.023) * 79.5 (3.2) *
Standard errors of the mean (n = 3 tubes) are shown in parentheses. Asterisks indicate a significant difference (P ⭐ 0.05) from the initial value as tested with both t-tests (light exposed vs. initial and dark control vs. initial) and multiple comparisons (Duncan’s multiple range test).
the DOC and 10.8% of the DON was mineralized (Figures 1 and 2). The rate of loss of DOC and DON declined over time. Most of the loss of DOC occurred from the humic substances; a loss that could account for 24% of the initial DOC (Figure 11) (significant difference vs. dark control and initial, p < 0.05, Duncan’s multiple range test). There was also a small but statistically insignificant decline in the hydrophilic acid fraction. About 4% of the initial DOC was converted from one of the acid fractions to hydrophilic neutral compounds (significant difference vs. dark control and initial, p < 0.05, Duncan’s multiple range test). These data show that it is mainly the humic fraction that is mineralized by the solar radiation. Our results suggest only a relatively minor percentage of the humic fraction was converted to low molecular weight organic components. In our sunlight-exposed samples, there was also rapid bleaching, particularly in the absorbance in the 300 to 360 nm range (not shown). Biodegradability of DOM The organic matter that remained after exposure to sunlight underwent important alterations that enabled further mineralization by microorganisms. The unexposed dissolved organic matter in shallow pore water was not very biodegradable (Figure 13). The addition of inorganic N and P did not stimulate the biodegradation of the dissolved organic matter, but the DOC remaining after exposure to solar UV light was rendered somewhat more easily degraded by microorganisms. The natural water lost only a few percent of the initial DOC even after 184 d, even with additions of inorganic nutrients. Thus, while PO 4 present in the high concentrations in the area enriched by agricultural runoff appeared to stimulate production of dissolved organic matter, they did not stimulate decomposition of the DOC. The humic fractions isolated from dark controls and light exposed samples lost less than 5% of their DOC to decomposition over 184 d. The hydrophilic acid fraction, however, was rendered far more susceptible to decomposition by prior exposure to sun-
XPS 0086981TX (BIOG) – product element 402624 – Grafikon - 2002-09-25 12:53:16
24
Figure 12. Declines in concentration of DOC and DON over 51 days of incubation in summer sunlight in Durham, NC, USA Each point represents one separate sealed tube harvested on the given day. The hypothesis that the concentration declined significantly over time was tested by showing that the slope of a linear regression of the dependent variable vs. the square root of time was significant. Selection of the square root transformation was based solely on the best empirical fit to several models and does not imply any particular rate relationship.
light. In addition, when the hydrophilic acid fraction was separated from the humic substances and incubated alone, over 30% decomposed
Discussion The relative abundance of inorganic and organic N and P in water The great majority of N in water from most environments of the Everglades is transported in the dissolved organic form. The close correlation between DON and DOC at a C/N ratio of about 20 also probably indicates some common processes involved in the formation of DOM in various different environments. DON is often the most abundant form of N in streams and rivers draining unpolluted forested watersheds (Lewis et al. 1999). The concentrations of DOC, and especially DON, are very high compared to most natural waters (studies reviewed by Thurman (1985) and Lewis et al. (1999)). In the case of P, however, PO 4-P comprized the largest fraction of total P in water. The relatively high percentage of PO 4-P is somewhat unusual compared to most lakes and rivers (Wetzel 1983) and may be related to the near absence of clay sediments which tend to adsorb PO 4-P. The P
XPS 0086981TX (BIOG) – product element 402624 – Grafikon - 2002-09-25 12:53:16
25
Figure 13. Microbial mineralization of previously sunlight exposed and non-exposed DOC during incubations of 21 and 184 d. Samples incubated were: (group 1) original marsh water; original marsh water with P, N, and micronutrient () supplements; (group 2) marsh water incubated aseptically in either sunlight or dark (dark control), for 21 days and then subsequently inoculated with microbes and amended with nutrient supplements; and lastly, (group 3) humic substance or (group 4) hydrophilic acid fractions isolated from sunlight exposed or dark control marsh water and then incubated with microbes and nutrient amendments. Error bars are ± SE for triplicate flasks. This biodegradation experiment was designed to show: (a) the biodegradability of the natural DOM, (b) the relative biodegradability of various fractions, (c) whether humic substances inhibit biodegradation of other fractions, (d) whether exposure to UV light makes the remaining DOM more biodegradable, and (e) whether biodegradation is stimulated by inorganic nutrient supplements. The means indicted by bars were compared within each of groups 1–4, and means that are not significantly different are indicated with the same letter above the bars within each group, using either t-tests (for 2 means), or Duncan’s multiple range tests. Statistical comparisons for the 21 and 184 day periods were done separately.
content of dissolved organic matter is characteristically variable because, unlike N, P is not an integral part of all molecules of dissolved humic substances. Instead, the organic P content is carried by more specific substances that can vary more than other components of the DOM (Qualls and Haines 1991). Causes of patterns in concentration of dissolved organic nutrients The decrease in DOC and DON concentrations along the north to south gradient on WCA-2A and the patterns in the larger area of the Everglades might be explained by several hypotheses which center on 3 aspects–production, regulation of concentration, and degradation. Higher concentrations of dissolved organic nutrients may be caused by (1) greater plant production of soluble organic matter, (2) greater pro-
XPS 0086981TX (BIOG) – product element 402624 – Grafikon - 2002-09-25 12:53:16
26 duction of soluble organic by-products of decomposition in areas where peat is being decomposed faster, (3) regulation of concentration by solubility or adsorption equilibrium with soil of varying composition, (4) less mineralization by solar radiation in areas where the water surface is more shaded, (5) faster rates of biodegradation in some environments. These hypotheses neither exhaustive and nor exclusive but represent the most likely explanation given our observations of the pattern of concentrations. The distribution of dissolved organic nutrients suggests that the higher concentrations in the north of WCA-2A may be due to higher plant production, the presence of cattail which might produce more soluble organic matter, and greater depth of peat which serves as an efficient sorbant and reservoir of potentially soluble organic matter. While the patterns of concentration of DOC and soil P are only a correlation, the estimates of greater production of soluble organic matter in litterfall in the enriched areas provide additional evidence. These patterns suggest an interesting interaction of the P, C, and N cycles in which runoff of phosphate from the Everglades agricultural area causes increased primary production and a change in species composition, both of which act to increase the production of DOC, DON, and DOP. We are not aware of any other studies in which the distribution of DOC concentrations in wetlands has specifically been correlated with higher plant biomass but eutrophication and algal production have been associated with increases in DOC, particularly labile DOC, in lakes (Schindler et al. 1992; Sondergaard et al. 1995). Budgets for the marsh areas of the Everglades and the influence of sorption equilibria It may seem paradoxical that there was no net export of DON from the marshes of WCA-2A since we have the potential for high production of soluble organic matter in litterfall (Table 2). One explanation is that decomposition of the dissolved organic matter balances its production. Another explanation is that high concentrations of DOM can suppress dissolution or desorption of additional DOM. The pattern of import and export of DON (and presumably DOC) suggested the following hypothesis: high concentrations of dissolved organic matter in runoff from ⬙upstream areas⬙ enter the marshes and suppress the net dissolution of more dissolved organics. In a sense, the concentrations of dissolved organic matter are buffered. Inputs of rain and irrigation water into the agricultural area (EAA) from Lake Okeechobee with low DOC concentrations allow the net desorption of DOC and a high net export. Surface runoff entering the marshes from the EAA already contains high concentrations of DOC and DON and this suppresses the further net desorption of potentially soluble organic matter and might even result in a net sorption of DOC–analogous to the experiment in which we added 42 mg L −1 DOC and there was no net production of DOC. Thus, there is no net export from the marsh areas. The high production rates of soluble organic matter in the enriched area of WCA-2A probably add to the reservoir of potentially soluble organic matter and shift the equilibrium concentration higher compared to the less productive areas. In WCA-3A, which is a net sink for DON, in addition to the suppression of desorp-
XPS 0086981TX (BIOG) – product element 402624 – Grafikon - 2002-09-25 12:53:16
27 tion, the very long residence time and exposure to sunlight may favor decomposition of DON. This phenomenon of solubility or sorption equilibrium, as we demonstrated by adsorption experiments, along with sunlight catalyzed decomposition seems to have the strongest influence on the export of dissolved organic nutrients over large areas. In the Everglades Agricultural Area, the high concentration of potentially soluble organic matter in peat could be caused by one or more of the following: (1) inefficient leaching by rain and irrigation water, (2) concentration by evapotranspiration of irrigation water, (3) production by decomposition of peat, or (4) concentration of potentially soluble fulvic acids as the peat (the sorbant) rapidly decomposes and disappears. Which of these is most important we can only determine from further investigation. This sorption-desorption phenomenon in peat has a large capacity to buffer DOC concentrations and could explain the patterns of export of dissolved organic matter from the ecosystems of the Everglades (Table 3). Since the DOC/DON ratios of the solution did not change during the sorption desorption experiments, it is likely that DON behaved in the same manner as DOC. Lewis (2002) summarized the yield (output) of DON as a function of runoff of water from 19 minimally disturbed watersheds in the United States. The gross output (in g m −2 yr −1) of the EAA and WCA-2A are both about 10 times that predicted for their runoff using an equation derived from the 19 watersheds. This might be expected because the watersheds were largely upland watersheds with average DON concentrations of between 200 and 300 g L −1. Other workers have also reported high concentrations of DON in drainage water of farms on the EAA. In a study of several farms, DON averaged about 3900 g L −1 in farm ditches and 2400 g L −1 in main farm canals (Capone et al. 1995). Using data reported in this study for two sugar cane farms, we calculated an export of 1.2 g m −2 yr −1 of DON, which matches our estimate of long term export of 1.2 g m −2 yr −1 from the entire EAA (Table 3). Although DOC was not measured in the South Florida Water Management District survey used for calculation of DON budgets, we can estimate the equivalent DOC export because of the good correlation of DOC with DON, corresponding to a C/N ration of 20 (Figure 7, Table 1). Using this ratio, for the Everglades Agricultural Area we estimate an import, export, and net export of 5.1 29, and 24 g m −2 yr −1 DOC, respectively. For WCA-2A we estimate an import, export, and net export of 78, 78, and 0 g m −2 yr −1 of DOC. Urban et al. (1989) found exports of DOC from 3 peatlands ranged from 8 to 40 g m −2 yr −1. The very high export from WCA-2A is, in part, a result of the large amounts of water flowing in and out of the catchment. One of the most widespread disturbances to peatlands worldwide is drainage that results in subsidence. Apparently the peat soils of the Everglades Agricultural Area continue to produce high concentrations of dissolved organic nutrients even after over 50 years of drainage and the loss of 0.3 to 2 m (Tate 1980) of peat depth through decomposition and compression. Most of the subsidence in the drained soils of the EAA can be attributed to aerobic oxidation (Tate 1980). Could the dissolution and export of dissolved organic matter actually account for a significant
XPS 0086981TX (BIOG) – product element 402624 – Grafikon - 2002-09-25 12:53:16
28 loss of soil? The estimated net export of DOC of about 24 g m −2 yr −1 is only a small portion (0.7%) of the estimates of annual carbon loss of 3300 g m −2 yr −1 in the soil of the Everglades Agricultural Area (Tate 1980). Composition of dissolved organic matter The composition of the Everglades DOC (Figure 11) was remarkably similar to DOC from a wide variety of habitats, including Amazon black waters, soil water in Wyoming, the Appalachians, and the Adirondacks, and stream water in the Appalachians (reviewed in Qualls and Haines (1991)). The percentage of hydrophilic neutral compounds tends to be in the upper end of the range for the literature values. The DOC in an acid peat bog in New England was somewhat different in composition, containing 67% humic substances, 20% hydrophilic acids, and only 3% hydrophilic neutral compounds (McKnight et al. 1985). It would be useful to compare more acid and neutral peatlands but studies of this sort are rare. Dissolution of humic substances from soil is favored by alkaline pH (Thurman 1985). If the slightly alkaline pH values over 8.0 which sometimes occur in the Everglades were active in dissolving humic matter we might expect to see an unusually high proportion of humic substances in the Everglades water but nevertheless, the content of humic substances seems typical. Degradation by solar radiation Physicochemical mineralization of DON and DOC has the capacity to be a significant pathway of mineralization because of the high concentration of DOM and its otherwise refractory nature in the absence of solar radiation. The physicochemical mineralization of DON to NH 4 is a pathway in the N cycle that has only relatively recently been demonstrated (Qualls and Richardson 1993; Bushaw et al. 1996). Three alternative hypotheses could have explained the decline in DON and increase in ammonium in the tubes exposed to the sun (Figure 12, Table 4): (1) photochemical degradation of the bonds binding the N into the organic molecules with ammonium ion as a product, (2) microbial mineralization by microorganisms contaminating the tubes, (3) partial breakdown of organic matter by sunlight into molecules which contaminating microbes could then mineralize, and (4) precipitation. Explanation 2 was eliminated because dark controls did not change significantly. Explanation 3 was eliminated because plating of aliquots of water and swabs of the walls of the tube failed to reveal significant microbial contamination. Explanation 4 was eliminated because filtration of water after incubation did not remove DON and a potassium dichromate digestion (Strickland and Parsons 1972) in the emptied tube failed to detect significant quantities of organic carbon on the inner surface of the tube. After all, or large portions, of individual molecules of humic substances begin to be broken down, the complete mineralization appeared to be very rapid and nearly complete because there was not a major accumulation of smaller organic molecules in the hydrophilic acid or neutral fraction. If the humic molecules had
XPS 0086981TX (BIOG) – product element 402624 – Grafikon - 2002-09-25 12:53:16
29 been partially broken down into small fragments, compounds like formaldehyde, formic acid, pyruvic acid, etc. (see Keiber et al. (1990)), we would have seen a large increase in the hydrophilic acid and hydrophilic neutral fractions as the large molecules were cleaved. There was a small increase in the hydrophilic neutral fraction that may indicate some breakdown into small aldehydes or alcohols but this only accounted for about 18% of the carbon lost from the humic and hydrophilic acid fraction (4.9% of the initial DOC) (Figure 11). The accumulation of low molecular weight aldehydes in the 50 hr experiments of Keiber et al. accounted for only less than 0.1% of the initial DOC. Our experiment indicates that complete mineralization of organic carbon in humic substances can be a more important pathway than partial breakdown to small organic compounds under long exposure to spring or summer sun in the subtropics. Keiber et al. (1990) found that irradiation of natural dissolved organic matter with sunlight for periods up to 50 hr resulted in formation of low molecular weight aldehydes cleaved from humic matter. Most production was due to wavelengths between 290 and 315 nm. They found, as we did, that the humic fraction was the most photochemically labile. This experiment shows that the natural levels of sunlight on the surface of the Everglades water can potentially cause a very significant release of both ammonia and inorganic carbon. Bushaw et al. (1996) have also shown that ammonium can be released photochemically from aquatic dissolved organic matter. They reported that between 7 and 16 percent of the DON was converted to ammonium over a 3 day incubation, results which are similar to ours given that our kinetic experiment showed that most of the photochemical release occurred within the first few days (Figure 12). Thus, this newly discovered pathway in the nitrogen cycle has been demonstrated in aquatic samples from different locations. The humic substance molecules that are completely mineralized also contained N and P atoms. Although the humic fraction comprises about half of the DOC, the humic molecules typically contain a lower percentage of N and P than some of the other fractions (Qualls and Haines 1991) which probably accounts for the fact that only 7% the DON was mineralized, while over 20% of the DOC was mineralized. The bleaching of the DOC when exposed to sunlight suggested that an unusually low absorbance per unit DOC might serve as a ⬙signature⬙ of the influence of solar radiation in the field. Indeed, surface and shallow pore water from the southern Everglades, areas with less shading by macrophytes, were more bleached at 320 nm and had a lower DOC/DON ratio than did water from areas with more shading (Table 1). Other hypotheses, however, might explain these patterns such as a greater percentage of algal derived non-humic DOC. This experiment was only designed to show the maximum potential effects on DOM at the water surface during summer sunlight. In the water column these maximum effects will be reduced by (1) shading by plants and periphyton, and (2) the limited transmission of light around 320 nm (generally 33 to 75% transmittance cm −1, Table 1) caused by the humic substances themselves. Shading by plants will also reduce the photochemical reaction rates on an areal basis. Increased water depth may not necessarily decrease the maximal reaction rates on an areal basis but will tend to dilute the effects as the water column mixes.
XPS 0086981TX (BIOG) – product element 402624 – Grafikon - 2002-09-25 12:53:16
30 Biodegradability of DOM In the absence of solar radiation the DOM was quite refractory and its biodegradation was not significantly limited by inorganic nutrients. In contrast, decomposition of solid litter was stimulated by PO 4 additions in mesocosms in WCA-2A and the P content of microbial biomass was increased by 9 fold (Qualls and Richardson 2000). After exposure of DOM to solar radiation some portion of the humic fraction may have been converted to hydrophilic acids by sunlight and then rendered more susceptible to microbial decomposition. The humic substances may also have been inhibiting the biodegradation of the other fractions. Since UV light can destroy the humic substances, it may also increase the biodegradability of the remaining DOC by removing the inhibitory effects in addition to generating some smaller molecules from the hydrophilic acid fraction which are more accessible to bacterial enzymes. Overall, maximum potential solar UV radiation alone in the surface layer of Everglades water can initially degrade DOC much faster than microbial decomposition but the two processes appear to work in tandem. Other studies have noted photolysis of aquatic DOC (Geller 1986; Keiber et al. 1990; Mopper et al. 1991; Bushaw et al. 1996) and a subsequent increase in biodegradability (Geller 1986; Keiber et al. 1990; Mopper et al. 1991; Wetzel et al. 1995). Wetzel et al. (1995) found that exposure of natural aquatic organic matter to a laboratory source of UV-B radiation resulted in generation of significant quantities of low molecular weight fatty acids and some degradation of lignin derived phenolic components of the natural macromolecules. Factors regulating concentration and export of dissolved organic nutrients The concentrations of DOC, DON (and DOP) in water of the Everglades are a product of inputs (production of new soluble organic matter and imports of DOM in water) exports (microbial decomposition and solar mineralization) and exchanges with the solid organic matter by adsorption and desorption, (see Figure 1). The inputs of new DOC, DON, and especially DOP are substantially increased by increases in plant productivity associated with P enrichment. This increase was not only associated with increased productivity but by a shift in species to cattail, which produces more DOC in newly senesced litter. Another source of input of soluble organic matter could be microbial dissolution of the otherwise insoluble fraction of peat but we were unable to detect a significant rate of microbially induced dissolution into the bulk solution of DOC. The concentrations of DOC, DON, and DOP are also influenced by outputs due to microbial decomposition and mineralization caused by solar radiation. The rate of microbial decomposition in the dark seems very slow compared to other processes of input, hydrologic transport, and adsorption. In fact, natural levels of solar radiation in summer sunlight near the water surface can potentially mineralize the dissolved organic nutrients much faster than microbes can. However, the solar radiation and microbial degradation can work in tandem and complement one an-
XPS 0086981TX (BIOG) – product element 402624 – Grafikon - 2002-09-25 12:53:17
31 other to some extent. Solar radiation degrades the humic fraction, which is the one that is most resistant, and perhaps inhibitory, to microbial degradation. In terms of the eutrophication in the Everglades and other wetlands, it might be considered desirable if the dissolved organic nutrients were not mineralized and simply flowed through the system. To certain extent this is the case. Even under near optimum conditions, (sunlight for 21 days followed by laboratory incubation in the dark for 56 days) less than 36% total of the initial DOC was degraded by all mechanisms. It would be much smaller in the field since not all the water column is exposed to the solar UV. The microbial decomposition of DOC was also not limited by the supply of inorganic nutrients. While the balance of inputs and outputs in WCA-2A might initially suggest little turnover of DOC in the marsh, we suggest that the exchange with a large pool of potentially soluble organic matter by adsorption/desorption replaces DOC consumed by the combination of microbial decomposition and solar radiation. The export of dissolved organic matter in water from the various areas of the Everglades has important implications for downstream sections of the Everglades and Florida Bay. Not only is most N carried in the form of DON but also most Hg is carried complexed with DOC (Strober et al. 1995). We hypothesize that the flowthrough of water and the adsorption equilibria are both very important in controlling the net export of DOC and DON. Sorption and desorption from the peat acts as a buffer and strongly regulates concentration. These processes of input, output, exchange of soluble organic matter and decomposition are likely to be important in other wetlands with accumulations of peat. In other wetlands, hydrologic flowthrough, the concentration of DOM in water, the adsorption properties of peat, the solar radiation reaching the water column and plant productivity are likely to influence the relative importance of the processes discussed in this study.
Acknowledgements We thank Celia Best, Paul Heine, Julie Rice, Eric Waldbauer, and Leslie Czsmas for laboratory assistance. We also thank Robert Johnson, Christopher Craft, and John Zahina for assistance in the field, and the helicopter pilots of Crescent Airways. Research was supported by a grant from the Everglades Agricultural Area Environmental Protection District.
References Abtew W. and Khanal N. 1994. Water budget analysis for the Everglades agricultural area drainage basin. Water Resources Bull. 30: 429–439.
XPS 0086981TX (BIOG) – product element 402624 – Grafikon - 2002-09-25 12:53:17
32 Bushaw K.L., Zepp R.G., Tarr M.A., Schulz-Jander D., Bourbonniere R.A., Hodson R.E. et al. 1996. Photochemical release of biologically available nitrogen from aquatic dissolved organic matter. Nature 381: 404–407. Capone L.T., Izuno F.T., Botcher A.B., Sanchez C.A., Coale F.J. and Jones D.B. 1995. Nitrogen concentrations in agricultural drainage water in South Florida. Trans. Am. Soc. Agr. Eng. 38: 1089– 1098. Craft C.B. and Richardson C. 1993. Peat accretion and phosphorus accumulation along a eutrophication gradient in the northern Everglades. Biogeochem. 22: 133–156. Davis S.M. 1989. Sawgrass and cattail production in relation to nutrient supply in the Everglades. In: Sharitz R.R. and Gibbons J.W. (eds), Freshwater Wetands and Wildlife. CONF-8603101, DOE Symposium series no. 61. USDOE Office of Scientific and Technical Information, Oak Ridge, TN, USA, pp. 325–341. Davis S.M. 1991. Growth, decomposition, and nutrient retention of Cladium jamaicense Crantz and Typha domengensis Pers. in the Florida Everglades. Aquatic Bot. 40: 203–224. Ellert B.H. and Bettany J.R. 1988. Comparison of kinetic models for describing net sulfur and nitrogen mineralization. Soil Sci. Soc.Am. J. 52: 1692–1702. Geller A. 1986. Comparisons of mechanisms enhancing biodegradability of refractory lake water constituents. Limnol. Oceanogr. 31: 755–764. Hemond H.F. 1980. Biogeochemistry of Thoreau’s Bog, Concord, Massachusetts. Ecol.Monogr. 50: 507–526. Izuno F.T., Sanchez C.A., Coale F.J., Bottcher A.B. and Jones D.B. 1991. Phosphorus concentrations in drainage water in the Everglades Agricultural Area. J. Environ. Qual. 20: 608–619. Keiber J.R., Zhou X. and Mopper K. 1990. Formation of carbonyl compounds from UV-induced photodegradation of humic compounds in the sea. Limnol. Oceanogr. 35: 1503–1515. Koroleff F. 1985. Simultaneous oxidation of nitrogen and phosphorus compounds by persulfate. In: Grasshoff K., Eberhardt M. and Kremling K. (eds), Methods of Seawater Analysis. 2nd edn. Verlag Chemie, Weinheimer, Germany. Leenheer J.A. 1981. Comprehensive approach to preparative isolation and fractionation of dissolved organic carbon from natural waters and waste waters. Environ. Sci. Technol. 15: 578–587. Lewis W.M. Jr 2002. Yield of nitrogen from minimally disturbed watersheds of the United States. Biogeochem. 57: 375–385. Lewis W.M. Jr, Melak J.M., McDowell W.H., McClain M. and Richey J.E. 1999. Nitrogen yields from undisturbed watersheds in the Americas. Biogeochem. 46: 149–162. Lodenius M., Seppanen A. and Uusi-Rauva A. 1983. Sorption and mobilization of mercury in a peat soil. Chemosphere 12: 1575–1581. McKnight D., Thurman E.M. and Wershaw R.L. 1985. Biogeochemistry of aquatic humic substances in Thoreau’s bog, Concord, Massachusetts. Ecology 66: 1339–1352. Mopper K., Zhou X., Kieber R.J., Sikorski R.J. and Jones R.D. 1991. Photochemical degradation of dissolved organic carbon & its impact on the oceanic carbon cycle. Nature 353: 60–62. Qualls R.G. and Haines B.L. 1992. Biodegradability of dissolved organic matter in forest throughfall, soil-solution, and streamwater. Soil Sci. Soc.Am. J. 56: 578–586. Qualls R.G. and Haines B.L. 1991. Geochemistry of dissolved organic nutrients in water percolating through a forest ecosystem. Soil Sci. Soc. Am. J. 55: 1112–1123. Qualls R.G., Haines B.L., Swank W.T. and Tyler S.W. 2002. Retention of dissolved organic nutrients by a forested ecosystem. Biogeochem. (in press). Qualls R.G. and Richardson C.J. 1991. Water chemistry along a nutrient enrichment gradient in the Everglades. In: Richardson C.J. (ed.), Report to Everglades Agricultural Area Environmental Protection District. Duke University Wetland Center Pub., Belle Glade, FL, USA, pp. 91–98. Qualls R.G. and Richardson C.J. 1993. Geochemistry of dissolved organic nutrients in the Everglades. Agronomy Abstracts 1993. American Society of Agronomy. Qualls R.G. and Richardson C.J. 1995. Forms of soil phosphorus along a nutrient enrichment gradient in the northern Everglades. Soil Sci. 160: 183–198.
XPS 0086981TX (BIOG) – product element 402624 – Grafikon - 2002-09-25 12:53:17
33 Qualls R.G. and Richardson C.J. 2000. Phosphorus enrichment affects litter decomposition, immobilization, and microbial biomass phosphorus in wetland mesocosms. Soil Sci. Soc. Am. J. 64: 799– 8008. Reddy K.R., O’Conner G.A. and Schelske C.L. (eds) 1999. Phosphorus Biogeochemistry in Subtropical Ecosystems. Lewis Publishers, Boca Raton, Florida, USA. Schindler D.W., Bayley S.E., Curtis P.J., Parker B.R., Stainton M.P. and Kelly C.A. 1992. Natural and human-caused factors affecting the abundance and cycling of dissolved organic substances in precambriam shield lakes. Hydrobiol. 229: 1–21. Sondergaard M., Hansen B. and Markager S. 1995. Dynamics of dissolved organic carbon lability in a eutrophic lake. Limnol. and Oceanogr. 40: 46–54. South Florida Water Management District 1992. Surface Water Improvement and Management Plan for the Everglades. Vol. 3. South Florida Water Management District, West Palm Beach, FL, USA. Strickland J.D.H. and Parsons T.R. 1972. A Practical Handbook of Seawater Analysis. Bulletin of the Fisheries Research Board of Canada 167 2nd edn. Strober Q.J., Jones R.D. and Scheidt D.J. 1995. Ultra-trace level mercury in the Everglades ecosystem: a multi media canal pilot study. Water Air Soil Pollut. 80: 991–1001. Tate R.L. 3rd 1980. Microbial oxidation of histosols. Advances in Microbial Ecology 4: 169–210. Thurman E.M. 1985. Organic Geochemistry of Natural Waters. Nijhoff/Junk Publishers, Dordrecht. Travnik L.R. 1992. Allochthonous dissolved organic matter as an energy source for pelagic bacteria and the concept of the microbial loop. Hydrobiol 229: 107–114. Urban N.R., Bayley S.E. and Eisenreich S.J. 1989. Export of dissolved organic carbon and acidity from peatlands. Water Resources Res. 25: 1619–1628. Walker W.W. 1999. Long-term water quality trends in the Everglades. In: Reddy K.R., O’Conner G.A. and Schelske C.L. (eds), Phosphorus Biogeochemistry in Subtropical Ecosystems. Lewis Publishers, Boca Raton, Florida, USA, pp. 447–466. Wetzel R.G. 1983. Limnology. 2nd edn. Saunders, NY, USA. Wetzel R.G. 1996. Limnological Analyses. 2nd edn. Springer-Verlag, NY, USA. Wetzel R.G., Hatcher P. and Bianchi T. 1995. Natural photolysis by ultraviolet irradiance of recalcitrant dissolved organic matter to simple substrates for microbial metabolism. Limnol. Oceanogr. 40: 1369–1380.
XPS 0086981TX (BIOG) – product element 402624 – Grafikon - 2002-09-25 12:53:17


![export dependence and export concentration - UNDP [PDF]](https://m.moam.info/img/260x300/export-dependence-and-export-concentration-undp-pd_64a5edbd098a9ecd2c8b4631.jpg)