Available online at www.sciencedirect.com
Procedia Engineering
Procedia Engineering Procedia Engineering011 (2009) (2009)000–000 171–176
www.elsevier.com/locate/procedia www.elsevier.com/locate/procedia
Mesomechanics 2009
Failure modeling of multiphase steels using representative volume elements based on real microstructures Vitoon Uthaisangsuk*, Ulrich Prahl, Wolfgang Bleck Department of Ferrous Metallurgy, RWTH Aachen University, Intzestr. 1, 52072, Aachen, Germany Received 24 February 2009; revised 29 April 2009; accepted 5 May 2009
Abstract The current work aims at predicting of damage and failure in multiphase steels (Dual phase and transformation-induced plasticity (TRIP) steels) during production processes. These kinds of steel consist of a ferritic matrix with dispersed second phases like bainite, martensite and retained austenite. A microstructure-based approach by means of representative volume elements (RVE) is used taking into account carbon partitioning for the flow curve description of each individual phases. With the help of the RVE it is possible to establish a link between the microstructure and the macroscopic failure behavior. In the case of DP-steels, the real microstructures were investigated in a two-dimensional approach. A cohesive zone model (CZM) has been used to study the debonding analysis of the martensitic islands from the ferrite parent phase. To describe the ductile damage of the ferritic matrix, the Gurson-Tvergaard-Needleman model (GTN) was applied. The parameter identification for the CZM and GTN models is based on metallographic investigations and fracture surface analysis. The calculated stress-strain distribution in the heterogeneous microstructure was studied. The investigations provide a physically-based correlation between the multiphase microstructures, mechanical properties, and failure behavior of multiphase steels for automotive applications. © 2009 Elsevier B.V. All rights reserved Keywords: Multiphase steels; Failure; Microstructure; Representative volume elements
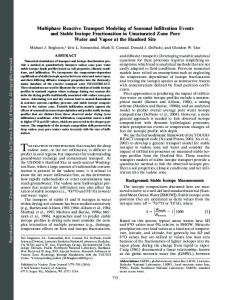
1. Fracture in multiphase steels Experimental investigations for establishing the correlation between microstructure and fracture of multiphase steels were reported in [1]. On the micro scale, two failure modes were found, cleavage and ductile fracture. Fig. 1 (a) illustrates a fracture surface of the examined low-alloy TRIP steel after tensile test. It was noticed that the fracture mechanisms depend on the stress-strain conditions, the internal purity, the volume fraction of the retained austenite, and the location of the austenite and martensite islands in the microstructure. DP steels with higher martensite fraction show increased strength because of the hardly deformable martensite. During the heat treatment of DP steels the austenite-martensite transformation takes place leading to volume expansion. Thus, mobile dislocations arise at phase boundaries surrounding the ferritic matrix. These high dislocation densities areas are responsible for the continuous yielding behavior and the high initial work hardening
* Corresponding author. Tel.: +49-(0)241-80-95841; fax: +49-(0)241-80-92253. E-mail address:
[email protected].
doi:10.1016/j.proeng.2009.06.040
172
V. Uthaisangsuk et al. / Procedia Engineering 1 (2009) 171–176 Uthaisangsuk V. et al. / Procedia Engineering 01 (2009) 000–000
rate. DP steels with banded martensitic structure or large martensite islands exhibit low elongation to fracture. It was also observed that a coarse dual phase microstructure exhibits a much lower value of elongation to fracture, but higher strength than a fine dual phase microstructure [2, 3]. Failure in the coarse structure is due to the initiation of cleavage cracking of martensite at low strain levels. The failure in fine dispersed structures occurs by void nucleation and void coalescence with regard to decohesion of interface between the ferrite matrix and the martensite islands. For TRIP steels the presence of martensite in the initial microstructure can lead to early crack initiation. Increased stress triaxiality accelerates the TRIP effect and crack growth in the microstructure. The strong dependence of the rate of martensite transformation on the stress triaxiality originates from the volume expansion involved in the martensite formation. The volume expansion hinders damage development in the microstructure by delaying the void nucleation. The influence of the TRIP effect on damage is related to the volume fraction of martensite and its mechanical properties depending on carbon content [4, 5]. Chatterjee [6] showed that in TRIP steels small hard martensite does not readily crack, as the load transfer onto the martensite is difficult by straining the microstructure. Long plates of martensite transformed from the austenite with coarse grain size lead to earlier cracking. The behavior of void nucleation and void coalescence of TRIP steels was investigated by means of Electron Backscatter Diffraction (EBSD) in [7]. It was found that the void formation takes place in areas characterized by high hardness gradient. In fact, the void growth preferentially proceeds along grain and phase boundaries. When the austenite-martensite transformation in TRIP steel occurs at low deformation, voids will nucleate due to the newly formed high strength martensite. When first transformation occurs at higher strains, the voids are more likely to form at the grain boundaries of ferrite or inclusions. Fig. 1 (b) and (c) show the micrographs and secondary electron images of TRIP steel after tensile test at uniform elongation. Many small voids were detected exactly in the vicinity of austenitic grains, Fig. 1 (b). The phase transformation leads to volume expansion and local stress concentration in the microstructure. The increased dislocation density promotes void nucleation. Some voids were also observed at the grain boundaries of ferrite, Fig. 1 (c).
(b)
α´
α αΒ
(a)
Cleavage fracture
5 μm
Dimple fracture
TRIP-Al-0,5-B
(c) 5 μm
5 μm
Fig. 1. Fracture surface of a TRIP steel. (a), Micrographs and secondary electron images of a TRIP steel at uniform elongation. Voids were observed in the regions with high dislocation density (b) and at the grain boundaries of the ferrite (c).
2. Micromechanical damage modeling Firstly, the microstructures of investigated steels were analyzed using light optical metallography (LOM) and percentages of individual phases were identified. Uniaxial tensile tests and hydraulic bulge tests were performed to determine the macroscopic mechanical properties of these steels. In this work, Representative Volume Element (RVE) was used to describe different multiphase microstructures, their morphologies, distribution, as well as failure behavior at the micro scale. The RVE model represents a periodic repeating cell, which describes a cut-out of the whole microstructure. The RVE-based approach makes it possible to characterize the influences of each modeled
173
V. Uthaisangsuk et al. / Procedia Engineering 1 (2009) 171–176 Uthaisangsuk V. et al. / Procedia Engineering 01 (2009) 000–000
1500
1500
1200
1200 True stress [MPa]
True stress [MPa]
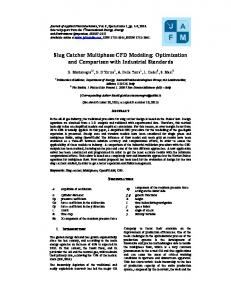
phase on the overall strength of material. A 2D RVE was generated on the basis of real micrographs. 3D cubeshaped RVEs were defined and the phase fractions measured by the LOM were taken into account. A statistical algorithm was implemented to describe the random distribution of phases within the RVE. The 3D RVE for a TRIP microstructure consisting of 55% ferrite, 35% bainite, 5% austenite, and 5% martensite is illustrated in Fig. 2 (a). Multiphase steels usually exhibit approximately isotropic mechanical properties. In this work, effective isotropic formulations for the flow behaviors of each individual phase were assumed using the von Mises elastic plastic material law. The constitutive models for the flow curves are the function of chemical composition of material, and microstructural characteristics [8-10]. In general, the local carbon content is an important factor to incorporate. During the annealing process, carbon partitioning takes place, which influences the volume fraction of different phases and their mechanical properties. The true stress-strain curves used for the different individual phases in the RVE simulations and their estimated percentage of carbon contents are depicted for steels DP600 and TRIP600 in Fig. 2 (b). FE simulations of the 3D RVE applying uniform tensile boundary condition were carried out for the investigated microstructures to verify the effective mechanical properties of each constituent phase. Averaged stressstrain responses calculated by the RVE simulation were compared with the experimentally determined true stressstrain curves obtained using both tensile and hydraulic bulge tests. The comparisons in Fig. 2 (b) show acceptable agreements between calculations and experiments.
900
600
Ferrite %C=0.008 Martensite %C=0.245
600
Retained Austenite %C=1.3266% Ferrite %C=0.02 Bainite %C=0.03
exp. Tensile test
300
900
300
exp. Tensile test
exp. Bulge test
55% α
+
35% αB
+
5% γ
+
5% α´
=
DP600
RVE
exp. Bulge test
RVE simulation
0
(a)
TRIP600
RVE simulation
0.2
0.4 True strain [-]
0 0
0.2
0.4 True strain [-]
0.6
0.8
0
0.6
0.8
75% ferrite 73% ferrite 15% austenite 27% martensite 10% bainite (b)
Fig. 2. (a) 3D RVE for a TRIP microstructure; (b) flow curves used for the single phases in DP600 and TRIP600, comparisons of experimentally determined and calculated stress-strain responses, and corresponding RVEs for the two microstructures.
Based on the fracture mechanisms described in the experimental results, failure criteria for multiphase steels have been determined. The GTN damage model was formulated for ductile damage development within the ferritic phase. The evolution of ductile damage in metal can be classified into three phases: void nucleation at the neighborhood of defects, voids grow by plastic deformation, and voids coalescence leading to mesocracks. In the GTN model, influence of the void evolution on the yielding behavior of material is considered by the modification of the isotopic von Mises yield potential. The yield potential describing a spherical body made of a ductile matrix material containing a spherical void is given by [11, 12]: ⎛σ Φ =⎜ V ⎜σ ⎝ y
2
⎞ ⎛ ⎞ 2 ⎟ + 2q1 f * cosh ⎜ 3 q2 σ H ⎟ − 1 + q3 f * = 0 ⎜2 σ ⎟ ⎟ y ⎠ ⎝ ⎠
(
)
(1)
where σV is the von Mises equivalent stress, σy is the yield stress of the matrix material and σH is the hydrostatic stress. Parameter f describes the damage in the form of void volume fractions. The modified void volume fraction, f*, is proposed in order to take into account the stress carrying capacity loss associated with void coalescence. q1, q2, q3 are the fit model parameters. The GTN model considers an initial volume fraction, f0, of primary voids which will
174
V. Uthaisangsuk et al. / Procedia Engineering 1 (2009) 171–176 Uthaisangsuk V. et al. / Procedia Engineering 01 (2009) 000–000
grow after the onset of plastic deformation. Additionally, secondary voids, with a volume fraction fN, emerge at the characteristic equivalent plastic strain, εN, with a specific standard deviation SN. This secondary void nucleation at higher plastic strains is described using a strain dependent nucleation term. Subsequently, void growth takes place due to the hydrostatic stresses. The growth of voids is described based on the assumption of incompressible matrix material. After the void volume fraction, f, reaches a critical value, fc, void interaction occurs and accelerates the stress carrying capacity loss. In addition, CZM was applied in the RVE between phases to consider interface debonding in microstructures. Cohesive interface elements are defined between the continuum elements. When damage occurs, the interface elements gradually lose their stiffness until failure takes place, and the continuum elements are disconnected. For this reason, the crack can only propagate along the element boundaries. In the simulation the separation of cohesive interfaces depends on the normal and shear cohesive stress T0N and T0T acting on the surface of the interfaces. Regarding failure criterion the continuum elements connected by these cohesive elements become disconnected, when the normal and tangential component of separation, δN, and δT reach critical values, δ0N and δ0T , respectively. The integral of the traction as a function of separation until the critical separation δ0 provides the energy dissipated by the cohesive element at failure, Γ0. The local failure criterion for the cohesive zone is defined by the integration, expressed as [13]: δ0
Γ 0 = ∫ T (δ ) ⋅dδ
(2)
0
RVE simulations using GTN and CZM model were performed for different sheet metal forming tests. The RVEs were chosen to model critical locations within the samples where crack initiation was experimentally detected. The intention was to study the influence of the triaxiality on crack initiation in relation the microstructures. Thus, boundary conditions for the RVEs were obtained from the local deformation fields in the macroscopic simulations. This is a weak macro-micro-coupling as the two simulations on different scales were carried out in succession. 3. Results TRIP600, y = 190 mm 160
h = 2/3 Step 35
Step 60
120
Force [kN]
Step 26
80 Experiment
40
elast.-plast. Simulation RVE failure (GTN)
0 0
10
20
30
40
50
60
Punch stroke [mm]
Step 80
Step 110
(b)
Step 150
DP600, D 0 = 10mm
critical element
18
Force [kN]
15
Experiment
h = 0.34
elast.-plast. Simulation
12
RVE failure (GTN)
9 6 3
(a)
0 0
5
10
15
Punch stroke [mm]
20
25
(c)
Fig. 3. (a) Damage evolution in a 2D volume element with one martensitic island of a DP600 steel. Also shown numerical and experimental loaddisplacement curves and failure prediction by the RVE simulations with the GTN model. FE macroscopic models and RVE simulations are depicted for (b) TRIP600 by stretching test and (c) DP600 by hole expanding test. (h is the stress triaxiality)
In this section some results of the RVE simulations will be presented. A 2D RVE simulation based on a real microstructure were performed to describe the phenomenological damage development in the dual phase microstructure of steel DP600. The CZM model was applied to represent the debonding of the interfaces between martensitic islands and ferritic grains. In addition, a standard brittle cracking law was defined for the martensite. Uniaxial deformation was applied in the x-direction. Fig. 3 (a) shows the calculated damage evolution and
175
V. Uthaisangsuk et al. / Procedia Engineering 1 (2009) 171–176 Uthaisangsuk V. et al. / Procedia Engineering 01 (2009) 000–000
equivalent plastic strains in the RVE containing one martensitic island. The first crack initiates due to the brittle failure in the martensitic phase (step 26, Fig. 3 (a)). After the initiation, the crack propagates in the martensitic island, as well as over the interface between ferrite and martensite (step 35, Fig. 3 (a)). This crack then propagates along the entire interface between phases (step 80 and 110, Fig. 3 (a)). The last step shows the final crack after approximately 10% uniaxial deformation. RVE simulation was also used to predict the failure in Nakazima stretching-forming tests and hole expansion tests for steel TRIP600 and DP600 steel. The 3D RVE were modeled for the critical area in the middle of the deformed dome and at the hole edge. The GTN model was implemented for the softer ferritic matrix in the RVE model to describe the ductile damage evolution in the microstructure. The numerically predicted failures were compared with the experimental results for steel TRIP600 for the Nakazima stretching test of a 190 mm wide sample in Fig. 3 (b) and for steel DP600 for the hole expanding test performed on a sample with initial hole diameter of 10 mm in Fig. 3 (c). The results show acceptable prediction of formability for both multiphase steels in the stretch-forming test as well as in the hole expansion test. Additionally, in 3D RVEs cohesive elements were generated at the interfaces between ferrite and martensite phases for a dual phase microstructure. The GTN model was applied for the ferritic phase using the same parameters for all simulations. The degradation of the interface was described by the CZM elements. The traction-separation law defined by Scheider [14] was used, together with the CZM parameters sets shown in Table 1. The simulations were performed under uniaxial tension deformation. Table 1. CZM damage parameters for the RVE simulation of a DP steel
CZM parameters Cohesive stress, T0 [MPa] Cohesive energy, Γ [N/mm]
1 500 100
Parameter set 2 1500 100
3 1500 50
Stress-strain responses determined from the 3D simulations with CZM elements are compared in Fig. 4 (a) for all parameter sets. The stress-strain curves show similar trends for all parameters' sets. Calculations were terminated at failure of the RVE as indicated in Fig. 4 (a) as well. The failure predictions by the 3D RVE simulation using parameter sets (1) and (2) are very similar. The overall stress level and even the failure prediction in the 3D RVE simulation were not influenced by the cohesive stress T0. A lower cohesive energy caused earlier failure (parameter set (3)). The stress distribution in the RVE calculated by CZM parameter set (2) can be seen in Fig. 4 (a). Inside the deformed RVE the interface debonding between ferrite and martensite was locally observed. This happens in regions where two neighboring martensitic islands were located very closely to each other. This phase debonding will give rise to the microcrack initiation in the microstructure. Furthermore, a 3D RVE was generated on the basis of real microstructure of a DP steel. This DP steel was annealed to obtain a dual phase microstructure with coarse grain sizes. Using this coarse microstructure the generation of a 3D model is facilitated, as the morphologies can be clearly distinguished. The investigated microstructure was considered to consist of a ferritic matrix and a second phase, martensite. A procedure similar to that reported in [15] was used to collect the 3D microstructure data. Individual micrographs of each 2D section were recorded using optical microscopy. Approximately the same amount of material was removed after each photograph by manual polishing. Vickers micro hardness indentations were used both to enable image alignment and to determine material removal rates. The depth of each removal section decreases from the first layer to the last layer. A mean sectioning depth of about 6 μm was chosen and overall eight layers were incorporated. A representative region in the microstructures was converted firstly into a 2D FE model for all micrograph layers, Fig. 4 (b). Subsequently, these 2D models were stacked on each other to generate a 3D model using brick elements (C3D8). The 3D FE model of a sub-volume of the microstructure, measuring 45 x 45 x 41.3 μm, was reconstructed with 108045 elements, as shown in Fig. 4 (c). The dimension of an element is 0.918 x 0.918 x 0.918 μm. The RVE was loaded under uniaxial tensile deformation in the y-direction. The flow curves for ferrite and martensite in DP microstructure as mentioned before were used in the simulation. As a result, strain and stress distributions for both phases in the RVE after a uniaxial strain ε of 1.0 were found to be quite distinctive, as shown in Fig. 4 (c). The next step is to develop a real microstructure-based RVE model of a TRIP steel consisting of four individual phases. The
176
V. Uthaisangsuk et al. / Procedia Engineering 1 (2009) 171–176 Uthaisangsuk V. et al. / Procedia Engineering 01 (2009) 000–000
strain-induced austenite-martensite transformation will be considered. A highly inhomogeneous stress-strain partitioning is expected that will lead to a more complex damage behavior. deformed state at ε = 1.0
initial state 700 failure set (1)
600
True stress [MPa]
500
failure set (3)
failure set (2)
400
300
200
100
0 0
0.02
0.04
0.06
0.08
True strain [-]
0.1
0.12
0.14
ferritic matrix martensite
(a)
(b)
(c)
Fig. 4. (a) Computed stress-strain curves from RVE simulations with CZM elements at the interfaces using different parameters and the stress distribution in the RVE for parameter set (2); (b) 2D RVE model and (c) constructed 3D RVE model in the initial state and after uniaxial deformation ε = 1.0 based on real microstructure of steel DP600.
References 1. Papaefthymiou S, Prahl U, Bleck W, Van der Zwaag S, Sietsma J. Experimental observations on the correlation between microstructure and fracture of multiphase steels. Int J Mater Res 2006; 97: 1723-1731. 2. He XJ, Terao N, Berghezan A. Influence of martensite morphology and its diepersion on mechanical properties and fracture mechanisms of Fe-Mn-C dual phase steels. Met Sci 1984; 18: 367-373. 3. Kim NJ, Thomas G. Effects of morphology on the mechanical behaviour of a dual phase Fe/2Si/0.1C steel. Metall Mater Trans A 1981; 12: 483-489. 4. Olson GB. Transformation Plasticity and Toughening. J Phys IV 1996; C1-407. 5. Jacques P, Furnémont Q, Pardoen T, Delannay F. On the role of martensite transformation on damage and cracking resistance in TRIPassisted multiphase steels. Acta Mater 2001; 49: 139-152. 6. Chatterjee S, Bhadeshia HKDH. TRIP-assisted steels: cracking of high-carbon martensite. Mater Sci Technol 2006; 22 (6): 645-649. 7. Imlau J, Bleck W, Zaefferer S. Crack development in dependence of the local microstructure in Al-TRIP steels. In: Proc. Conference New Developments on Metallurgy and Applications of High Strength Steels, Buenos Aires, 2008. 8. Prahl U, Papaefthymiou S, Uthaisangsuk V, Bleck W, Sietsma J, Van der Zwaag S. Micromechanical based modelling of properties and failure of multiphase steels. Comput Mater Sci 2007; 39 (1): 17-22. 9. Bergstroem Y. A dislocation model for the stress-strain behaviour of polycrystalline α-Fe with special emphasis on the variation of the densities of mobile dislocations. Mater Sci Eng 1969/1970; 5: 193-200. 10. Rodriguez RM, Gutierrez I. Unified formulation to predict the tensile curves of steels with different microstructures. Mater Sci Forum 2003; 426-432: 4525-4530. 11. Tvergaard V, Needleman A. Analysis of the cup-cone fracture in a round tensile bar. Acta Mater 1984; 32: 157-169. 12. Needleman A, Tvergaard V. An analysis of ductile rupture modes at a crack tip. J Mech Phys Solids 1987; 35: 151-183. 13. Cornec A, Scheider I, Schwalbe KH. On the practical application of the cohesive model. Eng Fract Mech 2003; 70: 1963-1987. 14. Scheider I, Brocks W. The effect of the traction separation law on the results of cohesive zone crack propagation analyses. Key Eng Mater 2003; 251-252: 313-318. 15. Lewis AC, Geltmacher AB. Imaged-based modelling of the response of experimental 3D microstructures to mechanical loading, Scr Mater 2006; 55: 81-85.