APPLIED PHYSICS LETTERS 95, 042504 共2009兲
Fast Fourier transform spectrometer readout for large arrays of microwave kinetic inductance detectors S. J. C. Yates,1,a兲 A. M. Baryshev,1,2 J. J. A. Baselmans,1 B. Klein,3 and R. Güsten3 1
SRON, Sorbonnelaan 2, 3584 CA Utrecht, The Netherlands Kapteyn Astronomical Institute, University of Groningen, P.O. Box 800, 9700 AV Groningen, The Netherlands 3 Max-Planck-Institut für Radioastronomie, Auf dem Hügel 69, 53121 Bonn, Germany 2
共Received 13 March 2009; accepted 3 June 2009; published online 29 July 2009兲 Microwave kinetic inductance detectors have great potential for large, very sensitive detector arrays for use in, for example, submillimeter imaging. Being intrinsically readout in the frequency domain, they are particularly suited for frequency domain multiplexing allowing ⬃1000 s of devices to be readout with one pair of coaxial cables. However, this moves the complexity of the detector from the cryogenics to the warm electronics. We present here the concept and experimental demonstration of the use of fast Fourier transform spectrometer readout, showing no deterioration of the noise performance compared to the low noise analog mixing while allowing high multiplexing ratios. © 2009 American Institute of Physics. 关DOI: 10.1063/1.3159818兴 The far-infrared 共FIR兲 and submillimeter wavelength bands 共10– 1000 m兲 contain a plethora of information on the evolution and formation of galaxies, stars, and planetary systems. Future FIR and submillimeter space missions, such as the JAXA space infrared telescope for cosmology and astrophysics 共SPICA兲1 and Millimetron2 require large arrays of detectors with an unprecedented high sensitivity, expressed in a noise equivalent power 共NEP兲 of ⬍2 ⫻ 10−19 W / Hz1/2. Also, many ground-based telescopes like IRAM,3 APEX4 and future observatories such as CCAT5 require very large arrays for faster observation speeds and larger instantaneous fields-of-view. Microwave kinetic inductance detectors 共MKIDs兲6,7 are a rapidly developing detector technology8–10 that has the potential to be used to fabricate very large imaging arrays for the FIR, submillimeter,11 optical and x ray.12 The main advantages of MKIDs over other detector technologies are 共i兲 ease of fabrication, 共ii兲 intrinsically adapted to frequency domain multiplexing 共FDMUX兲 using microwave readout signal frequencies, and 共iii兲 operation with a wide dynamic range. Currently, MKIDs have shown sufficient sensitivities in a laboratory environment for both ground-based and space-based instruments13 and there has been an initial demonstration at the CSO telescope.11 However, FDMUX of MKIDs has yet to be satisfactorily demonstrated, particularly anywhere near the 共power and weight兲 requirements needed for space. Previous measurements have been nonscalable using either analog mixing to readout one MKID, which has proven useful in single detector characterization in a laboratory environment, or digital mixing using specialist chips.14 Using the latter technique, a readout of 16 MKIDs has been demonstrated using one commercial demultiplexer card. However, the technique is hard to scale to very large pixel numbers.14 In this letter we present a MKID readout scheme based upon frequency division multiplexing and a digital fast Fourier transform spectrometer 共FFTS兲.15,16 Digital FFTS systems are presently being used as back-end electronics for heterodyne mixers on several ground-based telescopes.16 They can process a real a兲
Electronic mail:
[email protected].
0003-6951/2009/95共4兲/042504/3/$25.00
time data stream with a bandwidth of up to 1.8 GHz into a frequency spectrum of ⬃8000 points. We propose here to use the FFTS to read out a set of single frequency probe signals that have passed through a chip containing one MKID detector per probe signal. This readout is able able to read out ⬃1000 pixels using one probe signal generator and one FFTS board. To demonstrate the principle, we describe an experiment where we have read out eight MKIDs simultaneously and we have measured both the dark detector NEP and the response to an optical signal for eight MKIDS. These results are compared to a conventional analog single MKID readout scheme and show that the FFTS based multiplexed readout does not deteriorate the intrinsic system noise of our setup, which is limited by the first stage cryogenic amplifier. MKIDs are superconducting pair breaking detectors that sense the change in the complex surface impedance of a thin superconducting film due to radiation absorption with a 共sky兲 frequency Frad ⬎ 2⌬ / h, which is ⬃80 GHz for aluminum. An MKID consists of a thin superconducting film that is incorporated in a resonance circuit which is either capacitively6 or inductively17 coupled to a through line. Changes in the surface impedance of the film are converted to changes in the resonator quality factor and resonance frequency. These changes can be read out by measuring the phase and amplitude modulation of a probe tone at a probe frequency equal or close to the resonator resonance frequency F0, which is typically a few GHz. MKIDs take advantage of the fact that a superconductor at Tc/10 has negligible losses at the probe frequency f 0. This enables very low 3 dB bandwidth ␦ f resonators with high Q factors f 0 / ␦ f ⬃ 106. Hence, close packing of the resonators in 共readout兲 frequency space is only limited by placement tolerance 共⬃1 MHz at f 0 ⬃ 3 GHz兲. For example, using a conventional one octave bandwidth amplifier 共4–8 GHz兲 one can read out ⬃4000 MKIDs using just one pair of coaxial cables. The readout scheme shown in Fig. 1. A set of eight intermediate frequency 共IF兲 probe tones in a band from 0.1– 300 MHz are generated by a 1 GSPS 共1 ⫻ 109 samples per second兲 commercial arbitrary waveform generator 共AWG兲 with a 12-bit digital-to-analog converter 共DAC兲. The set frequencies are an integer multiple of 250 Hz due to the length
95, 042504-1
© 2009 American Institute of Physics
Author complimentary copy. Redistribution subject to AIP license or copyright, see http://apl.aip.org/apl/copyright.jsp
Appl. Phys. Lett. 95, 042504 共2009兲
Yates et al. 1.0
SG1
~
AWG FFTS
downconverter
f (GHz)
ADC
FFTS board PC
(a) 0.5
0.0
2 channel ADC SG2
0
switch IQ mixer
~
P (dBm)
PC
Cryostat
DAC
f (GHz)
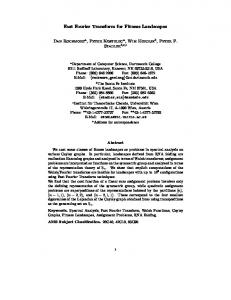
FIG. 1. The circuit diagram for test in this experiment. The readout signal is generated in software from the known MKID resonance frequencies in the IF 共0.1–300 MHz兲 and converted to analog by the DAC of the AWG card. The signal is then mixed with signal generator 1 共SG1兲 up to ⬃4 – 4.3 GHz using an upconverter 共inset lower right兲, passes through the MKIDs, amplified and down converted back to the IF band. A last amplification step follows before digitization and processing by the FFTS. For comparison, by using a microwave switch we can switch from the FFTS readout to a conventional single pixel readout scheme using an IQ mixer and a separate LO 共SG2兲 at the resonance frequency of one of the MKIDs.
of the circular buffer of the AWG. Subsequently they are mixed to the required readout at radio frequency 共rf兲 of 4–4.3 GHz by a commercial single sideband upconverter using a local oscillator 共LO兲 frequency of 4 GHz from SG1 共example tones shown in the inset Fig. 1兲. The resulting signal consists of a set of rf frequency probe tones, where each tone corresponds to one MKID while additional blind tones can be added to measure the system noise. The tones are run at as high a level as possible to use the full scale of the DAC and minimize the level of the LO leakage into the rf signal. Subsequently, the signals are attenuated using microwave attenuators at room temperature, 4 and 1 K to the required level MKID readout power of ⬃−90 dBm per MKID. The signals pass through the MKID chip that is cooled to a temperature of 100 mK. The tones are modulated by the MKIDs, amplified at 4 K by a low noise amplifier 共Tn = 4 K兲 and passed out of the cryostat. Here, a microwave switch enables the use of the FFTS readout or a conventional single tone readout 共IQ readout兲13 of one of the eight multiplexed MKIDs. For the single tone IQ readout, the rf probe signal is passed to an IQ 共quadrature兲 mixer where the LO is generated by a second signal generator 共SG2兲 tuned to the exact probe tone frequency of one of the resonators. The two signal generators, DAC card, and FFTS board are phase locked using a 10 MHz reference clock to reduce the relative clock jitter. By changing the SG2 frequency we can switch between all eight probe tones. The IQ mixer outputs the inphase 共I兲 and quadrature-phase 共Q兲 signals of the tone of the selected MKID at baseband that is then digitized using a dual channel 16 bit analog-to-digital converter 共ADC兲 at 2 ⫻ 105 samples/ s. For the multiplexed FFTS readout, the rf probe signals go to a downconverter which is driven by the same LO as the upconverter 共SG1兲. As a result the rf probe tones are converted back to the exact same IF frequencies as the original IF tones. A final amplification is used to compensate for conversion loss at the mixer to efficiently use the full scale deflection of the FFTS ADC, which digitizes the signal at 8 bit and 2 GSPS. The FFTS performs a continuous N = 8192 bin 共point兲 complex FFT outputting an N bin power spectrum for every block of N points of time domain data. The outputted
Amplitude (dBc/Hz)
PC
4 GHz LO upconverter
S21
1 GHz clock
KID band 4-4.3 GHz
S21
IF 0-300 MHz
50
100
time (a.u.)
-40
(b)
S21
042504-2
-60
f (GHz)
off resonance IQ FFTS probe frequency IQ FFTS
-80
-100 1
10
100
f (Hz)
1000
10000
100000
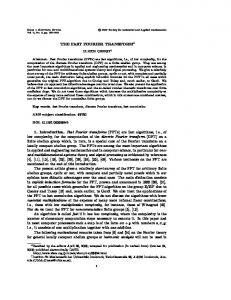
FIG. 2. 共Color online兲 共a兲 Measured response of eight MKIDs in time to a optical step ramp from a red LED. The initial probe frequency was on resonance, the LED was stepped linearly in current. Inset: 兩S21兩2 transmission curve vs measurement frequency measured by the FFTS technique of a MKID around the resonance frequency. The frequency was swept by changing the LO frequency of the mixers, keeping the DAC output constant. Indicated are the approximate probe point and the off resonance frequencies. 共b兲: Power spectral density of noise compared to carrier in the signal amplitude at off resonance 共lower兲 and the probe point which was 8 kHz from resonance 共upper兲, measured using the FFTS readout and compared to measurements using an IQ mixer.
8192 bin spectrum has a binwidth of 1 GHz/ 8192 = 122 kHz, where the value of each bin is the summed spectral power in the bin from that block. By comparing the spectrum from different blocks of time domain data we can follow the time evolution of the spectral power in each bin. By arranging that the probe frequencies occupy different bins, this one board will be equivalent of 8192 digital downconverters.18 A selection of the bins have a probe tone in them allowing them to be followed at the FFT rate of 122 kHz. Note that we measure now the modulation of the probe tone power which is a measure of the power transmission of the MKIDs, 兩S21兩2. The signal bandwidth is then reduced by averaging multiple spectra for 20 ms or more. This final integration bandwidth sets the noise bandwidth of the readout, not the bin bandwidth. The devices used in the experiment are coplanar waveguide quarter wavelength resonators6,13 capacitively coupled to the through line. The devices are made from a single 100nm thick Al film thermally evaporated on a high purity silicon substrate. The measured chip has 25 usable MKIDs at slightly different resonance frequencies. Eight MKIDs with Q ⬃ 150 000 were chosen for the experiment. First, we measure the response of eight probed MKIDs to a red light-emitting diode 共LED兲 illumination of the chip with optical photons, increasing the LED current in discrete steps. The insets of Fig. 2 show the measured frequency dependent transmission and probe frequencies for one MKID. Figure 2共a兲 shows the multiplexed 共i.e. FFTS readout兲 response of eight MKIDs with the probe tones set on resonance when there was no LED illumination. We clearly observe the expected step wise increase in 兩S21兩2. Nonuniform illumination of the chip is the reason of observed response difference.
Author complimentary copy. Redistribution subject to AIP license or copyright, see http://apl.aip.org/apl/copyright.jsp
042504-3
Appl. Phys. Lett. 95, 042504 共2009兲
Yates et al.
To fully demonstrate the readout we need to study not only the MKID response but also we need to study the noise properties. To do this, we sampled 兩S21兩2 for each probe signal using the FFTS at a rate of one measurement every 20 ms for 10 s. Here, we have used probe tone frequencies at ⬃0.6␦ f away from the resonance frequency. The measurement is repeated by tuning the probe signal 1 MHz off resonance, effectively measuring the system noise not influenced by the MKID. This data is used to calculate the power spectral density with respect to the carrier amplitude. The result is shown for one representative of the eight MKIDs by the bold lines in the figure, both for 8 kHz and 1 MHz off resonance. Subsequently, we repeated this using our conventional IQ setup. The result is shown by the thin lines in the Fig. 2. We observe several features. First, we observe that there is no measurable difference between the FFTS readout traces and the IQ readout traces. Since the latter is limited by the setup, we conclude that the FFTS readout system does not limit the system noise. Second, both setups show a large excess noise when probing the MKID 8 kHz off resonance, which is rolled-off at ⬃15 kHz. This is the magnitude representation of the MKIDs excess frequency noise,7 rolled-off at the ring response frequency of the resonator 共bandwidth ␦ f = f 0 / 共2Q兲 ⬃ 15 kHz for the MKIDs presented here兲. Above this roll-off the noise returns to the system noise floor. Third, we observe for both data sets a much lower, almost white noise spectrum when probing the MKIDs at 1 MHz off resonance. This noise level is consistent with the system noise temperature. The small difference at the highest frequencies between the 1 MHz and 8 kHz off resonance data is identical to the difference in S21 between the 8 kHz and 1 MHz off resonance transmission, a direct consequence off our normalization to the carrier amplitude. From the measured noise trace, the temperature dependent response of the MKID and in combination with a separate measurement of the quasiparticle lifetime 共⬃1 ms兲, we can estimate a dark NEP19 of ⬃1 ⫻ 10−17 W / Hz1/2 at 20 Hz. This 8 pixel readout can easily be expanded to much more pixels. With the existing boards the fundamental limit is given by the 8192 bins of the FFTS. However, for so many pixels careful control is required of the peak voltage at each stage in the readout chain20 to prevent clipping at the ADC and to control intermodulation products from the nonlinearity of the amplifiers when overdriven. For a signal consisting of n tones with identical rms power P, the peak power can be approximated by Ppeak ⬃ PnC, where n is the number of tones and C the Crest factor, where C = Ppeak / nP ⬃ 25 using random tone phase. The consequence is that the power gain available between the MKIDs and ADC⬀ n. Since the contribution of the ADC to the system noise 共referred to the input of the MKIDs兲 is dependent on the system gain, increasing the amount of probe signals requires a lower noise from the ADC,20 which can be expressed in terms of the bit noise, effective number of bits 共ENOB兲. For example, consider a 1000 MKID pixel array with a Q factor of 50 000 and probe signal power per MKID of ⫺85 dBm. This would require an ADC with ⬃9 ENOB to give the effective noise at the chip level identical to the low noise amplifier noise floor. In the case of phase or 兩S21兩2 readout, the system noise is higher due to the excess device noise, so relaxing the requirements for the ADC in the example given to ⬃7 ENOB.
The readout described in this letter gives out 兩S21兩2 response of a MKID. A readout in the complex plane is preferred,13 giving the phase and amplitude change in the probe signals, enabling either a more linear response 共phase readout兲 or a higher sensitivity for low background applications using high Q MKIDs from both the phase and amplitude of S21. The current FFTS does internally have the complex information from which the complex transmission can in the future be extracted. In conclusion, we present a MKID readout concept which will facilitate the application of MKIDs to a wide range of applications. The electronics, as presented here, can already handle ⲏ100 pixel readouts for ground-based millimeter/submillimeter astronomy, easily expandable with wider bandwidth tone generation schemes or closer readout packing of the MKIDs. This can then be expanded with a phase/amplitude readout to reach the more stringent requirements for very low NEP applications like space born submillimeter spectroscopy, for example, SPICA.1 The authors would like to thank Dennis van der Loon, Jan-Rutger Schrader, Rami Barends, Teun Klapwijk and Henk Hoevers for discussions and help. The SPICA Far Infrared Instrument 共SAFARI兲 for JAXA SPICA. See http:// sci.esa.int/science-e/www/object/index.cfm?fobjectid⫽42285 for details. 2 W. Wild et al., Exp. Astron. 23, 221 共2009兲. 3 Institut de RadioAstronomie Millimétrique 共IRAM兲, 300 Rue de la Piscine, Domaine Universitaire, 38406 Saint Martin d’Hères, France. 4 R. Güsten, L. Å. Nyman, P. Schilke, K. Menten, C. Cesarsky, and R. Booth, Astron. Astrophys. 454, L13 共2006兲. 5 T. A. Sebring, S. Radford, R. Giovanelli, J. Glenn, and D. Woody, Proc. SPIE 7012, 70121H 共2008兲. 6 P. K. Day, H. G. LeDuc, B. A. Mazin, A. Vayonakis, and J. Zmuidzinas, Nature 共London兲 425, 817 共2003兲. 7 B. A. Mazin, “Microwave Kinetic Inductance Detectors,” Thesis, California Institute of Technology, 2004. 8 J. Gao, J. Zmuidzinas, B. A. Mazin, H. G. LeDuc, and P. K. Day, Appl. Phys. Lett. 90, 102507 共2007兲. 9 R. Barends, J. J. A. Baselmans, S. J. C. Yates, J. R. Gao, J. N. Hovenier, and T. M. Klapwijk, Phys. Rev. Lett. 100, 257002 共2008兲. 10 R. Barends, S. van Vliet, J. J. A. Baselmans, S. J. C. Yates, J. R. Gao, and T. M. Klapwijk, Phys. Rev. B 79, 020509 共2009兲. 11 J. Schlaerth, A. Vayonakis, P. Day, J. Glenn, J. Gao, S. Golwala, S. Kumar, H. LeDuc, B. Mazin, J. Vaillancourt, and J. Zmuidzinas, J. Low Temp. Phys. 151, 684 共2008兲. 12 B. A. Mazin, B. Brumble, P. K. Day, M. E. Eckart, S. Golwala, J. Zmuidzinas, and F. A. Harrison, Appl. Phys. Lett. 89, 222507 共2006兲. 13 J. Baselmans, S. J. C. Yates, R. Barends, Y. K. Y. Lankwarden, J. R. Gao, and H. Hoevers, J. Low Temp. Phys. 151, 524 共2008兲. 14 B. A. Mazin, P. K. Day, K. D. Irwin, C. D. Reintsema, and J. Zmuidzinas, Nucl. Instrum. Methods Phys. Res. A 559, 799 共2006兲. 15 B. Klein, S. D. Philipp, I. Krämer, C. Kasemann, R. Güsten, and K. M. Menton, Astron. Astrophys. 454, L29 共2006兲. 16 B. Klein, I. Krämer, S. Hochgürtel, R. Güsten, A. Bell, K. Meyer, and V. Chetik, Proceedings of the 19th International Symposium on Space Tetrahertz Technology, Groningen, The Netherlands, 28–30 April 2008 共unpublished兲 Vol. 19, p. 192. 17 S. Doyle, P. Mauskopf, J. Naylon, A. Porch, and C. Duncombe, J. Low Temp. Phys. 151, 530 共2008兲. 18 The effective noise bandwidth is 1.16⫻ the binbandwidth of Ref. 15, so spectral leakage is minimized but adjacent bins will have some cross talk particularly if the probe tone falls on the edge of the bin. 19 The 兩S21兩2 is a mix of phase and radius response 共Ref. 12兲, so responsivity is a complicated function, but can be solved exactly from Ref. 20. For an 共under兲estimate, use that 兩S21兩2 / nq p ⬃ 兩S21兩2 / f ⫻ f / Nqp, so a dark NEP can be calculated in a similar fashion to Ref. 12. 20 P. Malony, J. Sayers, J. Zmuidinas, and B. Mazin, MKIDCam Readout Electronics Specifications 共University of Colorado, Boulder, 2008兲. 1
Author complimentary copy. Redistribution subject to AIP license or copyright, see http://apl.aip.org/apl/copyright.jsp