FeS: Structure and Composition Relations to Superconductivity and Magnetism Steven J. Kuhn,1,2 Michelle K. Kidder,3 W. Michael Chance,1 Clarina dela Cruz,4 Michael A. McGuire,1 David S. Parker,1 Li Li,1 Lisa Debeer-Schmitt,4 Jordy Ermentrout,1 Ken Littrell,4 Morten R. Eskildsen,2 Athena S. Sefat1,* 1
*
Materials Science & Technology Division, Oak Ridge National Laboratory, Oak Ridge, TN 37831 2 Department of Physics, University of Notre Dame, Notre Dame, IN 46556 3 Chemical Sciences Division, Oak Ridge National Laboratory, Oak Ridge, TN 37831 4 Quantum Condensed Matter Division, Oak Ridge National Laboratory, Oak Ridge, TN 37831
Corresponding author:
[email protected]
Abstract Structure and composition of iron chalcogenides have a delicate relationship with magnetism and superconductivity. In this report we investigate the iron sulfide layered tetragonal phase (t-FeS), and compare with three-dimensional hexagonal phase (h-FeS). X-ray diffraction reveals the absence of structural transitions for both t- and h-FeS below room temperature, and gives phase compositions of Fe0.93(1)S and Fe0.84(1)S, respectively, for the samples studied here. The a lattice parameter of 3.68 Å is significant for causing bulk superconductivity in iron sulfide, which is controlled by composition and structural details such as iron stoichiometry and concentration of vacancy. While h-FeS with a = 3.4436(1) Å has magnetic ordering well above room temperature, our t-FeS with a =3.6779(8) Å shows filamentary superconductivity below Tc = 4 K with less than 15% superconducting volume fraction. Also for t-FeS, the magnetic susceptibility shows an anomaly at ~ 15 K, and neutron diffraction reveals a commensurate antiferromagnetic ordering below TN = 116 K, with wave vector km= (0.25,0.25,0) and 0.46(2) B/Fe. Although two synthesis routes are used here to stabilize t vs h crystal structures (hydrothermal vs solid-state methods), both FeS compounds order on two length-scales of ~1000 nm sheets or blocks and ~ 20 nm smaller particles, shown by neutron scattering. First principles calculations reveal a high sensitivity to the structure for the electronic and magnetic properties in t-FeS, predicting marginal antiferromagnetic instability for our compound (sulfur height of zS 0.252) with an ordering energy of ~11 meV/Fe, while h-FeS is magnetically stable.
1
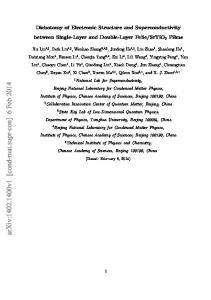
Introduction The equiatomic iron chalcogenides of FeCh, with Ch = S, Se, and Te, are difficult to synthesize stoichiometrically due to the existence of a wide solid-solution of phases close to this ratio [1,2,3]. These tetragonal PbO-type structures (space group P4/nmm) are made of square-planar sheets of Fe, which are in a tetrahedral environment with the chalcogens (Fig. 1a), similar coordination to superconducting iron arsenides. It is shown that variations in Fe composition can generate great and wide ranging changes in the physical properties of FeCh. For the selenide, a major conundrum is the relationship between structure, magnetism, and superconductivity, and their close connection to the chemical Fe:Se ratio. Shortly after the discovery of superconductivity in tetragonal ‘FeSe’ [4], studies documented superconductivity in the true composition ranges of Fe1.01Se to Fe1.025Se that are stabilized by reactions within 300 to 440 C [5,6]. It is found that although Fe1.01Se is the optimal composition for superconductivity with Tc= 8 K that also gives rise to a structural transition (without magnetic order) at Ts = 90 K [7], Fe1.03Se is not a superconductor and does not undergo a structural transition [6]. The tetragonal phase for the tellurides exist in Fe1.06Te to Fe1.17Te composition region, with no superconductivity [8] and an ordered moment of roughly 2 B [9]. Fe1.141Te structurally changes from the tetragonal to a mixed tetragonal/orthorhombic (Pmmn) phase below 76 K, and is completely orthorhombic below Ts = 56 K [8]; there is also incommensurate antiferromagnetic ordering below TN = 63 K with a magnetic ordering wave-vector of km=(0.38,0,0.25) [8]. However, Fe1.076Te is found to transform from tetragonal to monoclinic (P21/m) and antiferromagnetic phase below Ts = TN =75 K [8] with km=(0.25,0,0.25) [8]. A slightly less Fe rich sample with Fe1.068Te gives Ts =TN = 67 K [10]. The tetragonal iron-sulfide phase (‘mackinawite’, P4/nmm) that we denote as ‘t-FeS’ (Fig. 1a) is metastable, but can be formed in reactions below 200 °C [11]; the recent finding of superconductivity (Tc= 4.5 K) in this phase with Fe1.03(2)S [12] has created much excitement [13-17]. However, many earlier studies of this tetragonal phase did not observe superconductivity [18-20], at the composition of Fe1.27(1)S [19]. There have been several ways to produce t-FeS reported in the literature. The hydrothermal method was used in the first report of superconductivity, by mixing Fe powder with Na2S in an autoclave at ~100 °C [12]. This method was further modified to yield Tc = 4.5 K single-crystals by leaching potassium from K0.8Fe1.6S2 after heating in an autoclave with hexagonal binary powder [14,16]. The superconducting samples were found to be metallic (ρ300K = 5 mΩ cm). The heat capacity results have shown Sommerfeld coefficient of γ 4 to 5 mJ/(mol K2) [16,21], with suggestions of nodes in the superconducting gap and 2 d-wave gaps [21]. Other methods of producing non-superconducting t-FeS included mixing powders of FeCl2 with Na2S in basic solution and heating in an autoclave at 200 °C [18]; the resulting samples were ferromagnetic. Also, iron wire was mixed with Na2S in an acidic solution and dried in an oxygen free environment or dropcast onto a gold plate [1,19,22], giving semiconducting behavior (ρ300K = 70 mΩ cm) [19] and strong itinerant spin fluctuations [22]. Because of such a variety of synthesis routes and physical properties, the question of stoichiometry and structural details becomes important. In fact, muon spin rotation and relaxation (μSR) measurements found disordered magnetism below Néel ordering temperature of TN = 20 K co-existing with Tc = 4.5 K [13]. In this manuscript, we unravel such discrepancies for t-FeS and compare with the hexagonal iron-sulfide phase (‘pyrrhotite’, P63/mmc) that we denote as ‘h-FeS’ (Fig. 1b) [16,20]. The crystal structures of the tetragonal and hexagonal phases are displayed in Fig. 1: t-FeS is layered, and there are square nets of Fe that are tetrahedrally coordinated similar to other superconducting iron chalcogenides and pnictides. In comparison, h-FeS contains triangular nets of Fe, which are octahedrally coordinated with S, with three-dimensional (3D) structure. We report on t-FeS phase, and compare its crystal structure, composition, and properties to those in the literature, and also to the h-FeS phase. The notion of structure-property relations in iron selenide and the sensitivity to composition are investigated in this study. This manuscript investigates materials using temperature-dependent X-ray and neutron diffraction, and magnetization measurements, along with 2
particle size and composition analyses. We draw conclusions from first principles calculations for t- and h-FeS properties.
Fig 1. (Color online) Comparison of two crystal structures of FeS; unit cells are shown in red. (a) t-FeS has a layered crystal structure. (b) h-FeS is a 3D structure.
Results and discussions i.
Structure and composition
The powder X-ray diffraction (XRD) data for t-FeS (Fig. 2a) is modeled using the PbO structure type (P4/nmm) by Rietveld. The present sample contains a small Fe impurity of about 2 weight percent. In the t-FeS phase, the variation in width of the reflections of different indices is notable. Reflections with no caxis component, including (110), (200), and (220), are relatively sharp, with full width at half maximum of 0.17, 0.25, and 0.31, respectively. Reflections with both ab-plane and c-axis components are significantly broader. For example, the widths of the (101), (112), and (312) peaks are 0.36, 0.53, and 0.71, respectively. This is indicative of better crystallinity in FeS layers than between them, which may be a consequence of the low temperature synthesis requirements. XRD refinement gives Fe atomic site of 0.93(1) while S is fully occupied, giving Fe0.93(1)S phase composition for t-FeS (Table 1). We also checked the average composition of the entire sample using inductively coupled plasma (ICP) and combustion; the sample composition is (1.02)Fe:S:(0.32)Na. The most likely cause of the high value of sodium in the products is sodium hydroxide impurity on the surface of the powder due to imperfect washing of products, but it may also be sodium sulfide, sulfate, or carbonate. For a superconducting sample, (1.03)Fe:S was found using ICP atomic emission spectroscopy (ICP-AES) [12], while a nonsuperconducting sample gave (1.27)Fe:S in energy-dispersive X-ray spectroscopy (EDS) [19]. Independent of iron deficient t-FeS structural phase, it seems that it may be crucial to keep the whole sample composition close to ~1Fe:1S as to avoid impurity magnetic signals and transport grain boundaries that hinder superconductivity signals. The room temperature lattice parameters of t-FeS are a =3.6779(8) Å and c =5.0331(2) Å. Literature values on powders of superconducting t-FeS have longer a lattice parameter compared to our data here, while c is comparable (Table 1). These superconducting a values are reported as 3.6841 Å [16], 3.6818 Å [17], and 3.6802 Å [12]. Literature values of nonsuperconducting t-FeS have shorter a lattice parameters; they are 3.674 Å [18], 3.675 Å [19], and 3.6735 Å [1]. Our a = 3.6779 Å is in between these two sets of reported values and shows what appears to be filamentary superconductivity (see below). The value of a 3.68 Å may be crucial for bulk 3
superconductivity, which is controlled by structural features such as iron stoichiometry and concentration of vacancies. As noted above, our t-FeS phase composition is Fe0.93(1)S. The XRD data for h-FeS is shown in Fig. 2b and is modeled using the NiAs structure type (P63/mmc) by Rietveld. Small unindexed reflections are attributed to vacancy order, as is common for the hexagonal phase [16, 20, 23]. The vacancy ordering can be complicated, and is described in the literature by many hexagonal, monoclinic, and orthorhombic structures that vary depending on the iron stoichiometry. Collectively the phase is referred to as pyrrhotite and it includes Fe7S8 stoichiometry. The structures can all be described by a 3+1 superspace group where the modulation models Fe vacancy ordering; it is commensurate for certain vacancy concentrations [23, 24, 25]. An appropriate vacancy order model could not be identified for the present sample. The atomic site refinement of Fe gives a value of 0.838(6) with S fully occupied, giving Fe0.84(1)S phase composition for h-FeS (Table 1). The ICP-combustion result on the entire sample is certainly evident of extra Fe-containing phases with (1.25)Fe:S. The lattice parameters at 300 K are a = 3.4436(1) Å and c = 5.7262(2) Å.
Fig. 2. (Color online) Rietveld refinement results of room temperature powder X-ray diffraction patterns for (a) t-FeS and (b) h-FeS. In (a) the lower set of tics locate reflections from an Fe impurity; the reflection originating from the sample holder near 82 is excluded. In (b) superlattice reflections arising from vacancy order are indicated; fits were performed only using the average structure (NiAs type) with vacancies randomly distributed.
The temperature dependence of the lattice parameters for both t-FeS and h-FeS phases are shown in Fig. 3. No indication of a structural phase transition is seen down to 20 K for either sample. To illustrate this for the t-FeS sample, three reflections are compared at 20 and 300 K (Fig. 3a inset); no splitting or broadening is observed to occur between these two temperatures. The a and c lattice parameters for t-FeS decrease by 0.33 and 0.37%, respectively, on cooling from 300 to 20 K. For the h-FeS sample, the a and c lattice parameters (of the average structure) decrease by 0.5% and 0.15%, respectively, over the same temperature range. In this material, there is an anomaly in the temperature dependence of c near 75 K, and 4
we suspect that this may be related to an electronic/magnetic feature [26] rather than any change in vacancy order as there should be little atomic diffusion at that temperature. Indications of small negative thermal expansion is seen in t-FeS and the c parameter of h-FeS at low temperatures, but the resolution of the current measurements is insufficient to claim this with confidence.
Fig. 3. (Color online) Temperature-dependent lattice parameters for t-FeS (a) and h-FeS (b). Symbols are measurements on different runs.
Table 1. FeS powder phases, the lattice parameters, along with composition analyses, impurity phases, and possible superconducting transition temperature. The shaded rows are h-FeS. a (Å)
c (Å)
Fe:S, technique
Impurity
3.6841(4) 3.6818(1) 3.6802(5) 3.674(3) 3.675(2) 3.6735(4) 3.6772(7)
5.03440(9) 5.0297(2) 5.0307(7) 5.0354(3) 5.035(6) 5.033(7) 5.032(1)
1:1, ICP-AES 1.03(2):1, ICP-AES 1.27(1):1, EDX 0.99(1):1, ICP-AES 0.93(1):1, XRD Fe:S:Na=1.02:1:0.32, ICP
Fe, FeS2 Ti, Mn Fe ~ 2% Na
3.447(2) 3.4437(2)
5.747(2) 5.7268(4)
0.84(1):1, XRD Fe:S=1.25:1, ICP
FexSy ~ 2.6% ^ -
*
arXiv reports;
^
Tc onset, zero (K) 4.5 4, 2.4 4.8 5, 4 4 -
Ref. 14 * 15 * 16 * 11 17 18 1 this study t-FeS 25 this study h-FeS
may be from superlattice reflections from vacancy order in the main phase; source of hydroxide, etc.
5
ii.
Particle size and thermal phase stability
The particle size of t-FeS and h-FeS were determined by measuring neutron scattering of powdered samples (Fig 4a-c). Using the combined techniques of small and ultra-small angle neutron scattering (U/SANS), gives one the unique capability to investigate particle information across a wide range of length scales of 0.1-1000 nm; the combined data are plotted on a log-log scale (Fig. 4a). The slope of the data and the positions of transition points between regions of different slopes describe the size and shape of the particles at multiple lengthscales. For t-FeS, there is a uniform particle size and shape described by low-q slope of -1.1(6), consistent with extended FeS sheets with thickness of ~1400 nm; the lateral extent of these sheets was too large to measure. At higher q, the slope of -2.3 corresponds to a fractal roughness on the surface of the particle. There is another transition point where the data goes from -2.3 to -4.5 in slope, which could be due to diffuse interfaces but intepretations of power-laws steeper than -4 is not clearly understood [27]. Fig. 4b highlights an excess scattering over a power law of -4 on a linear scale. The data in the intermediate region is modeled as a distinct particle from which a particle size of 19 nm can be estimated by the radius of gyration (rg) [28]. Fig. 4c shows the high-q region, and for t-FeS, it is characteristic of thin line dislocations. For h-FeS, SANS reveals a superstructure that is too large to be measured, but the fits are consistent with rounder surfaces. The excess scattering above a nominal powerlaw of 4, (Fig. 4b) gives a particle size of 16 nm. At extreme high-q, only compact point like inhomgeneities are observed which could be interpreted as voids or nanocluster vacancies in the structure. In scaning electron microscopy (SEM) image, roughly flat, plate-like particles with sides between 1000 and 5000 nm is supported for t-FeS (Fig. 4d), while for h-FeS, it is larger and more rounder, with largest particle being of approximately 10,000 nm in size. For both t-FeS and h-FeS phase, there are variations in particle size and two general length scales that are captured. Smaller sizes in particle sizes were found through a number of techniques in literature. For example, for t-FeS SEM and transmission electron microscopy (TEM) data show particle sizes between 250 and 100 nm for non-superconducting t-FeS [18,19,29], while XRD refinements and atomic force microscopy of the same samples reveal particle sizes between 42 and 4 nm [18,19,29]; TEM plot of particles of superconducting t-FeS gives 50 nm [12]. (a)
(b)
(d)
30 µm
(c)
(e)
30 µm
Fig. 4. (Color online) Particle sizes of h-FeS and t-FeS are measured using USANS (filled symbols) and SANS (open symbols). Slopes displayed for the low-q fits describe the large-scale particle shapes (a). The mid-q range (b), the radius of gyration calculations reveals the particle sizes. The high-q data (c) reveals the types of dislocations. SEM images of the powders are displayed for (d) t-FeS and (e) h-FeS.
6
Because the two tetragonal and hexagonal structures are stabilized with different synthesis routes of hydrothermal vs. solid state reactions, and at such different temperatures of 100 C versus 700 C (see Methods), we utilize the technique of thermogravimetric analysis-mass spectrometer (TGA-MS) to monitor the mass loss of these materials upon heating and characterize the thermal decomposition products. A TGA report for non-superconducting sample, synthesized in a solution similar to ref. [18] gave SO and SO2 species with a small (