Coastal Sediments '07
© 2007 ASCE
FIELD MEASUREMENT AND MODELLING OF SCOUR PIT DYNAMICS IN A SANDY ESTUARY A.G. Davies1, J.M. Brown2 1. School of Ocean Sciences, University of Wales (Bangor), Menai Bridge, Anglesey, LL59 5AB, U.K.
[email protected]. 2. School of Ocean Sciences, University of Wales (Bangor), Menai Bridge, Anglesey, LL59 5AB, U.K.
[email protected]. Abstract: Field observations and model simulations are presented of the tidal flow over a scour hole at the mouth of the Dyfi Estuary, mid-Wales, U.K. This scour hole is maintained by locally high flow speeds resulting from convergence, and then divergence, of the flow over the hole. Fixed features of the local bathymetry may also have served to stabilise its location (over decades). Model simulations of steady flow over a variety of schematised pits of different elliptical shape on an otherwise flat bed are presented to show that shallow elongated pits can (almost) preserve the upstream flow speed at their centre point, making them potentially selfmaintaining. Deeper pits reduce the flow speed and so will infill. INTRODUCTION
A feature of many estuaries and channels is the occurrence of natural pits and scour holes. These fixed features often persist for decades in the erodible seabed sediment. The present paper highlights the dynamics one such scour hole in the mouth of the Dyfi Estuary in the middle of Cardigan Bay, mid-Wales, U.K. Here field observations were made as part of a model validation exercise aimed at demonstrating the ebb-dominant nature of the tidal flow in the Dyfi Estuary. This ebb dominance arises from the extensive areas of drying banks at low tide, together with the discrete channels, that characterise the interior of this predominantly sandy Estuary. The field observations are complemented by modelling work both of the tidal flow in the estuary, here with main emphasis on the area of the scour hole, and also of the flow above an idealized pit that is used to highlight the processes affecting scour-hole dynamics.
Coastal Sediments '07
© 2007 ASCE
The behaviour of offshore sand pits was studied during the EU SandPit Project (2002-5) (Van Rijn et al., 2005). Here numerical models were intercompared in order to simulate both the infill rate and also the migration rate of pits and trenches, and comparisons were made with data from a variety of field and laboratory experiments involving combined waves and currents. Based on scenario model tests for a variety of offshore sand pits, coastal zone management issues were addressed relating to both the near- and far-field effects of these pits. For example, at the centre of the pits investigated it was found that both current velocities and sediment transport rates decreased quite markedly (by up to about 25% and 80%, respectively) compared with the situation without a pit. Work in SandPit was carried out at the University of Wales (Bangor) (UWB) using the Telemac Modelling System in which refinements were implemented relating to the bed roughness, the advection-diffusion scheme for suspended sediment and also the sand transport formulation (Davies and Villaret, 2003; Davies et al., 2005). In the present study of the Dyfi Estuary the spring-neap tidal cycle has been modelled, and then combined with a schematized representation of the observed offshore annual wave climate. Even at high tide, waves are predicted, and also observed, to penetrate the estuary from offshore only to a limited extent; thus we focus here on the tidal flow over the scour hole at the estuary mouth without regard to waves. The main sections of the paper highlight the field observations made above the scour hole, the modelling of these flows using the Telemac System (Hervouet and Bates, 2000), and some consideration of the dynamics of pits aimed at addressing the question of whether natural scour holes can be self-maintaining and, if so, what shape of hole best serves this purpose. FIELD STUDY IN THE DYFI ESTUARY
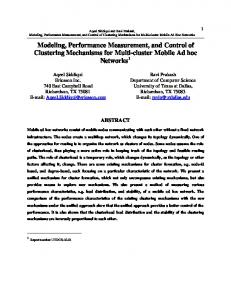
Validation data was obtained in a field campaign carried out in the Dyfi Estuary in January-February 2006 in order to confirm the model’s hydrodynamic predictions at the estuary mouth, including the ebb dominance of the system. Figure 1 highlights the scour hole in the estuary mouth; the entire model domain is shown later in Figure 11.
2
Coastal Sediments '07
© 2007 ASCE
Fig. 1. The boat track over the scour hole in the mouth of the Dyfi Estuary.
The scour hole, which has been present as a fixed feature for decades, is approximately 800 m long, 150 m wide and 12 m deep, forming an asymmetrical elliptic shape. Data were obtained for both neap (24-25/01/06) and spring tides (31/01/01- 01/02/06), though here we highlight only the spring tide. Current data was obtained using a boat-mounted ADCP (the ADCP bin height was 0.25 m with a contaminated near-bed layer as shown). The boat tracked over the hole, following the double-cross shown in Figure 1, every 40 minutes during the tidal cycle. The flow was unstratified for the full spring tidal cycle and there was negligible wind and wave activity. The data presented here was collected along the major axis of the scour hole between the orange circles (Figure 3 and 7) and over the eastern minor axis between the yellow circles (Figures 4, 5, 8 and 9). The state of the tide corresponding to the data presented is indicated in Figure 2 by a red cross for peak flow on the flood tide and a blue cross for peak on the ebb. The water depth in Figure 2 was obtained by a bottom mounted ADCP moored in the main northern channel offshore from Aberdyfi jetty at the position indicated by the red cross in Figure 1.
X X
X -31.3 days (Figure 3, 4, and 5) X -31.5 days (Figure 7, 8, and 9)
Fig. 2. The tidal curve off Aberdyfi jetty 31/01/06 -1/02/06 (spring tide).
east
west
Fig. 3. The eastward flood velocity component over the major scour hole axis (m/s).
During peak flood flow the eastward (positive) velocity component over the hole was 2.4 m/s with maximum flow speeds occurring over the deepest parts of the hole. Figure 3 shows the flow along the main axis of the hole, while Figure 4 shows the flow through
3
Coastal Sediments '07
© 2007 ASCE
the eastern minor axis of the hole. The peak velocity occurred in a surface layer, just off centre to the southern side of the hole. The change of sign of the northward velocity component (Figure 5) illustrates that the flow diverged as it left the hole on both sides of the eastern minor axis. The north-velocity component was weaker than the east-velocity component only reaching peak values of 0.5 m/s.
north
south
Fig. 4. The eastward flood velocity component over the eastern minor scour hole axis (m/s).
north
south
Fig. 5. The northward flood velocity component over the eastern minor scour hole axis (m/s).
It was found also that the flood tide along the north of the channel was deflected off the northern bank before entering the hole, directing the current in a more easterly direction (Figure 6). This also led to convergence over the deepest point of the hole, resulting in the large velocities seen in Figures 3 and 4. Deflection by northern bank of the flood tide.
Current convergence over the hole, resulting in high velocities. Fig. 6. Schematic of the flood flow pattern over the scour hole.
During peak ebb flow the eastward velocity component achieves maximum (negative) velocity of 2 m/s down stream of the hole (Figure 7). The flow was most pronounced
4
Coastal Sediments '07
© 2007 ASCE
along the northern side of the hole (Figure 8) due to the main current stream entering the hole from the northern channel, which is ebb tide dominated. The northern channel passes Aberdyfi jetty (Figure 1) and is the main tidal channel in the estuary system. The change of sign of the northward velocity component (Figure 9) demonstrates that flow convergence occurred at the upstream end of the hole, the flow entering the hole over both sides of the eastern minor axis. This convergence may also be due to the northern and southern channels feeding the flow, a consequence of the falling water levels (Figure 2) restricting the flow to the estuary channels. Again the north-velocity component was weaker than the east-velocity component, achieving a peak magnitude of 0.7 m/s.
west
east
Fig. 7. The eastward ebb velocity component over the major scour hole axis (m/s).
north
south
Fig. 8. The eastward ebb velocity component over the eastern minor scour hole axis (m/s).
north
south
Fig. 9. The northward ebb velocity component over the eastern minor scour hole axis (m/s).
5
Coastal Sediments '07
© 2007 ASCE
As the flow from the estuary channels met over the deep part of the hole (Figure 10) the flow increased and this process continued offshore giving rise to the peak velocity magnitude, seen to the west of the deepest point of the hole in Figure 7.
Fig. 10. Schematic of the ebb flow pattern over the scour hole.
In summary, the field data illustrate that over an elliptic hole, with the flow parallel to the major axis, converge/divergence occurs as the flow enters/leaves the pit. The question that then arises is whether this behaviour can cause an increase in velocity that is sufficient for the pit to be self-scouring. Van Rijn et al. (2005) noted the paucity of data of the kind presented here. MODEL OF THE TIDAL FLOW IN THE DYFI ESTUARY
A complete description of the model of the Dyfi Estuary developed at UWB using the Telemac System is beyond the scope of this paper. Here we present only the details relevant to the present application. The model domain and bathymetry are shown in Figure 11. The offshore north-south boundary, where the water depth is typically 15 m, is 14 km long. The scour hole (marked with a blue cross) is located in the main channel seen entering the estuary. Within the sandy estuary itself large areas of drying banks dominate the bathymetry.
×
6
Coastal Sediments '07
© 2007 ASCE
Fig. 11. Telemac model domain and bathymetry of the Dyfi Estuary
Telemac2D has been utilized with a mesh size of 500 m offshore reducing successively to 10 m over the area of the scour hole, thus allowing high resolution of the flow here. The tidal boundary conditions have been have been obtained from the operational POLCOMS model of the Irish Sea, but have here been simplified here by the retention of only the M2 and S2 constituents. A full spring-neap tidal cycle has been simulated with a model time step of 10 s. The field data have been used to undertake a limited amount of model tuning and the description of bottom friction has been matched with the known seabed type (sand with D50= 0.24 mm). Following a spin-up period, the model cycle starts with the spring tide. In the offshore domain both the elevation and velocity fields are essentially symmetrical. This is not the case however in the estuary mouth, near to the region of the scour hole. Here Figure 12 shows that, while the tidal elevation is symmetrical, the velocity field is highly asymmetrical with a short (positive) flood flow into the estuary being followed by a much longer (negative) ebb flow out of the estuary. The reason for this ebb dominance, which has been confirmed by the field measurements, is attributable to the large areas of drying banks within the estuary. 2
VELOCITY_U (M/S)
1 0 -1
-2
0
10000
20000
30000
40000
50000
5 4 3 2 1 0
60000
70000
80000
90000
100000
90000
100000
FREE_SURFACE (M)
-1 -2 -3 -4 -5
0
10000
20000
30000
40000
50000
60000
70000
80000
Fig. 12. East-west component of velocity (top), and free-surface elevation (bottom) in the mouth of the estuary.
Fig. 13. Velocity magnitude at the time of peak flood flow on the spring tide. Peak flow speeds in the entire domain (left) occur over the scour hole (right, with bathymetry shown).
7
Coastal Sediments '07
© 2007 ASCE
Figure 13 shows the velocity magnitude at about the time of peak flood flow into the estuary on the spring tide. Offshore the velocities are weak, but in the estuary mouth they are strong, attaining their largest values directly over the scour hole. On the ebb tide (Figure 14) the situation is analogous, though here the offshore directed velocities are maximum somewhat downstream of the point of maximum depth within the scour hole, consistent with the field results shown earlier in Figure 7.
×
Fig. 14. Velocity magnitude at the time of peak ebb flow on the spring tide. Peak flow speeds again occur near the scour hole (bottom). The bathymetry of the pit is as shown (top).
Evidently both model and experiment show peak flows occurring in the vicinity of the scour hole. In the natural setting of the Dyfi Estuary, this velocity enhancement is caused partly by the funnelling effect of the sides of the estuary at its mouth and, possibly also, by topographic ‘anchor points’. The area marked by the blue cross in Figure 14 is actually the site of ballast (rocky material) dumped by cargo vessels during the late 19th century. Although the underlying sediment is erodible, this ballast may have helped to stabilize the scour hole in its location nearby. What is clear is that the scour hole is a stable, persistent feature in the mouth of the Dyfi Estuary. What is less clear is whether its location and elongated geometry is simply forced by the nearby
8
Coastal Sediments '07
© 2007 ASCE
(fixed) topographic features, or whether its elongated shape results from a more fundamental interaction between the flow and the seabed topography. A MODEL OF CHANNEL FLOW OVER A SCHEMATISED PIT
In order to address the question posed above, we consider next the results of Telemac2D simulations carried out for simple, steady, channel flows above idealized pits of elliptical plan area. The channel is 2000 m long and 1000 m wide, with an undisturbed depth h of 10 m. The nominal grid size is 50 m which reduces to 10 m in the region around the centre point of the channel where the pits are located. An upstream volume flux of 104m3/s imposed in all runs, and ‘sliding’ boundary conditions are imposed at the sides of the channel. At the downstream end the nominal depth of 10 m is imposed, and so here the (mean) velocity is 1 m/s exactly. To ensure convergence the duration of each run has been taken as 104 s with a model time step of 10 s (run time 12 min). As the model spins up to convergence the surface elevation, which is ‘free’ at the upstream end of the channel, adjusts to its final value. For example, with a bed roughness of ks = 0.05 m the perturbation (ζ) to the undisturbed depth h is ζupstream= 0.058 m. It turns out that the surface slope along the channel is almost exactly uniform, corresponding in this case to −2.9×10⁻⁵. Since the converged flow is horizontally nonuniform it is necessary to correct for this in obtaining the local bed shear stress τ0, which may be obtained quite simply from the equation of motion as:
(
)
τ 0 = ρ g (h + ζ ) − U 2 × {− surface slope}
where U is the local depth-averaged velocity along the channel, ρ is the water density, and g is the acceleration due to gravity. In the simple case of a flat bed the flow properties depend only upon one non-dimensional parameter, namely ks/h. The behavior of the drag coefficient CD defined in the usual way by τ 0 = ρC DU 2 (and obtained in Telemac2D via the Chezy coefficient) is illustrated in Figure 15. This graph shows, for example, that doubling the depth decreases CD by about 20%.
CD
0.010
CD
0.001 0.00001
0.00010
0.00100
0.01000
z0/h
Fig. 15. Drag coefficient for steady flow in a channel (roughness length z0=ks/30)
Suppose next that we add a circular pit at the centre point of the domain, the pit being taken as an inverted cosine bell. If the depth of the pit below the undisturbed bed level
9
Coastal Sediments '07
© 2007 ASCE
is H and the radius of the pit (to the edge of the bell) is R, the properties of the flow now k H R depend upon the three non-dimensional parameters: s , and . h h h The effect of varying the two new parameters, while keeping ks (and hence ks/h) fixed (with ks= 0.05 m) is shown in Figure 16. At the centre of the pit, the flux U(h+H) increases significantly as H/h departs from its undisturbed value H/h= 0 indicating that fluid is being entrained into the pit from the surrounding area. However, the depthaveraged velocity U decreases as H/h increases, suggesting that such a pit shape is likely to promote infill. The results shown in Figure 16 for both the velocity and also the flux are strongly dependent upon H/h, but only very weakly dependent on R/h. 1.2 1
U*(h+H)
U
0.8 0.6 0.4 0.2 0 0
0.5
1
1.5
2
2.5
18 16 14 12 10 8 6 4 2 0
R/h=10 R/h=20
0
H/h
0.5
1
1.5
2
2.5
H/h
Fig. 16. Velocity (U m/s) (left) and flux (U(h+H) m3/s/m) (right) at the centre of the circular pit as H/h and R/h are varied with ks/h fixed.
Fig. 17. Perturbation to the flow caused by a circular pit (H/h= 1, R/h= 10 with ks = 0.05 m).
Some key results in a specific case are shown in Figure 17 in which the location of the pit is shown by the black contour lines. The colour map shows that the converged flow
10
Coastal Sediments '07
© 2007 ASCE
is down-slope from the left to the right of the domain, the surface slope being −2.9×10⁻⁵ as stated earlier. The pit perturbs the flow to a distance around it that scales on its radius R. The remaining graphs in Figure 17 show the free-surface and the streamwise component of the depth-mean velocity, along the centre-line of the domain. On approaching the pit the flow accelerates causing the surface elevation to drop while, on entering the pit, the flow decelerates causing the surface elevation to rise. After passing the deepest point at the centre of the pit this pattern is reversed. Evidently the flow is sucked into the pit by the pressure field that is induced in the area surrounding it and Figure 16 shows that, as expected, increasing the depth of the pit reinforces this effect. It may be inferred from the results above that a circular pit is likely to infill since U decreases as H/h increases. For a self-scouring pit we require the velocity to remain roughly constant (or ideally to increase) as H/h increases. The question that then arises is whether by changing the shape of the pit such an effect can be produced. In order to increase the domain of influence of the pit laterally (i.e. across the flow), it is necessary to increase the streamwise dimension of the pit. Next therefore we replace the circular pit (radius R) by an elliptical one (with streamwise semi-axis a, and transverse semi-axis b), doing this in such a way that the plan area of the pit remains unchanged (i.e. πR2= πab such that R is the ‘effective’ pit radius). The flow properties now depend upon four k H R a . parameters: s , , and h h h R
Fig. 18. Bathymetry of an elliptical pit with a/R=2, H/h=1 and R/h=10. Only the central area of the domain (500 × 250 m) is shown.
A typical elliptical pit, corresponding to a stretched cosine bell, is shown in Figure 18. The perturbation to the surface elevation caused by this pit can be seen in Figure 19 and the associated streamwise and transverse velocity components are shown in Figure 20. The effect of stretching the pit from a circle to an ellipse with its major axis in the streamwise direction is to suck more fluid into the pit from both of its now-longer sides. The results in Figure 20 show that the flow converges as it enters the pit and diverges as it leaves it, but the streamwise flow within the pit is now more intense than in the case of the equivalent circular pit. The depth mean velocity at the centre of the pit is 0.852 m/s, while at the upstream and downstream edges of the pit the velocity attains values of 1.068 and 1.083 m/s, respectively. The centre-point value may be compared with the
11
Coastal Sediments '07
© 2007 ASCE
much lower value for an equivalent circular pit of 0.676 m/s, and also with the undisturbed flat-bed value of 0.997 m/s, i.e. in the absence of a pit.
Fig. 19. Effect on the free-surface elevation of an elliptical pit (a/R=2, H/h=1, R/h=10). The perimeter of the pit is shown by the black line.
Fig. 20. The perturbation to the velocity field in the streamwise (top) and transverse (bottom) directions as a result of the pit shown in Figure 19 (a/R = 2, H/h = 1, R/h = 10).
The depth-mean velocity at the centre of a variety of elliptical pits is shown in Figure 21. With regard to the shape of the pit, the value a/R = 1 indicates a circular pit. In the limits a/R→0 and a/R→∞, the pit becomes, respectively, a trench and a longitudinal furrow. Shallow pits correspond to small values of H/h, while deep pits correspond to large values of H/h. Maximum longitudinal bed slopes only exceeded 10º in two of the cases considered, and were generally much smaller than this (< 5º). Thus flow
12
Coastal Sediments '07
© 2007 ASCE
separation within the pit would not be expected, and the use of a 2DH model is not unreasonable for an assessment of the dynamics. 1.1 1 H/h=1 R/h=10
0.9 U (m/s)
H/h=1 R/h=20 0.8
H/h=1 R/h=5
0.7
H/h=2 R/h=10 H/h=0.5 R/h=10
0.6
H/h=0.2 R/h=10
0.5 0.4 0
2
4
6
a/R Fig. 21. Depth-mean velocity at the centre of elliptical pits defined by the parameters a/R, H/h and R/h, as indicated by the various symbols.
It is evident from Figure 21 that, if the major axis of the ellipse is across the flow in the transverse direction (a/R< 1), then the flow slows down considerably in the pit compared with its undisturbed value of 0.997 m/s (i.e. flat bed case with ks= 0.05 m). However, if the major axis is in the longitudinal direction (a/R > 1), then the flow speed at the centre-point takes much larger values (U > 0.9 m/s for a/R > 2 for all but the deepest pits). The velocity at the centre of the longest shallow pit considered here (a/R = 5, H/h = 0.2, R/h = 10) is 0.993 m/s, virtually the same as the velocity in the undisturbed flow. The results in Figure 21 demonstrate the strong dependence of the maximum velocity upon a/R and H/h; the results are again very weakly dependent upon R/h, as found for circular pits. DISCUSSION
The results in Figure 21 suggest that the flow at the centre of an elliptical pit may be unable to exceed the undisturbed value of 0.997 m/s. These results were obtained using a spatially constant value of the bed roughness ks. If a spatially variable bed roughness is employed, the apparent constraint is relaxed. For example, taking ks= 0.05m outside the pit and ks= 0.005 m within it, the velocity at the centre-point increases to a value of 1.023 m/s which is somewhat larger than the undisturbed flat-bed value. However, whether or not this represents a physically relevant scenario when bed form dynamics are taken into account introduces factors other than those considered here. Although it has been suggested that flow separation will not have occurred in any of the pits considered in Figure 21, three-dimensional helical flow effects are quite likely to play a role in the overall dynamics of sand pits. Such helical secondary flows (with their axes lying in the main flow direction) may be induced by the topography itself or
13
Coastal Sediments '07
© 2007 ASCE
by transverse variations in the bed roughness (McLean, 1981). For example, if the bottom of an elliptical pit is rougher than the seabed generally, then both the shape of the bed and the roughness effect will complement one another to induce an up-slope secondary flow close to the bed that will help to stabilize the pit. In contrast, a relatively smooth pit interior will give rise to competing (positive ‘topography’ and negative ‘roughness’ driven) secondary helical flows that may have little net effect. CONCLUSIONS
The field data from the Dyfi Estuary indicates velocity enhancement in the scour pit at the estuary mouth, and a tidal simulation of the Dyfi using Telemac2D has confirmed this velocity enhancement. In order to derive some generic results concerning scour hole dynamics, model tests have been carried out using schematized pits in steady flow. These tests have shown that : - pits entrain additional fluid by perturbing the pressure field in the surrounding area. - the depth-mean velocity decreases in circular pits, which are therefore likely to infill. - for elliptical pits, the velocity at the pit centre depends strongly upon a/R and H/h, but only weakly on R/h and ks/h (H = depth of the pit, h = undisturbed water depth, ks = bed roughness, R = “effective” pit radius, a = semi-axis of ellipse in streamwise direction) . - shallow, elliptical pits with major-axes in the streamwise direction may be self maintaining. However, if such a pit deepens, this process will not continue indefinitely. In reality, apparently self scouring pits may rely on fixed bathymetric features (e.g. the presence of lateral channel banks or, in the Dyfi Estuary, dumped ballast in the estuary mouth). These issues require further study with regard to the sediment dynamics. ACKNOWLEDGEMENTS
The authors thank the Aberdyfi Partnership for making funds available, through Martin Wright Associates, to support the field campaign reported here. Ben Powell of the School of Ocean Sciences, UWB, and Mark Roberts of Civil Engineering Solutions, Dolgellau, mid-Wales, are thanked for their valuable contributions to the field work. REFERENCES
Davies A.G. and C. Villaret, 2003. “Sediment transport modelling for coastal morphodynamics,” Proceedings Coastal Sediments’03, CD-ROM Published by East Meets West Productions, Corpus Christi, TX ISBN-981-238-422-7, 14pp. Davies A.G., Berx B.E., Brown J.M. and Villaret C., 2005. “Morphological modelling of trenches and pits in wave-current flows.” Pp. AS 1-14 in SANDPIT, Sand Transport and Morphology of Offshore Mining Pits, by L.C. Van Rijn, R.L. Soulsby, P. Hoekstra and A.G. Davies (Eds.), Aqua Publications, The Netherlands. Hervouet J-M and Bates P., 2000. The Telemac Modelling System. Hydrological Processes, Vol. 14, (Special) Issue 13. McLean S.R., 1981. The role of non-uniform roughness in the formation of sand ribbons. Marine Geology, 42, 1-4,49-74. Van Rijn L.C., Soulsby R.L., Hoekstra P. and Davies A.G. (Eds.), 2005. “SANDPIT, Sand Transport and Morphology of Offshore Mining Pits.” Aqua Publications, The Netherlands, 716pp.
14