The Journal of Neuroscience, April 15, 2015 • 35(15):6165– 6178 • 6165
Cellular/Molecular
Loss of F-box Only Protein 2 (Fbxo2) Disrupts Levels and Localization of Select NMDA Receptor Subunits, and Promotes Aberrant Synaptic Connectivity Graham Atkin,1 Shannon Moore,2 Yuan Lu,4,5 Rick F. Nelson,6 Nathan Tipper,1 Gautam Rajpal,1 Jack Hunt,1 William Tennant,1 X Johannes W. Hell,4 Geoffrey G. Murphy,2,3 and Henry Paulson1 1Department of Neurology, 2Molecular and Behavioral Neuroscience Institute, and 3Department of Molecular and Integrative Physiology, University of Michigan, Ann Arbor, Michigan 48109, 4Department of Pharmacology, University of California, Davis, California 95615, 5Department of Psychiatry, University of Iowa, Iowa City, Iowa 52242, and 6Department of Otolaryngology, Indiana University, Indiana 46202
NMDA receptors (NMDARs) play an essential role in some forms of synaptic plasticity, learning, and memory. Therefore, these receptors are highly regulated with respect to their localization, activation, and abundance both within and on the surface of mammalian neurons. Fundamental questions remain, however, regarding how this complex regulation is achieved. Using cell-based models and F-box Only Protein 2 (Fbxo2) knock-out mice, we found that the ubiquitin ligase substrate adaptor protein Fbxo2, previously reported to facilitate the degradation of the NMDAR subunit GluN1 in vitro, also functions to regulate GluN1 and GluN2A subunit levels in the adult mouse brain. In contrast, GluN2B subunit levels are not affected by the loss of Fbxo2. The loss of Fbxo2 results in greater surface localization of GluN1 and GluN2A, together with increases in the synaptic markers PSD-95 and Vglut1. These synaptic changes do not manifest as neurophysiological differences or alterations in dendritic spine density in Fbxo2 knock-out mice, but result instead in increased axo-dendritic shaft synapses. Together, these findings suggest that Fbxo2 controls the abundance and localization of specific NMDAR subunits in the brain and may influence synapse formation and maintenance. Key words: Fbxo2; GluN1; GluN2A; NMDA; synapse
Introduction NMDA receptors (NMDARs) have profound effects on neuronal function health, survival (Hardingham, 2009), and memory formation (Morris et al., 1986). NMDAR dysregulation is linked to cognitive deficits and glutamate-induced excitotoxicity in neurodegenerative disease (Rowland et al., 2005; Parsons et al., 2007; Gladding et al., 2012; Pollak et al., 2014) Here, we examined the regulation of these important receptors by the ubiquitin ligase substrate adaptor protein F-box Only Protein 2 (Fbxo2). NMDARs are heterotetramers containing the obligatory GluN1 subunit and various GluN2 subunits (Monyer et al., 1992). GluN2A-containing receptors are preferentially localized Received July 22, 2014; revised March 1, 2015; accepted March 4, 2015. Author contributions: G.A., S.M., R.F.N., and H.P. designed research; G.A., S.M., R.F.N., N.T., G.R., J.H., W.T., and G.G.M. performed research; Y.L. and J.W.H. contributed unpublished reagents/analytic tools; G.A., S.M., Y.L., R.F.N., N.T., G.R., J.H., W.T., J.W.H., G.G.M., and H.P. analyzed data; G.A. and H.P. wrote the paper. Acknowledgements: We thank Chris Valdez and Eiko Minakawa for valuable help on experiments, and Biswa Ramani and Yanzhuang Wang for their insightful comments on the manuscript. This work was supported by National Institutes of Health Grant RO1 AG034228, pilot research funds from the Michigan Alzheimer’s Disease Center, and NIA, National Institutes of Health Grant T32-AG000114. This work was also supported by the University of Michigan Protein Folding Diseases Initiative. The authors declare no competing financial interests. Correspondence should be addressed to Henry Paulson, Department of Neurology, Biomedical Science Research Building, 109 Zina Pitcher Place, Room 4001, University of Michigan, Ann Arbor, MI 48104. E-mail:
[email protected]. G. Atkin’s present address: Van Andel Medical Research Institute, Grand Rapids, MI 49503. DOI:10.1523/JNEUROSCI.3013-14.2015 Copyright © 2015 the authors 0270-6474/15/356165-14$15.00/0
at synapses and GluN2B-containing receptors at extrasynaptic sites (Barria and Malinow, 2002). Synaptic NMDAR activation supports neuroprotection; extrasynaptic activation promotes apoptosis (Hardingham and Bading, 2010). GluN2A and GluN2B are the most expressed GluN2 types in mammalian hippocampus (Al-Hallaq et al., 2007; Gray et al., 2011), mediating the majority of NMDAR-dependent learning and memory (Morris et al., 1986; Lee and Kesner, 2002). Fbxo2 facilitates the turnover of GluN1 in vitro (Kato et al., 2005), but it remains unclear whether GluN2 subunits are similarly handled and if Fbxo2 regulates the turnover and trafficking of NMDAR subunits in vivo. Here, we show that Fbxo2 facilitates the degradation of select NMDAR subunits in the brain. In addition, we find that loss of Fbxo2 affects subunit localization and significantly increases synaptic connections.
Materials and Methods
Animals. Fbxo2 ⫺ / ⫺ mice were generated previously via the targeted deletion of the first five of six exons encoding Fbxo2 (Nelson et al., 2007). Mice used for these experiments were maintained on a C57BL/6J background strain. Examination showed that there were no abnormalities in brain size, weight, development, or adult gross brain structure. However, the cochleae of Fbxo2 knock-out mice demonstrate degeneration (Nelson et al., 2007). Animal care, handling, and experimental procedures described were approved by of the University of Michigan’s University Committee on the Use and Care of Animals.
6166 • J. Neurosci., April 15, 2015 • 35(15):6165– 6178
Atkin et al. • Loss of Fbxo2 Disrupts NMDARs and Synaptic Connectivity
DNA constructs, HEK cell culture, and cell lysate preparation. HEK-293 cell cultures were prepared and maintained as described previously (Nelson et al., 2007). Transfection of constructs for GFP-GluN1, GluN2A, GluN2B (gifts from W. Rebeck, Georgetown University), or Fbxo2 (gift from K. Glenn, University of Iowa) was performed using Lipofectamine 2000 (Invitrogen) following the manufacturer’s directions. Forty-eight hours after transfection, cells were lysed in hot denaturing buffer containing 2% SDS and 100 mM DTT. Cell lysates were boiled for 5 min, centrifuged, and loaded onto 4 –15% or 4 –20% gradient SDS-PAGE gels for Western blot analysis (BioRad). Cultured neurons were also processed in this manner for Western blot experiments. Brain extraction/lysis To prepare samples for immunoblotting, animals were anesthetized using ketamine/xylazine, followed by cardiac perfusion with prewarmed PBS. Brains were dissected out after decapitation. As necessary, hippocampi were rapidly removed under a dissecting microscope. Using a Dounce homogenizer, brain tissues were then homogenized in hot SDS (2%) lysis buffer with 100 mM DTT, centrifuged, and boiled for 5 min. A protein quantification kit (Macherey-Nagel) was used to measure the samples. Equal protein amounts Figure 1. Coexpression of Fbxo2 decreases levels of unassembled NMDAR subunits. a, Coexpression with Fbxo2 reduces GluN1 were electrophoresed on 4 –15% or 4 –20% SDSlevels. HEK293 cells expressing GFP-GluN1 together with vector encoding Fbxo2 or empty vector (EV) were harvested 48 h after PAGE gels. transfection and lysates were examined by Western blot with antibodies recognizing GluN1, Fbxo2, or GAPDH. b, c, GluN2A (b) and Western blot analysis. Proteins were immuGLuN2B (c) levels are similarly decreased after coexpression with Fbxo2. Fbxo2 and GluN2A or GluN2B were coexpressed as in a and noblotted using antibodies against GluN1 subunit levels assessed by Western blot with anti-GluN2A or anti-GluN2B antibody. Results shown are representative of triplicate (catalog #556308; 1:1000 dilution; BD Bioexperiments. d, Quantification of results from a–c. Data are presented as mean ⫾ SEM. *p ⬍ 0.05; **p ⬍ 0.01; ****p ⬍ 0.0001, sciences) or its extracellular epitope (catalog unpaired t test. #AGC-001; 1:500; Alomone), GluN2A (catalog #AGC-002; 1:500; Alomone), GluN2B portion of visual cortex (V1/V2) directly lateral and superior to region CA1 (catalog #AGC-003; 1:500; Alomone), GluR1 (catalog #MAB2263; 1:1000; of the hippocampus along with CA1 were selected for imaging. Three male Millipore), Fbxo2 (a gift from K. Glenn, University of Iowa, directed against mice of each genotype at the 6 month time point were examined. Immunothe PEST domain of Fbxo2; 1:2000), Transferrin Receptor (catalog #A11130; fluorescent intensities were analyzed using Fiji ImageJ software. 1:500; Invitrogen), or GAPDH (catalog #MAB374; 1:10,000; Millipore). Hippocampal neuron culture and immunofluorescence. Hippocampal Deglycosylation of NMDA subunits. The glycosylation status of neurons were cultured from 3 d postnatal male and female pups, plated at GluN2A and GluN2B was assessed as described previously (Huh and 80,000 cells per dish onto glass-bottom dishes (Mattek), and maintained Wenthold, 1999) with one modification: to increase the substrate-toand processed for immunocytochemistry as described previously (Sutenzyme ratio, GluN2 subunits were immunoprecipitated from separate ton et al., 2004; Atkin et al., 2014). Neurons were stained or harvested for hippocampal membrane fractions using antibodies directed against Western blotting at 14 d in vitro (DIV 14). Antibodies against GluN1 GluN2A (catalog #AHB0052; 1:500; Invitrogen) or GluN2B (catalog (Millipore), GluN2A (Alomone), GluN2B (Alomone), PSD-95 (Ab#A16629; 1:500; Invitrogen) conjugated to protein G beads (Invitrogen). cam), Vglut1 (Millipore), VGAT (Millipore), and spinophilin (MilliGlycolytic enzymes Endo H or PNGaseF (Sigma) were added directly to pore) were visualized using Alexa Fluor 488, 568, or 647 secondary pelleted beads after 24 h of precipitation in reaction buffer. Reaction antibodies (Invitrogen). Confocal images were obtained using an A-1 products were then examined by Western blotting as described above. confocal microscope (Nikon) at the University of Michigan Microscopy Immunohistochemistry of frozen brain sections. Mice were processed as and Image Analysis Laboratory. above, but were perfused with 4% paraformaldehyde in PBS after the PBS Proteolysis of surface proteins. The surface expression of GluN1 in hipflush. Upon extraction, brains were postfixed in 4% paraformaldehyde, pocampal neuron cultures at DIV 14 was assessed as described previously rinsed in PBS, and cryopreserved. After freezing, brains were cut into 12 (Hall and Soderling, 1997; Crump et al., 2001). Briefly, neurons were m sections and stored at ⫺80°C until use. Antibodies against GluN1 incubated with or without chymotrypsin (Sigma) for 10 min at 37°C and (catalog #556308; 1:500; BD Biosciences), GluN2A (catalog #AHB0052; then lysed and analyzed by Western blot. 1:1000; Invitrogen and catalog #AGC-002; 1:100; Alomone), PSD-95 Cell-surface ELISA. Surface levels of GluN1 among cultured neurons at (catalog #ab2723; 1:500; Abcam), Vglut1 (catalog #AB5905; 1:1000; MilDIV 14 in the presence or absence of 50 M bicuculine (Sigma) for 48 h lipore), VGAT (catalog #AB5062; 1:500; Millipore), and spinophilin were measured using a previously described method (Parnas and Linial, (catalog #AB5669; 1:1000; Millipore) were visualized with Alexa Fluor 1998) and an antibody directed against the extracellular loop of GluN1 488, 568, or 647 secondary antibodies (Invitrogen). Z-stack images were (1:100; Alomone). For each condition in these experiments, 320,000 neucollected using an A-1 confocal microscope (Nikon) at the University of rons were plated into each well of clear-bottom six-well dishes (Corning) Michigan Microscopy and Image Analysis Laboratory through equal and maintained as above. stack dimensions. For each antibody, all images for both wild-type and Acute slice biotinylation. Comparison of total protein amounts to surFbxo2 knock-out samples were collected using identical settings for gain, face levels was accomplished as described previously (Thomas-Crusells et laser intensity, background offset, pinhole, image size, Kalman processing, al., 2003; Atkin et al., 2014). In brief, male mice were anesthetized and scan rate, and all other variables associated with Nikon Elements image acquisition software. Images were cropped using Adobe Photoshop CS3. The their hippocampi rapidly removed in ice-cold, oxygenated artificial CSF
Atkin et al. • Loss of Fbxo2 Disrupts NMDARs and Synaptic Connectivity
J. Neurosci., April 15, 2015 • 35(15):6165– 6178 • 6167
sultant precipitates were centrifuged to separate the resin from the supernatant and the resin was resuspended in SDS (2%) lysis buffer with 100 mM DTT and boiled. This “surface” fraction was kept at ⫺80°C until being immunoblotted. Lanes containing 25 and 2.5 g of “total” protein were run on the same gel as 2.5 g of “surface” protein. Synaptosomal analysis. For synaptosomal isolation, hippocampi were removed from 9or 15-month-old mice perfused with PBS. Fresh hippocampi were lysed in Syn-PER Reagent (catalog #8773; Thermo Fisher Scientific). Samples were quickly spun at low speed to remove cell debris, then centrifuged at 16,000 ⫻ g for 20 min. After the supernatant was removed, the pellet containing synaptosomes was resuspended in Syn-PER reagent. For quantification, GluN1 levels in synaptosomes were normalized to PSD-95 and GluN1 levels in whole homogenate were normalized to GAPDH. Preparation of acute hippocampal slices for electrophysiology. Animals were placed under deep isoflurane anesthesia before decapitation. Coronal sections (300 m) were cut on a VT1000S vibratome (Leica) in ice-cold sucrose cutting solution saturated with 95% O2/5% CO2 containing the following (in mM): 206 sucrose, 26 NaHCO3, 2.8 KCl, 1.25 NaH2PO4, 1 CaCl2, 3 MgCl2, 0.4 ascorbic acid, and 25 D-glucose. Hippocampal slices were then allowed to recover for at least 1 h at room temperature in a holding chamber containing aCSF saturated with 95% O2/5% CO2 containing the following (in mM): 125 NaCl, 25 NaHCO3, 2.5 KCl, 1.25 NaH2PO4, 2 CaCl2, 1 MgCl2, 0.4 ascorbic acid, and 25 D-glucose. All recordings were made in a submerged chamber perfused continuously with oxygenated aCSF at elevated temperature (30 –32°C). ⫺/⫺ Figure 2. Increased levels of GluN1 and GluN2A, but not GluN2B, in Fbxo2 brain. a, Confocal immunofluorescence miElectrophysiology of synaptic transmission in croscopy in the CA1 region of hippocampus shows increased levels of GluN1 (left) and GluN2A (center) in 6-month-old Fbxo2 the hippocampus. Extracellular recordings of knock-out mice (bottom) compared with wild-type mice (top). All images for each antibody were collected using identical settings field EPSPs (fEPSPs) were made in the stratum for both genotypes (see Materials and Methods). Scale bar, 50 m. b–d, The absence of Fbxo2 increases GluN1 (b) and GLuN2A (c) radiatum of CA1 with a differential amplifier subunit levels, but not GluN2B subunit (d) levels, in whole brain. Subunit levels in brain lysates from wild-type and Fbxo2 null mice (DP-301; Warner Instruments) using borosiliwere assessed by Western blot, with representative immunoblots (top) shown for three mice of each genotype at 3 months of age. cate glass (Sutter Instruments) to make piSubunit levels were quantified (bottom) and normalized at four ages, with an n of three animals per genotype at each age. e, f, pettes with a P-97 Flaming-Brown pipette GluN2A (e) and GluN2B (f ) associated with hippocampal membranes remain Endo H sensitive. GluN2A or GluN2B was immunopuller (Sutter Instruments) with a tip resisprecipitated from hippocampal membrane fractions of 6-month-old wild-type mice and then incubated with Endo H, PNGase F, or tance of ⬃1 M⍀ filled with aCSF. Recordings (as a control) PBS alone. Deglycosylation of GluN2A or GluN2B was then assessed by Western blot with anti-GluN2A or GluN2B were digitized using an Molecular Devices antibody, respectively. The observed sensitivity to Endo H, indicating the presence of retained high-mannose glycans on GluN2A 1440A Digidata A/D converter and stored on a and GluN2B, was not altered in Fbxo2 null mice. Data are presented as mean ⫾ SEM. *p ⬍ 0.05, unpaired t test. Dell desktop computer running pClamp 10.2 (Molecular Devices). fEPSPs were evoked by stimulating the Schaffer collateral afferent fi(aCSF) containing the following (in mM): 125 NaCl, 25 NaHCO3, 2.5 bers with bipolar platinum electrodes (square pulse 100 s in duration). An KCl, 1.25 NaH2PO4, 2 CaCl2, 1 MgCl2, 0.4 ascorbic acid, and 25 input/output curve was first generated in aCSF by delivering test stimuli D-glucose. Next, 350 m hippocampal slices were cut using a MacIlwain every 10 s with increasing stimulus intensity (from 0 to 0.5 mA). To isolate tissue chopper and alternate sections from both hippocampi were incuthe NMDA-mediated component of the fEPSP response, aCSF containing bated in cold, oxygenated aCSF in the presence or absence of EZ-Link CNQX (50 M; Sigma-Aldrich) was then washed into the bath while continSulfo-NHS-LC-biotin (Pierce) for 45 min. Slices were then washed in uously monitoring the fEPSP amplitude at the half-maximum stimulus inaCSF and incubated briefly in lysine to quench any unbound biotin. tensity (once every 30 s). As expected, the amplitude of the fEPSP Slices were washed again in aCSF and those incubated without biotin significantly decreased in the presence of CNQX; when there was no further were processed for Western blotting as described above and retained at decrease in fEPSP amplitude, another input/output curve was generated (as ⫺80°C as the “total” fraction. Biotinylated slices were lysed in precipitaabove) in the presence of CNQX. The amplitude of the fiber volley and the tion buffer containing 1% Triton X-100, 0.1% SDS, 1 mM EDTA, 50 mM fEPSP were quantified relative to baseline. Statistical comparisons between NaCl, 20 mM Tris, pH 7.5, with protease inhibitors (Roche) in a Dounce conditions were made using repeated-measures ANOVA. homogenizer, and then centrifuged at 12,000 ⫻ g at 4°C for 5 min. Electrophysiology of miniature synaptic currents and long-term potentiStreptavidin resin (Pierce) was added to the supernatant and biotinylated proteins were then precipitated overnight at 4°C with rotation. The reation. aCSF-filled glass electrodes (resistance ⬍1 M⍀) were positioned in
6168 • J. Neurosci., April 15, 2015 • 35(15):6165– 6178
the stratum radiatum of area CA1 for extracellular recording. Synaptic responses were evoked by stimulating Schaffer collaterals with 0.1 ms pulses with a bipolar tungsten electrode (WPI.) once every 15 s. The stimulation intensity was systematically increased to determine the maximal fEPSP slope and then adjusted to yield 40 – 60% of the maximal fEPSP slope. Experiments with maximal fEPSPs of ⬍0.5 mV or with substantial changes in the fiber volley were rejected. After recording of a stable baseline for 15 min, LTP was induced by a 1 s/100 Hz stimulus train. fEPSPs were recorded (AxoClamp 2B amplifier; Molecular Devices), filtered at 1 kHz, digitized at 10 kHz (Axon Digidata 1200), and stored for offline analysis (Clampfit 9). Initial slopes of fEPSPs were expressed as percentages of baseline averages. In summary graphs, each point represents the average of four consecutive responses. The time-matched, normalized data were averaged across experiments and expressed as means ⫾ SEM. For statistical analysis, the last 5 minutes in each measurement were averaged and normalized to the average of the baseline preceding LTP induction before comparison with the corresponding control values. Whole-cell recordings from pyramidal neurons in CA1 with a holding potential at ⫺70 mV provided miniature EPSCs (mEPSCs). Patch pipettes (⬃3– 6 M⍀), were pulled from KG-33 glass capillaries (1.1 mm inner diameter, 1.7 mm outer diameter; Garner Glass) on a Flaming-Brown electrode puller (P-97; Sutter Instruments) and filled with internal solution containing the following (in mM): 125 K-gluconate, 20 KCl, 10 NaCl, 2 Mg-ATP, 0.3 Na-GTP, 2.5 QX314, 10 PIPES, 0.2 EGTA, pH 7.3, adjusted with KOH. Slices were perfused with aCSF. GABA receptor currents were blocked with 50 M picrotoxin (Sigma), NMDAR currents with 10 M APV (Sigma), and Na ⫹ channel currents with 1 M TTX (Sigma). Recordings were made using an Axopatch 200B amplifier (Molecular Devices), filtered at 1 kHz, digitized at 10 kHz via an Axon Digidata 1322A, and stored for offline analysis. Dendritic spine labeling. Acute hippocampal slices were prepared as above and then immediately fixed using 2% paraformaldehyde in PBS (Kim et al., 2007). After fixation, slices were rinsed and labeled with DiI (Invitrogen) for 24 h and then mounted using Prolong Gold antifade reagent (Invitrogen) and visualized as above. Z-stack images were reconstructed and dendrites were modeled in a semiautomated manner using Imaris software, as described previously (Swanger et al., 2011). Dendritic segments from the stratum radiatum of four male mice per genotype were analyzed, totaling 60 dendritic segments per genotype. Data were compiled using Microsoft Excel and analyzed using Prism 6 software (GraphPad). Transmission electron microscopy. For transmission electron microscopy (TEM), mice were anesthetized and flushed as above and then fixed with 2.5% glutaraldehyde in 0.1 M Sorensen’s buffer. Hippocampi were then dis-
Atkin et al. • Loss of Fbxo2 Disrupts NMDARs and Synaptic Connectivity
Figure 3. Elevated levels of PSD-95 and Vglut1 in Fbxo2 ⫺ / ⫺ brain. a, PSD-95 and Vglut1 immunofluorescence are increased in the CA1 region of 6-month-old Fbxo2 null mice (bottom) versus wild-type mice (top), whereas spinophilin and VGAT levels are unchanged. b, Quantification of immunofluorescence results from three mice per genotype (unpaired t test). All images for each antibody were collected using identical settings for both genotypes (see Materials and Methods). c, GluA1 levels in hippocampus of 6-month-old wild-type and Fbxo2-null mice were assessed by Western blot using an anti-GluR1 antibody (left). Quantification of immunoblots from three mice per genotype (d) showed no change in GluR1 levels. Scale bar, 50 m. Data are presented as mean ⫾ SEM. *p ⬍ 0.05.
Figure 4. Greater GluN1 immunoreactivity colocalizes with the presynaptic marker VGlut1 in cultured Fbxo2 ⫺ / ⫺ hippocampal neurons. a, GluN1 immunoreactivity in DIV 14 cultured hippocampal neurons was assessed by fluorescent confocal microscopy. Neurons were fixed, permeabilized, and immunostained for GluN1 and the synaptic marker Vglut. GluN1 puncta (arrows) colocalize with Vglut1 puncta. Two representative neurons per genotype are shown. b, GluN2A immunoreactivity is increased in cultured hippocampal neurons, whereas GluN2B is decreased (b). All images for each antibody were collected using identical settings for both genotypes (see Materials and Methods). Scale bar, 25 m.
Atkin et al. • Loss of Fbxo2 Disrupts NMDARs and Synaptic Connectivity
J. Neurosci., April 15, 2015 • 35(15):6165– 6178 • 6169
Hamamatsu ORCA-HR digital camera system, operated using AMT software (Advanced Microscopy Techniques). Four male animals per genotype were examined, totaling 500 m of dendritic segments from the stratum radiatum of hippocampus. The dendritic segments used in this analysis were from the apical dendrite field in the stratum radiatum of region Ca1 of the hippocampus closely adjacent to the pyramidal cell body layer. Shaft synapses were considered only if they demonstrated an asymmetric, electron-dense postsynaptic density juxtaposed to a presynaptic terminal with visible synaptic vesicles. Shaft synapses were counted by three separate laboratory staff members who were blinded to genotype and there was no statistically significant difference between their counts. Quantification and statistical analysis. Immunoblot results were scanned using Adobe Photoshop and analyzed using ImageJ software. Prism 6 software (GraphPad) was used for statistical analysis and to make graphs. Immunofluorescence data were analyzed using ImageJ, as described previously (Iliff et al., 2013; Atkin et al., 2014).
Results Fbxo2 has been shown to facilitate the degradation of the NMDAR subunits GluN1 in cultured neurons (Kato et al., 2005) and GluN2A in transfected, nonneuronal cells (Nelson et al., 2006). To investigate whether Fbxo2 similarly participates in the clearance of the NMDAR subunit GluN2B, we transiently expressed plasmids encoding GluN1, N2A, or N2B in HEK293 cells together with either FLAG-tagged Fbxo2 or empty vector (Fig. 1). Whereas levels of GluN1 and GluN2A were markedly reduced when coexpressed with Fbxo2 (Fig. 1a,b), consistent with Figure 5. NMDAR levels and cell surface localization are increased in cultured Fbxo2 ⫺ / ⫺ hippocampal neurons. a, GluN1 and prior studies (Kato et al., 2005; Nelson et GluN2A levels are increased in cultured Fbxo2-null neurons, whereas GluN2B levels are decreased. Cultured hippocampal neurons al., 2006), GluN2B levels were decreased isolated from postnatal day 3 wild-type and Fbxo2-null mice, DIV 14, were lysed and NMDAR subunit levels assessed by Western by only ⬃50% (Fig. 1c). When individublot. Representative results from three dishes per genotype are shown (left) and quantified (right). b, Fbxo2 absence results in ally expressed, NMDAR subunits are ungreater cell surface localization of GluN1. Intact neurons were treated with chymotrypsin for 15 minutes or left untreated, and then lysed and GluN1 levels were assessed by Western blot. Representative immunoblot results from a single experiment are shown able to transit from the ER to the Golgi and (left, with lighter exposure at immediate right) and results from triplicate experiments were quantified (right). c, Amount of cell surface (Horak et al., 2008), so these resurface GluN1 remaining after 48 h exposure to 50 M bicuculline, as detected by cell-surface ELISA assay, is reduced by ⬃50% in sults support a role for Fbxo2 in the ERwild-type neurons, but for Fbxo2 knock-out neurons, little or no surface GluN1 is lost after treatment. Treated and untreated associated degradation (ERAD) of GluN1, cultures were labeled with an antibody against the extracellular loop of GluN1 followed by horseradish peroxidase (HRP)- N2A, and N2B subunits. conjugated secondary antibody. HRP cleavage of tetramethylbenzidine in triplicate cultures per genotype per treatment was then Because NMDARs are specific to the detected and quantified. Data are presented as mean ⫾ SEM. *p ⬍ 0.05, **p ⬍ 0.005***p ⬍ 0.001; ****p ⬍ 0.0001, unpaired nervous system and Fbxo2 is enriched in t test. the brain, we next sought to examine the physiological significance of Fbxo2 on GluN1, N2A, and N2B in the brain. Using sected out under a dissecting scope and then immersion fixed overnight Fbxo2 knock-out mice previously generated in our laboratory at 4°C. Hippocampi were then trimmed to 1 mm ⫻ 1 mm blocks, rinsed in Sorensen’s buffer, postfixed for 1 h in 1% osmium tetroxide in the (Nelson et al., 2007), we observed increased GluN1 and GluN2A same buffer, and rinsed again in fresh Sorensen’s buffer. The tissue was in Fbxo2 knock-out mice, as visualized by confocal immunofluthen dehydrated in ascending concentrations of ethanol, transitioned orescence microscopy of 6-month old mouse brains. Throughout through propylene oxide, and embedded in Epon epoxy resin. Semithin the brain, we observed increased immunofluorescence for GluN1 sections were stained with toluidine blue for tissue identification. Seboth in neuronal cell bodies and throughout the neuropil, as lected regions of interest were ultrathin sectioned 70 nm in thickness, demonstrated in region CA1 of the hippocampus (Fig. 2a). Elemounted on copper mesh grids (Ted Pella), and poststained with uranyl vated GluN2A appeared predominantly throughout the neuroacetate and lead citrate. Sections were imaged using a Philips CM100 pil. No obvious subregional differences between cortex and electron microscope at 60 KV. Images were recorded digitally using a
6170 • J. Neurosci., April 15, 2015 • 35(15):6165– 6178
Atkin et al. • Loss of Fbxo2 Disrupts NMDARs and Synaptic Connectivity
hippocampus were observed (quantification of immunofluorescence not shown). The extent of these increases across all brain regions was quantified using Western blot, revealing that, in Fbxo2 knockout brains GluN1 levels are increased almost 3-fold over wild-type mice at 3 months of age and increased 1.5 to 2-fold at 6 and 9 months of age (Fig. 2b). GluN2A levels in the brain are also consistently increased in the absence of Fbxo2, to ⬃1.5-fold that of wild-type control levels from 3 through 9 months of age (Fig. 2c). This is consistent with the previously reported finding that a greater amount of GluN1 than GluN2 is produced, resulting in two intracellular pools of GluN1. The first pool correctly assembles with GluN2 subunits and transits to the plasma membrane, where it is long lived (Huh and ⫺/⫺ mice. a, Acute hippocampal slices Wenthold, 1999). In the second pool Figure 6. Enhanced surface localization of GluN1 and GluN2A in hippocampi of Fbxo2 from 6-month-old mice were incubated with oxygenated aCSF with or without biotin for 45 min, and processed to measure surface of excess, unassembled GluN1 subunits proteins (see Materials and Methods). Surface levels of GluN1 and GluN2A are nearly doubled in the absence of Fbxo2. Total and may serve as a reserve pool that is readily surface fractions were examined by Western blot for GluN1, GluN2A, GAPDH, or the transferrin receptor (a control glycoprotein available when rapid upregulation of known to have some surface expression). Representative immunoblot results are shown from a single animal of each genotype NMDARs is required. This pool of unas- (top). Slices from three animals per genotype were examined and the results quantified (bottom). b, Significant increase in GluN1 sembled GluN1 subunits is retained in the in hippocampal lysates, shown here in 9-month-old mice, does not appear to translate to enrichment in synaptosomes. A repreER and is short lived (Huh and Wenthold, sentative blot is shown at the top and quantification is shown at the bottom (n ⫽ 3). Data are presented as mean ⫾ SEM. *p ⬍ 1999). In contrast to GluN1 and N2A, 0.05, **p ⬍ 0.01, unpaired t test. GluN2B levels remain unchanged in immunopurified subunits were treated with Endo H or PNGaseF Fbxo2 knock-out brains at all ages examined (Fig. 2d), suggesting (which cleaves all N-linked glycans) or left untreated, and then that Fbxo2 may not regulate clearance of this subunit in the brain. examined by Western blot. We observed similar Endo H sensiThis result is not inconsistent with the transient expression studtivity for both GluN2A and GluN2B, evident as a decrease in ies described above, in which Fbxo2 had much less effect on the molecular weight (Fig. 2e,f ). The entire pool of both receptor levels of GluN2B than GluN1 or GluN2A. subunits remained Endo H sensitive at one or more oligosacchaHow Fbxo2 might selectively regulate certain subunits but not rides, suggesting that all GluN2A and GluN2B subunits, whether others remains unclear. As a substrate-binding ubiquitin ligase sequestered inside neurons or located on the cell surface, retain subunit, Fbxo2 preferentially targets glycoproteins that contain the high-mannose glycans required for recognition by Fbxo2. high-mannose glycans (Yoshida et al., 2002). As glycoproteins Both subunits showed further reduction in molecular weight transit from the ER through the Golgi apparatus, high-mannose when treated with PNGaseF, indicating the presence of additional, N-linked oligosaccharides are typically processed to a complex complex N-linked glycans. Given the abundance of posttranslational (i.e., not high-mannose) form that should not be recognized by modifications reported for GluN2 receptor subunits, GluN2B levFbxo2 (Helenius and Aebi, 2004). It has been suggested, however, els may be governed by mechanisms independent of Fbxo2. The that NMDAR subunits may not traffic through this canonical E3 ligase Mind bomb-2, for example, has been shown to regulate system, instead taking an alternate route for transport from the GluN2B levels in a phosphorylation-dependent manner (Jurd et ER to the cell surface (Jeyifous et al., 2009). Bypassing glycanal., 2008). processing enzymes in the Golgi would allow the high-mannose With regard to the second possibility, that Fbxo2 plays a role glycans placed on NMDAR subunits in the ER to be retained by in regulating NMDARs at the cell surface, heightened levels of these receptors on the cell surface. As a result, NMDAR subunits GluN subunits could represent an increase in receptor levels at would remain sensitive to endoglycosidase H (Endo H), which the plasma membrane or the retention of subunits in intracellular selectively cleaves high-mannose glycans on glycoproteins. This pools. Previously, pharmacologic elevation of NMDAR subunit was shown previously to be the case for GluN1 (Huh and levels was shown to increase NMDA synaptic currents and enWenthold, 1999), raising two intriguing possibilities: (1) that the hance postsynaptic plasticity (Rinaldi et al., 2007). Overexpresdifferential effect on GluN2A and GluN2B levels in Fbxo2 knocksion of GluN2A and GluN2B has also been shown to cause the out brain reflects a subunit difference in the retention of highformation of increased synaptic NMDARs (Tang et al., 1999; mannose glycans on GluN2A versus GluN2B subunits and/or (2) Foster et al., 2010), but whether the robust increase in endogethat, even in the peripheral membrane, NMDAR subunits remain nous subunit proteins observed in Fbxo2 knock-out mice would potential candidates for regulation by Fbxo2 in a manner that increase synaptic levels remains unclear. Fbxo2 is expressed extends beyond its postulated role in ERAD. throughout the cytoplasm, including along dendrites and at synTo investigate the first of these possibilities, we tested whether apses (Kato et al., 2005). To address whether the increased enthese NMDAR subunits are similarly Endo H sensitive. Hipdogenous NMDAR subunits in Fbxo2 knock-out mice were pocampi were removed from 6-month-old mice, membrane present on the cell surface and at synapses, we used several lines of fractions were prepared, and GluN2A and GluN2B subunits were investigation. First, we hypothesized that a substantial increase in then immunoprecipitated from separate samples. The resultant
Atkin et al. • Loss of Fbxo2 Disrupts NMDARs and Synaptic Connectivity
J. Neurosci., April 15, 2015 • 35(15):6165– 6178 • 6171
NMDAR content at synapses would involve a concomitant increase in the extent of postsynaptic architecture necessary to stabilize those receptors. PSD-95 has been shown to anchor GluN2A-containing receptors at synaptic sites on the cell surface (Elias et al., 2008). In addition, presynaptic markers might also increase as a response to additional postsynaptic content. We previously reported an increase in PSD-95 and Vglut1 in cultured hippocampal neurons from mice lacking Fbxo2 (Atkin et al., 2014) and therefore inquired whether this same phenomenon was present in vivo. Using confocal immunofluorescence microscopy, we observed significantly increased PSD-95 and Vglut1 levels in the CA1 region of the hippocampus from 6-month-old Fbxo2 knock-out mice (Fig. 3a,b). In contrast, we did not observe significant changes in the levels of spinophilin, a protein enriched in dendritic spines, or of the vesicular GABA transporter (VGAT) present at synapses of inhibitory interneurons. Despite the increase in presynaptic and postsynaptic markers, we did not observe a difference in the levels of the AMPA receptor (AMPAR) subunit GluA1 (Fig. 3c,d). NMDAR function is voltage dependent, with AMPARs playing the role of a depolarizing agent for the postsynaptic cell. Several identified Fbxo2 substrates have been implicated in synapse formation and stability, including Beta Integrin 1 (Yoshida et al., 2002), Amyloid Precursor Protein (Tyan et al., 2012; Atkin et al., 2014), and NMDARs themselves (Kwon and Sabatini, 2011). With this heightened expression, colocalization of GluN immunoreactivity with that of synaptic markers appeared to be extensive. Because the question of GluN1’s surface and synaptic localization is central to understanding the consequences of Fbxo2’s absence, we elected to examine protein distribution and colocalization more carefully in cultured hippocampal neurons. Cultured neurons provide an effective means with which to assess biochemically the handling of proteins in living neurons and to visualize protein localization with greater resolution than in vivo immunofluorescence. We cultured hippocampal neurons from postnatal day 3 wild-type and knock-out pups and examined the colocalization of GluN1 with synaptic markers by confocal immunofluorescence microscopy. GluN1 levels were increased throughout Fbxo2 knock-out neurons, most notably at numerous, large GluN1-positive puncta in dendrites (Fig. 4a, arrows). These puncta colocalize with the synaptic marker Vglut1 (Fig. 4a), suggesting that the increased NMDAR levels are indeed present at synapses. GluN2A levels are also increased in cultured neurons and GluN2B levels appear decreased by immunofluorescence (Fig. 4b). The changes in GluN subunit levels in cultured neurons were quantified by Western blot. At DIV 14, Fbxo2 knock-out neurons showed similar increases in GluN1 and GluN2A levels as intact brain, but a decrease in GluN2B levels (Fig. 5a). As previously reported, Fbxo2 is expressed as early as DIV 3 in this system compared with ⬃1 month of age in vivo (Glenn et al., 2008; Atkin et al., 2014). Fbxo2 has been reported to clear proteins through ERAD (Nelson et al., 2006) and has not been recognized to regulate the surface levels of substrate proteins. However, Kato et al. (2005) demonstrated that, when a dominant-negative form of Fbxo2 4
Figure 7. The loss of Fbxo2 does not alter hippocampal synaptic transmission. a, fEPSPs were measured in acute slices of hippocampi from wild-type and Fbxo2 knock-out mice at the indicated stimulus intensities both in the presence and absence of CNQX (empty and filled
circles, respectively) and quantified. Neither AMPA- nor NMDA-mediated currents differed between genotype. b, Fiber volley amplitude was similarly unchanged. c, No difference was observed when fEPSPs were plotted against fiber volley amplitude. Statistical analyses were made using repeated-measures ANOVA. Recordings were made from 19 slices harvested from 5 wildtype (WT) mice and 17 slices harvested from 5 knock-out (KO) mice. Six-month-old KO and WT mice were used for studies.
6172 • J. Neurosci., April 15, 2015 • 35(15):6165– 6178
Atkin et al. • Loss of Fbxo2 Disrupts NMDARs and Synaptic Connectivity
was transiently expressed in cultured hippocampal neurons, NMDA-evoked currents recorded from those neurons were resistant to activity-dependent reduction, suggesting that NMDARs no longer being degraded by Fbxo2 are retained on the cell surface. To address this point directly, we investigated whether the increased GluN1 levels in Fbxo2 knock-out neurons corresponded to subunits expressed on the cell surface or to subunits retained in the cell. Exogenously applied chymotrypsin cleaves the extracellular domain of transmembrane proteins present on the surface of neurons. Using this technique and Western blot analysis, we measured GluN1levels in untreated cultures versus GluN1 levels remaining after chymotrypsin cleavage, with the chymotrypsinresistant fraction representing GluN1 sequestered within neurons. After chymotrypsin treatment, a lower-molecularweight, GluN1-immunoreactive band of ⬃50 kDa was observed, which presumably represents the intracellular portion of the receptor left after cell surface cleavage. Of the nearly 150% increase in GluN1 in Fbxo2 knock-out neurons, only ⬃10% was chymotrypsin resistant, significantly less than in wild-type control neurons (Fig. 5b). These results suggest that nearly all of the increased GluN1 subunits in the absence of Fbxo2 reach the cell surface. We next inquired whether the absence of Fbxo2 led to changes in the removal of GluN1 from the cell surface. In an earlier study, Kato et al. (2005) drove the activity-dependent downregulation of synaptic NMDARs evoked by treatment with bicuculline for 48 h. Exposure to bicuculline for 48 h has been shown to cause the internalization of NMDARs. In a cellsurface-based ELISA assay, we measured NMDAR internalization in bicucullinetreated versus untreated neuronal cultures. Whereas approximately half of the surface receptors in wild-type neurons Figure 8. The loss of Fbxo2 does not alter hippocampal miniature synaptic currents or LTP induction. a, Examples of AMPAR ⫺/⫺ mice. Cumulative fraction (b, left) and histowere cleared from the cell surface after mEPSCs from acute hippocampal slices from littermate wild-type and Fbxo2 gram distribution (insert) of mEPSC amplitude are unchanged in knock-out mice. The amplitude average (b, right) is comparable 48 h of bicuculline treatment, nearly all of the surface receptors in Fbxo2 knock-out between wild-type and littermate-matched knock-out mice. Cumulative fraction (c, left) and histogram distribution (insert) of neurons remained on the surface, as indi- mEPSC frequency is not significantly changed in the absence of Fbxo2. The frequency average (c, right) is comparable between wild-type and knock-out mice. Cumulative fraction (d, left) and histogram distribution (insert) of mEPSC decay tau is not significated by equal surface immunoreactivity cantly changed in knock-out mice. The decay tau average (d, right) is comparable between wild-type and knock-out mice. p-values between treated and untreated cultures of from a two-tailed Student’s t test are shown in each subpanel. e, LTP is not affected in Fbxo2 knock-out mice. LTP was induced by Fbxo2 knock-out neurons (Fig. 5c). These a single tetanus (1 s/100 Hz; arrow in f) in CA1 of acute hippocampal slices from Fbxo2 knock-out and littermate-matched wild-type results are consistent with the findings of control mice. Example fEPSPs recordings before (dashed lines) and 60 min after (solid lines) LTP induction from wild-type and Kato et al. (2005) and suggest a persis- knock-out mice are shown. f, Averages of the complete time courses are shown from wild-type and knock-out mice. LTP is comparable in tence of NMDARs at the cell surface after hippocampal slices from wild-type and knock-out mice. Recordings in a–d were obtained in 9 cells from 3 WT mice and 12 cells from 3 KO mice. Recordings in e were obtained from 9 slices harvested from 3 WT mice and 12 slices harvested from 3 KO mice. loss of Fbxo2. We next sought to determine whether to measure surface proteins, as described previously (Thomasthis increased surface localization of GluN1 also occurred in the Crusells et al., 2003; Atkin et al., 2014). We focused on the hipadult hippocampus. Chymotrypsin cleavage and cell-surfacepocampus because of its functional importance and because it is based ELISA are not compatible with ex vivo hippocampi, so a discrete subcortical region that can be readily and reproducibly instead we used surface biotinylation of acute hippocampal slices
Atkin et al. • Loss of Fbxo2 Disrupts NMDARs and Synaptic Connectivity
J. Neurosci., April 15, 2015 • 35(15):6165– 6178 • 6173
describe increased axo-dendritic shaft synapses (as opposed to spinous synapses) in Fbxo2-null mice, but whether such nontraditional synapses would segregate in our synaptosomal preparations is unknown. These observed differences raise intriguing questions about the function of NMDARs in Fbxo2 knock-out mice. The increased cell surface NMDAR subunits and increased synaptic marker proteins in Fbxo2 knock-out mice led us to predict that NMDA-mediated currents in acute hippocampal slices would also be increased in knock-out mice. However, field potential recordings from region CA1 of hippocampus in 3- to 6-month-old Fbxo2 knock-out mice did not reveal any difference in basal transmission (Fig. 7a, filled circles) or in NMDA-mediated current recorded in the presence of the AMPAR blocker CNQX (Fig. 7a, open circles). Moreover, no difference was observed in the size of presynaptic fiber volleys evoked for each genotype (Fig. 7b) and plotting the presynaptic fiber volley data against the fEPSPs revealed no difference between genotypes (Fig. 7c). The frequency, amplitude, and decay of spontaneous mEPSCs did not differ between genotype (Fig. 8b– d). LTP evoked by 100 Hz stimulation was also equal in amplitude and persistence out to 60 min for mice with and without Fbxo2 (Fig. 8e,f ). The unexpected absence of neurophysiological differences in Fbxo2 knockFigure 9. Dendritic spine density is not affected by the loss of Fbxo2. a, Dendritic spines of CA1 pyramidal neurons from out mice despite the evidence of increased 6-month-old mice were labeled with DiI, imaged by confocal laser microscopy, and then reconstructed using Imaris software (see NMDAR subunits suggests that the inMaterials and Methods), as represented in an example of imaged spines (top) and their reconstruction (with dendrite reconstruccreased NMDARs in Fbxo2 knock-out tion removed to aid visualization of spines, bottom). Scale bar, 5 m. b, Representative examples of wild-type and Fbxo2-null dendrites are shown. Scale bar, 10 m. c, Quantification of dendritic spine density reveals no difference between genotypes (top mice are not functional and do not particleft). Spine length is decreased by 22% in the absence of Fbxo2 (top right). Spine head diameter is increased by 10% (bottom left) ipate in synaptic transmission; the synapand spine neck diameter is decreased by 13% (bottom right) in Fbxo2 knock-out mice. Quantified data represent ⬃6000 spines tosomal studies shown in Figure 6b are consistent with this view. The lack of a from 60 dendritic segments per genotype. Data are presented as mean ⫾ SEM. ****p ⬍ 0.0001, unpaired t test. concomitant increase in GluR1 levels (Fig. 3c) suggests one potential mechanism by isolated by dissection. After surface biotinylation and immunowhich additional synapses in Fbxo2 knock-out mice are kept siprecipitation, Fbxo2 knock-out hippocampus showed signifilent: the absence of sufficient AMPARs to depolarize the postsyncantly increased surface GluN1 and GluN2A, ⬃2-fold that aptic cell. However, all recordings were performed in low or zero observed in wild-type control hippocampus (Fig. 6). In contrast, Mg 2⫹, a nonphysiologic condition that circumvents the voltagelevels of the Transferrin Receptor, a loading control protein with dependent blockage of NMDARs. Even in the absence of Mg 2⫹ cell surface expression but not an Fbxo2 substrate, were not alblockage, numerous other potential mechanisms exist for the tered in Fbxo2 knock-out mice. Although this approach only capmodulation and silencing of NMDAR activity, including regulatures a snapshot of NMDAR subunit distribution at one time tion by various kinases (Ali and Salter, 2001; Gardoni et al., 2001; Lin et al., 2006; Skeberdis et al., 2006). point, the findings are consistent with our in vitro data and sugGiven the absence of neurophysiological consequences resultgest a dysregulation of NMDAR handling in the absence of ing from increased GluN1 and GluN2A in Fbxo2 knock-out Fbxo2. brains, we recognized that it was important to assess the morphoAs another measure to estimate the extent to which increased logical impact of increased NMDAR subunits, as well as increased NMDAR subunits in Fbxo2 null mice reflect synaptic changes, we presynaptic and postsynaptic marker proteins, on the structures performed synaptosomal enrichment from hippocampal lysates essential for synaptic transmission. To do so, we subjected thick of adult (9- to 15-month-old) mice. Results for GluN1, shown in Figure 6b, suggest that the increased NMDAR subunits observed sections of region CA1 to labeling with DiI and imaging by conin the absence of Fbxo2 may predominantly reside at regions focal microscopy. Dendrites were then reconstructed in 3D and other than the synapse. Results presented later (see Fig. 10) spines were measured and counted in a semiautomated manner
6174 • J. Neurosci., April 15, 2015 • 35(15):6165– 6178
Atkin et al. • Loss of Fbxo2 Disrupts NMDARs and Synaptic Connectivity
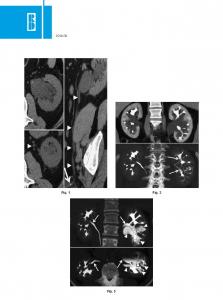
(example images are shown in Fig. 9a,b). Using this method, we observed no difference in the density of dendritic spines (Fig. 9c) but a significant reduction in spine length, with spines in Fbxo2 knockout hippocampus reaching only 78% of the length seen in wild-type neurons (Fig. 9c). Much smaller but statistically significant differences were observed in the diameter of the head and neck of spines: on average, knock-out spine heads were 10% larger and the necks 13% thinner (Fig. 9c). Overall, however, there were minimal differences in spine size and shape and no difference in density. Therefore, the extensive changes in NMDAR protein content evident in Fbxo2 knock-out mice do not appear to impair mechanisms regulating spine morphology and spine density. With no apparent change in spine density or neurophysiological parameters in Fbxo2 knock-out mice, the presence of increased synaptic markers seems paradoxical. In an effort to explain this discrepancy, we examined the ultrastructure of pyramidal cells in region CA1 by TEM. The higher resolution of TEM revealed a marked increase in axo-dendritic shaft synapses (Fig. 10a–f ) in Fbxo2 knock-out hippocampus. These synapses typically demonstrated both an asymmetric, electron-dense postsynaptic density and juxtaposition to a presynaptic terminal with apparent vesicles (Fig. 10b,d,f, insets enlarged); symmetrical synapses were also Figure 10. Increased density of axo-dendritic shaft synapses in CA1 neurons of Fbxo2 ⫺ / ⫺ mice. TEM reveals increased observed, but less frequently (data not dendritic shaft synapses in CA1 region of hippocampus from 6-month-old Fbxo2-null mice. Representative images show synapses shown). Although shaft synapses were on dendritic shafts (false-colored green) at sites adjacent to spinous synapses (a, b, inset) and along peripheral membranes (c, e, rarely seen in wild-type dendrites, consis- with respective insets in d, f). Synapses were identified by the presence of an asymmetric, electron-dense postsynaptic structure (c, tent with published reports (Megías et al., d, f, arrows) opposed to a presynaptic terminal with visible, round, synaptic vesicles (b, d, f, labeled “V”). g. The increase in density of shaft synapses per animal was quantified from 500 m of dendritic length from four animals per genotype. Error bars indicate 2001; Bourne and Harris, 2011), they dec- SEM. *p ⬍ 0.05. Scale bars: a, c, e, 500 nm; b, d, f, 250 nm. orated Fbxo2 knock-out neurons at a much higher density, approaching that of also placing demands on local protein synthesis (Huber et al., spinous synapses (⬃50 –75%; Fig. 10g). Shaft synapses were 2000; Huang and Kandel, 2007). Protein quality control pathfound both adjacent to dendritic spines (Fig. 10a,b) and at a ways ensure that these demands are met with the appropriate distance from them (Fig. 10c–f ). A subset of these structures complement of properly synthesized and correctly assembled displayed a discontinuous, or perforated, postsynaptic density proteins. As a brain-enriched ubiquitin ligase substrate adaptor (Fig. 10d,e), but each of these was still counted as a single synapse protein linked to ERAD (Nelson et al., 2006), Fbxo2 is an intrigufor the purposes of quantification. Together, these results suggest ing component of the quality control pathways responding to the that the increased levels of synaptic markers in Fbxo2 knock-out unique proteostatic needs of neurons, especially given its localneurons correspond to additional axo-dendritic shaft synapses. ization both at synapses and throughout the cytoplasm (Kato et al., 2005). Proteins synthesized near synapses are processed in Discussion specialized ER (Cui-Wang et al., 2012) and there is limited eviIn the present study, we we have identified a role for Fbxo2 in dence for the presence of the Golgi apparatus at these local sites regulating the levels of specific NMDAR subunits in vivo. In and Ehlers, 2008). Therefore, GluN subunits likely are (Hanus mice lacking Fbxo2, we found increased levels and enhanced not the only synaptic proteins still bearing high-mannose glycans surface localization of GluN1 and GluN2A subunits. These and thus recognizable by Fbxo2. For example, Fbxo2 is decreased changes were accompanied by elevated amounts of synaptic in Alzheimer’s disease (AD) patient brains (Gong et al., 2010) and marker proteins but no change in dendritic spine density. has been linked to the regulation of the glycoprotein Amyloid These additional synapses did not appear to affect synaptic Precursor Protein, a central protein in AD (Atkin et al., 2014). We transmission and were shown by TEM to be localized along now link Fbxo2 to a second factor implicated in AD, the dysregudendritic shafts. lation of NMDARs. Further studies are needed to fully address Many forms of neuronal plasticity require the degradation of the contribution of Fbxo2 to AD. existing synaptic proteins (Ehlers, 2003; Dong et al., 2008) while
Atkin et al. • Loss of Fbxo2 Disrupts NMDARs and Synaptic Connectivity
J. Neurosci., April 15, 2015 • 35(15):6165– 6178 • 6175
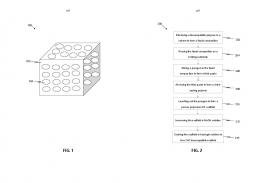
Figure 11. Proposed model for altered handling of NMDARs and aberrant formation of axo-dendritic shaft synapses in the absence of Fbxo2. Based on coexpression experiments with uncoupled receptor subunits and analysis of brain lysates, we propose that Fbxo2 plays a role in limiting the steady-state levels of newly synthesized GluN1 and GluN2A in the ER (1). As steady-state levels increase, subunits complex together with scaffolding and trans-synaptic proteins and leave the ER to be trafficked to synapses (2). Homeostatic mechanisms limit the number of NMDARs at a given synapse, shuttling unused receptor complexes to and from reserve pools at nonsynaptic sites in the peripheral membrane (3). As NMDARs are endocytosed in response to activity or as part of their normal lifespan, the option to degrade these receptors is lost in the absence of Fbxo2, causing most or all receptors to recycle back to the surface and keeping the reserve pool large (4). Given a sufficient density of receptor complexes—with associated scaffolds and trans-synaptic proteins—these pools recruit presynaptic branching to create axo-dendritic shaft synapses (5).
The increase in cell surface GluN1 and GluN2A in Fbxo2 ⫺ / ⫺ mice likely reflects more than a straightforward elevation of substrate protein levels and may result from one of two scenarios. First, Fbxo2 could affect the endocytosis of receptors through ubiquitin-dependent signaling on subunits and, indeed, such a mechanism has been described for EGF receptors (Fallon et al., 2006; Huang et al., 2013). Alternatively, Fbxo2 may play a key role in determining receptor fate downstream of endocytosis (Fig. 11). Receptors on the surface are regularly endocytosed and either recycled back to the surface or targeted for degradation (Petralia et al., 2009). A role for Fbxo2 in this triage pathway is supported by the presence of high-mannose glycans on membrane-associated GluN subunits, suggesting their continued capacity to interact with Fbxo2. The fact that Fbxo2, an intracellular protein, binds high-mannose glycans that reside on the extracellular face of surface glycoproteins argues against a direct role for Fbxo2 in regulating endocytosis itself. Therefore, we suggest that internalization must precede Fbxo2-directed ubiquitination of GluN subunits, much like the activity-dependent ubiquitination of GluA2 follows endocytosis of the receptor (Lussier et al., 2011). Once internalized, the formerly extracellular glycans would reside within endosomes, but a mechanism analogous to the ERAD translocation apparatus could facilitate substrate presentation to Fbxo2. The observation that Sec61B, a core component of the ER translocation machinery, resides on endosomes supports this scenario (Guermonprez et al., 2003; Houde et al., 2003). Similarly, delivery of substrates to dendritic ER, followed by presentation to the cytosol, remains a possibility. The kinetics of NMDAR endocytosis and exocytosis would remain the same in this scenario, but Fbxo2 knock-out neurons would fail to degrade NMDARs and thus recycle them to an increasing surface pool. Evoking NMDAR internalization with bicuculline, as used here and elsewhere, requires a 48 h treatment, making it difficult to interpret whether NMDAR endocytosis is impaired. More rapid internalization protocols with alternative pharmacologic treatments were attempted but did not elicit
robust, consistent internalization of NMDARs in wild-type controls. Further studies using subunits with pH-sensitive fluorescent tags could reveal whether receptor recycling changes when Fbxo2 is absent. Beyond Fbxo2’s role in GluN subunit degradation, it is likely that many other mechanisms contribute to the regulation of NMDAR levels and activity at the synapse. The contribution of those subunits to synaptic transmission and downstream NMDAR-mediated signaling is probably determined by numerous complex mechanisms governing homeostatic plasticity in which Fbxo2 may play little, if any, direct role. Because Fbxo2 is expressed at the highest levels during development of the nervous system and is reduced in the adult animal, alternative nonFbxo2-mediated mechanisms probably become more important over time. That we observed no change in spine density and minimal changes in head diameter suggests that, without Fbxo2, the mechanisms responsible for regulating spinous synapse morphology continue to function (Nikonenko et al., 2002; Ultanir et al., 2007; Fortin et al., 2010). Our findings raise an intriguing question: where, if not at spinous synapses, do the additional NMDARs in Fbxo2 knockout mice reside? The plasma membrane is populated with pools of receptors that are believed to function as a reserve stock for rapid changes at synapses (Meier et al., 2001; Lai and Jan, 2006; Newpher and Ehlers, 2008; Petrini et al., 2009). Upwards of 65% of synaptic NMDARs are mobile and participate in exchange with extrasynaptic pools (Tovar and Westbrook, 2002). It is unclear, however, what regulates the size of these reserve pools. GluN2Acontaining receptors are preferentially targeted to synapses, but are also found in reserve pools and can be trafficked laterally into synapses as needed (Tovar and Westbrook, 2002). Because we saw no major morphological changes at spinous synapses and observed no alteration in synaptic transmission, it stands to reason that the enhanced levels and surface localization of GluN1 and N2A in Fbxo2 knock-out mice represent an increase in reserve pools.
Atkin et al. • Loss of Fbxo2 Disrupts NMDARs and Synaptic Connectivity
6176 • J. Neurosci., April 15, 2015 • 35(15):6165– 6178
On its own, an enlarged reserve pool would not account for the significant increase that we observed in synaptic markers. Previous studies overexpressing GluN subunits reported increased NMDA-mediated synaptic currents (Tang et al., 1999; Foster et al., 2010), but did not assess whether they were accompanied by additional synaptic markers. The NMDAR interacts with PSD-95, which has been suggested to serve as a scaffold for trans-synaptic proteins, and the Fbxo2 substrates Beta Integrin 1 and the Amyloid Precursor Protein have been implicated in determining synapse number (Bassand et al., 1999; Gardoni et al., 2003). Additional, as-yet-unidentified Fbxo2 substrates may also mediate this phenomenon. Perhaps if the reserve pool in the peripheral membrane reached sufficient density and complexity, it could recruit presynaptic branching and an opposed axonal terminal, thereby creating a shaft synapse. We propose that failure to clear NMDAR subunits both through ERAD and activitydependent endocytosis results in aberrant clustering in the peripheral membrane (Fig. 11). Determining the precise proteins responsible for the observed shaft synapses will require additional studies because the mechanisms regulating the formation and removal of excitatory shaft synapses are not well characterized. Excitatory shaft synapses are relatively uncommon under normal physiologic conditions (Bourne and Harris, 2011), but can be rapidly induced after LTP in the hippocampus (Chang and Greenough, 1984; Bourne and Harris, 2011). Shaft synapse numbers can also increase after experiential modifications of awake, behaving animals (Jones et al., 1997; Helmeke et al., 2001; Nikolakopoulou et al., 2006). The formation of shaft connections is not necessarily an intermediate step toward spine extension from the shaft, as suggested previously (Ethell and Pasquale, 2005; Bourne and Harris, 2011). Spine outgrowth precedes synaptic connectivity (Knott et al., 2006) and studies of overexpressed EphB3 reveal an increase in shaft synapses with no effect on spinogenesis (Aoto et al., 2007). The mechanisms by which shaft synapses are removed are also unclear, with reports of both rapid removal (Nikolakopoulou et al., 2006; Bourne and Harris, 2011) and persistence for hours (Chang and Greenough, 1984) after tetanic stimulation. Activity blockade can cause the selective elimination of shaft, but not spinous, synapses; in contrast, epileptiform activity induces a reduction in spinous, but not shaft, synapses (Zha et al., 2005). “Removal” itself may be a misnomer because rapidly produced shaft synapses may actually be redistributed to strengthen and enlarge selected spinous synapses (Bourne and Harris, 2011). As a caveat, extensive remodeling of synaptic connections has been reported after preparation of acute slices (Kirov et al., 1999). To bridge our morphological and electrophysiological findings, further studies are required to address how Fbxo2 influences the maintenance of shaft synapses and how, in its absence, they remain electrophysiologically inert. Shaft synapse formation after overexpression of the postsynaptic protein EphB3 is marked by increased excitatory transmission in cultured neurons (Aoto et al., 2007). Conceivably, increasing shaft synapses in vivo on the scale observed here would lead to epileptogenic activity that could be fatal. Therefore, their silencing may be an essential, compensatory response. It is possible that their localization makes shaft synapses more potent (Segev and Rall, 1988) and causes the loss of input selectivity, which could evoke a compensatory decrease in the length of dendritic spines (Arellano et al., 2007, but see Bloodgood et al., 2009), as we observed (Fig. 9c). Additional studies exploring shaft synapses are needed to address their potential contribution to learning and memory.
References Al-Hallaq RA, Conrads TP, Veenstra TD, Wenthold RJ (2007) NMDA diheteromeric receptor populations and associated proteins in rat hippocampus. J Neurosci 27:8334 – 8343. CrossRef Medline Ali DW, Salter MW (2001) NMDA receptor regulation by Src kinase signalling in excitatory synaptic transmission and plasticity. Curr Opin Neurobiol 11:336 –342. CrossRef Medline Aoto J, Ting P, Maghsoodi B, Xu N, Henkemeyer M, Chen L (2007) Postsynaptic ephrinB3 promotes shaft glutamatergic synapse formation. J Neurosci 27:7508 –7519. CrossRef Medline Arellano JI, Benavides-Piccione R, Defelipe J, Yuste R (2007) Ultrastructure of dendritic spines: correlation between synaptic and spine morphologies. Front Neurosci 1:131–143. CrossRef Medline Atkin G, Hunt J, Minakawa E, Sharkey L, Tipper N, Tennant W, Paulson HL (2014) F-box only protein 2 (Fbxo2) regulates amyloid precursor protein levels and processing. J Biol Chem 289:7038 –7048. CrossRef Medline Barria A, Malinow R (2002) Subunit-specific NMDA receptor trafficking to synapses. Neuron 35:345–353. CrossRef Medline Bassand P, Bernard A, Rafiki A, Gayet D, Khrestchatisky M (1999) Differential interaction of the tSXV motifs of the NR1 and NR2A NMDA receptor subunits with PSD-95 and SAP97. Eur J Neurosci 11:2031–2043. CrossRef Medline Bloodgood BL, Giessel AJ, Sabatini BL (2009) Biphasic synaptic Ca influx arising from compartmentalized electrical signals in dendritic spines. PLoS Biol 7:e1000190. CrossRef Medline Bourne JN, Harris KM (2011) Coordination of size and number of excitatory and inhibitory synapses results in a balanced structural plasticity along mature hippocampal CA1 dendrites during LTP. Hippocampus 21:354 –373. CrossRef Medline Chang FL, Greenough WT (1984) Transient and enduring morphological correlates of synaptic activity and efficacy change in the rat hippocampal slice. Brain Res 309:35– 46. CrossRef Medline Crump FT, Dillman KS, Craig AM (2001) cAMP-dependent protein kinase mediates activity-regulated synaptic targeting of NMDA receptors. J Neurosci 21:5079 –5088. Medline Cui-Wang T, Hanus C, Cui T, Helton T, Bourne J, Watson D, Harris KM, Ehlers MD (2012) Local zones of endoplasmic reticulum complexity confine cargo in neuronal dendrites. Cell 148:309 –321. CrossRef Medline Dong C, Upadhya SC, Ding L, Smith TK, Hegde AN (2008) Proteasome inhibition enhances the induction and impairs the maintenance of latephase long-term potentiation. Learn Mem 15:335–347. CrossRef Medline Ehlers MD (2003) Activity level controls postsynaptic composition and signaling via the ubiquitin-proteasome system. Nat Neurosci 6:231–242. CrossRef Medline Elias GM, Elias LA, Apostolides PF, Kriegstein AR, Nicoll RA (2008) Differential trafficking of AMPA and NMDA receptors by SAP102 and PSD-95 underlies synapse development. Proc Natl Acad Sci U S A 105:20953– 20958. CrossRef Medline Ethell IM, Pasquale EB (2005) Molecular mechanisms of dendritic spine development and remodeling. Prog Neurobiol 75:161–205. CrossRef Medline Fallon L, Be´langer CM, Corera AT, Kontogiannea M, Regan-Klapisz E, Moreau F, Voortman J, Haber M, Rouleau G, Thorarinsdottir T, Brice A, van Bergen En Henegouwen PM, Fon EA (2006) A regulated interaction with the UIM protein Eps15 implicates parkin in EGF receptor trafficking and PI(3)K-Akt signalling. Nat Cell Biol 8:834 – 842. CrossRef Medline Fortin DA, Davare MA, Srivastava T, Brady JD, Nygaard S, Derkach VA, Soderling TR (2010) Long-term potentiation-dependent spine enlargement requires synaptic Ca 2⫹-permeable AMPA receptors recruited by CaM-kinase I. J Neurosci 30:11565–11575. CrossRef Medline Foster KA, McLaughlin N, Edbauer D, Phillips M, Bolton A, ConstantinePaton M, Sheng M (2010) Distinct roles of NR2A and NR2B cytoplasmic tails in long-term potentiation. J Neurosci 30:2676 –2685. CrossRef Medline Gardoni F, Bellone C, Cattabeni F, Di Luca M (2001) Protein kinase C activation modulates alpha-calmodulin kinase II binding to NR2A subunit of N-methyl-D-aspartate receptor complex. J Biol Chem 276:7609 –7613. CrossRef Medline Gardoni F, Mauceri D, Fiorentini C, Bellone C, Missale C, Cattabeni F, Di Luca M (2003) CaMKII-dependent phosphorylation regulates SAP97/ NR2A interaction. J Biol Chem 278:44745– 44752. CrossRef Medline Gladding CM, Sepers MD, Xu J, Zhang LY, Milnerwood AJ, Lombroso PJ,
Atkin et al. • Loss of Fbxo2 Disrupts NMDARs and Synaptic Connectivity Raymond LA (2012) Calpain and STriatal-Enriched protein tyrosine phosphatase (STEP) activation contribute to extrasynaptic NMDA receptor localization in a Huntington’s disease mouse model. Hum Mol Genet 21:3739 –3752. CrossRef Medline Glenn KA, Nelson RF, Wen HM, Mallinger AJ, Paulson HL (2008) Diversity in tissue expression, substrate binding, and SCF complex formation for a lectin family of ubiquitin ligases. J Biol Chem 283:12717–12729. CrossRef Medline Gong B, Chen F, Pan Y, Arrieta-Cruz I, Yoshida Y, Haroutunian V, Pasinetti GM (2010) SCFFbx2–E3-ligase-mediated degradation of BACE1 attenuates Alzheimer’s disease amyloidosis and improves synaptic function. Aging Cell 9:1018 –1031. CrossRef Medline Gray JA, Shi Y, Usui H, During MJ, Sakimura K, Nicoll RA (2011) Distinct modes of AMPA receptor suppression at developing synapses by GluN2A and GluN2B: single-cell NMDA receptor subunit deletion in vivo. Neuron 71:1085–1101. CrossRef Medline Guermonprez P, Saveanu L, Kleijmeer M, Davoust J, Van Endert P, Amigorena S (2003) ER-phagosome fusion defines an MHC class I crosspresentation compartment in dendritic cells. Nature 425:397– 402. CrossRef Medline Hall RA, Soderling TR (1997) Quantitation of AMPA receptor surface expression in cultured hippocampal neurons. Neuroscience 78:361–371. CrossRef Medline Hanus C, Ehlers MD (2008) Secretory outposts for the local processing of membrane cargo in neuronal dendrites. Traffic 9:1437–1445. CrossRef Medline Hardingham GE (2009) Coupling of the NMDA receptor to neuroprotective and neurodestructive events. Biochem Soc Trans 37:1147–1160. CrossRef Medline Hardingham GE, Bading H (2010) Synaptic versus extrasynaptic NMDA receptor signalling: implications for neurodegenerative disorders. Nat Rev Neurosci 11:682– 696. CrossRef Medline Helenius A, Aebi M (2004) Roles of N-linked glycans in the endoplasmic reticulum. Annu Rev Biochem 73:1019 –1049. CrossRef Medline Helmeke C, Ovtscharoff W Jr, Poeggel G, Braun K (2001) Juvenile emotional experience alters synaptic inputs on pyramidal neurons in the anterior cingulate cortex. Cereb Cortex 11:717–727. CrossRef Medline Horak M, Chang K, Wenthold RJ (2008) Masking of the endoplasmic reticulum retention signals during assembly of the NMDA receptor. J Neurosci 28:3500 –3509. CrossRef Medline Houde M, Bertholet S, Gagnon E, Brunet S, Goyette G, Laplante A, Princiotta MF, Thibault P, Sacks D, Desjardins M (2003) Phagosomes are competent organelles for antigen cross-presentation. Nature 425:402– 406. CrossRef Medline Huang F, Zeng X, Kim W, Balasubramani M, Fortian A, Gygi SP, Yates NA, Sorkin A (2013) Lysine 63-linked polyubiquitination is required for EGF receptor degradation. Proc Natl Acad Sci U S A 110:15722–15727. CrossRef Medline Huang YY, Kandel ER (2007) 5-Hydroxytryptamine induces a protein kinase A/mitogen-activated protein kinase-mediated and macromolecular synthesis-dependent late phase of long-term potentiation in the amygdala. J Neurosci 27:3111–3119. CrossRef Medline Huber KM, Kayser MS, Bear MF (2000) Role for rapid dendritic protein synthesis in hippocampal mGluR-dependent long-term depression. Science 288:1254 –1257. CrossRef Medline Huh KH, Wenthold RJ (1999) Turnover analysis of glutamate receptors identifies a rapidly degraded pool of the N-methyl-D-aspartate receptor subunit, NR1, in cultured cerebellar granule cells. J Biol Chem 274:151– 157. CrossRef Medline Iliff AJ, Renoux AJ, Krans A, Usdin K, Sutton MA, Todd PK (2013) Impaired activity-dependent FMRP translation and enhanced mGluRdependent LTD in Fragile X premutation mice. Hum Mol Genet 22: 1180 –1192. CrossRef Medline Jeyifous O, Waites CL, Specht CG, Fujisawa S, Schubert M, Lin EI, Marshall J, Aoki C, de Silva T, Montgomery JM, Garner CC, Green WN (2009) SAP97 and CASK mediate sorting of NMDA receptors through a previously unknown secretory pathway. Nat Neurosci 12:1011–1019. CrossRef Medline Jones TA, Klintsova AY, Kilman VL, Sirevaag AM, Greenough WT (1997) Induction of multiple synapses by experience in the visual cortex of adult rats. Neurobiol Learn Mem 68:13–20. CrossRef Medline Jurd R, Thornton C, Wang J, Luong K, Phamluong K, Kharazia V, Gibb SL,
J. Neurosci., April 15, 2015 • 35(15):6165– 6178 • 6177 Ron D (2008) Mind bomb-2 is an E3 ligase that ubiquitinates the N-methyl-D-aspartate receptor NR2B subunit in a phosphorylationdependent manner. J Biol Chem 283:301–310. CrossRef Medline Kato A, Rouach N, Nicoll RA, Bredt DS (2005) Activity-dependent NMDA receptor degradation mediated by retrotranslocation and ubiquitination. Proc Natl Acad Sci U S A 102:5600 –5605. CrossRef Medline Kim BG, Dai HN, McAtee M, Vicini S, Bregman BS (2007) Labeling of dendritic spines with the carbocyanine dye DiI for confocal microscopic imaging in lightly fixed cortical slices. J Neurosci Methods 162:237–243. CrossRef Medline Kirov SA, Sorra KE, Harris KM (1999) Slices have more synapses than perfusion-fixed hippocampus from both young and mature rats. J Neurosci 19:2876 –2886. Medline Knott GW, Holtmaat A, Wilbrecht L, Welker E, Svoboda K (2006) Spine growth precedes synapse formation in the adult neocortex in vivo. Nat Neurosci 9:1117–1124. CrossRef Medline Kwon HB, Sabatini BL (2011) Glutamate induces de novo growth of functional spines in developing cortex. Nature 474:100 –104. CrossRef Medline Lai HC, Jan LY (2006) The distribution and targeting of neuronal voltagegated ion channels. Nat Rev Neurosci 7:548 –562. CrossRef Medline Lee I, Kesner RP (2002) Differential contribution of NMDA receptors in hippocampal subregions to spatial working memory. Nat Neurosci 5:162–168. CrossRef Medline Lin Y, Jover-Mengual T, Wong J, Bennett MV, Zukin RS (2006) PSD-95 and PKC converge in regulating NMDA receptor trafficking and gating. Proc Natl Acad Sci U S A 103:19902–19907. CrossRef Medline Lussier MP, Nasu-Nishimura Y, Roche KW (2011) Activity-dependent ubiquitination of the AMPA receptor subunit GluA2. J Neurosci 31:3077– 3081. CrossRef Medline Megías M, Emri Z, Freund TF, Gulya´s AI (2001) Total number and distribution of inhibitory and excitatory synapses on hippocampal CA1 pyramidal cells. Neuroscience 102:527–540. CrossRef Medline Meier J, Vannier C, Serge´ A, Triller A, Choquet D (2001) Fast and reversible trapping of surface glycine receptors by gephyrin. Nat Neurosci 4:253– 260. CrossRef Medline Monyer H, Sprengel R, Schoepfer R, Herb A, Higuchi M, Lomeli H, Burnashev N, Sakmann B, Seeburg PH (1992) Heteromeric NMDA receptors: molecular and functional distinction of subtypes. Science 256:1217–1221. CrossRef Medline Morris RG, Anderson E, Lynch GS, Baudry M (1986) Selective impairment of learning and blockade of long-term potentiation by an N-methyl-Daspartate receptor antagonist, AP5. Nature 319:774 –776. CrossRef Medline Nelson RF, Glenn KA, Miller VM, Wen H, Paulson HL (2006) A novel route for F-box protein-mediated ubiquitination links CHIP to glycoprotein quality control. J Biol Chem 281:20242–20251. CrossRef Medline Nelson RF, Glenn KA, Zhang Y, Wen H, Knutson T, Gouvion CM, Robinson BK, Zhou Z, Yang B, Smith RJ, Paulson HL (2007) Selective cochlear degeneration in mice lacking the F-box protein, Fbx2, a glycoproteinspecific ubiquitin ligase subunit. J Neurosci 27:5163–5171. CrossRef Medline Newpher TM, Ehlers MD (2008) Glutamate receptor dynamics in dendritic microdomains. Neuron 58:472– 497. CrossRef Medline Nikolakopoulou AM, Davies HA, Stewart MG (2006) Passive avoidance training decreases synapse density in the hippocampus of the domestic chick. Eur J Neurosci 23:1054 –1062. CrossRef Medline Nikonenko I, Jourdain P, Alberi S, Toni N, Muller D (2002) Activityinduced changes of spine morphology. Hippocampus 12:585–591. CrossRef Medline Parnas D, Linial M (1998) Highly sensitive ELISA-based assay for quantifying protein levels in neuronal cultures. Brain Res Brain Res Protoc 2:333– 338. CrossRef Medline Parsons CG, Sto¨ffler A, Danysz W (2007) Memantine: a NMDA receptor antagonist that improves memory by restoration of homeostasis in the glutamatergic system–too little activation is bad, too much is even worse. Neuropharmacology 53:699 –723. CrossRef Medline Petralia RS, Al-Hallaq RA, Wenthold RJ (2009) Trafficking and targeting of NMDA receptors. In: Biology of the NMDA receptor (Van Dongen AM, ed). Boca Raton, FL: CRC. Petrini EM, Lu J, Cognet L, Lounis B, Ehlers MD, Choquet D (2009) Endocytic trafficking and recycling maintain a pool of mobile surface AMPA
6178 • J. Neurosci., April 15, 2015 • 35(15):6165– 6178 receptors required for synaptic potentiation. Neuron 63:92–105. CrossRef Medline Pollak TA, McCormack R, Peakman M, Nicholson TR, David AS (2014) Prevalence of anti-N-methyl-d-aspartate (NMDA) antibodies in patients with schizophrenia and related psychoses: a systematic review and metaanalysis. Psychol Med 44:2475–2487. CrossRef Medline Rinaldi T, Kulangara K, Antoniello K, Markram H (2007) Elevated NMDA receptor levels and enhanced postsynaptic long-term potentiation induced by prenatal exposure to valproic acid. Proc Natl Acad Sci U S A 104:13501–13506. CrossRef Medline Rowland LM, Astur RS, Jung RE, Bustillo JR, Lauriello J, Yeo RA (2005) Selective cognitive impairments associated with NMDA receptor blockade in humans. Neuropsychopharmacology 30:633– 639. CrossRef Medline Segev I, Rall W (1988) Computational study of an excitable dendritic spine. J Neurophysiol 60:499 –523. Medline Skeberdis VA, Chevaleyre V, Lau CG, Goldberg JH, Pettit DL, Suadicani SO, Lin Y, Bennett MV, Yuste R, Castillo PE, Zukin RS (2006) Protein kinase A regulates calcium permeability of NMDA receptors. Nat Neurosci 9:501–510. CrossRef Medline Sutton MA, Wall NR, Aakalu GN, Schuman EM (2004) Regulation of dendritic protein synthesis by miniature synaptic events. Science 304:1979 – 1983. CrossRef Medline Swanger SA, Yao X, Gross C, Bassell GJ (2011) Automated 4D analysis of dendritic spine morphology: applications to stimulus-induced spine re-
Atkin et al. • Loss of Fbxo2 Disrupts NMDARs and Synaptic Connectivity modeling and pharmacological rescue in a disease model. Mol Brain 4:38. CrossRef Medline Tang YP, Shimizu E, Dube GR, Rampon C, Kerchner GA, Zhuo M, Liu G, Tsien JZ (1999) Genetic enhancement of learning and memory in mice. Nature 401:63– 69. CrossRef Medline Thomas-Crusells J, Vieira A, Saarma M, Rivera C (2003) A novel method for monitoring surface membrane trafficking on hippocampal acute slice preparation. J Neurosci Methods 125:159 –166. CrossRef Medline Tovar KR, Westbrook GL (2002) Mobile NMDA receptors at hippocampal synapses. Neuron 34:255–264. CrossRef Medline Tyan SH, Shih AY, Walsh JJ, Maruyama H, Sarsoza F, Ku L, Eggert S, Hof PR, Koo EH, Dickstein DL (2012) Amyloid precursor protein (APP) regulates synaptic structure and function. Mol Cell Neurosci 51:43–52. CrossRef Medline Ultanir SK, Kim JE, Hall BJ, Deerinck T, Ellisman M, Ghosh A (2007) Regulation of spine morphology and spine density by NMDA receptor signaling in vivo. Proc Natl Acad Sci U S A 104:19553–19558. CrossRef Medline Yoshida Y, Chiba T, Tokunaga F, Kawasaki H, Iwai K, Suzuki T, Ito Y, Matsuoka K, Yoshida M, Tanaka K, Tai T (2002) E3 ubiquitin ligase that recognizes sugar chains. Nature 418:438 – 442. CrossRef Medline Zha XM, Green SH, Dailey ME (2005) Regulation of hippocampal synapse remodeling by epileptiform activity. Mol Cell Neurosci 29:494 –506. CrossRef Medline