The U.S. Government assumes no liability for the contents or use thereof. ... The effects of shading from bridging on primary and secondary production of tidal ..... Carolina State University using Statistical Analysis Software (SAS Institute, 1985). An ... Unlike other bridges sampled, the marsh Under the New River Bridge was.
Final Report Effects of Shading from Bridges on Estuarine Wetlands
Prepared By S.W. Broome, C.B. Craft, S.D. Struck, M. SanClements
North Carolina State University College of Agriculture & Life Sciences Department of Soil Science 3214 Williams Hall Campus Box 7619 Raleigh, NC 27695-7619
June 2005
1.
Report No. FHWA/NC/2003-07
2.
Government Accession No.
Technical Report Documentation Page 3. Recipient’s Catalog No.
4. Title and Subtitle Effects of Shading from Bridges on Estuarine Wetlands
5.
Report Date June 2005
6.
Performing Organization Code Performing Organization Report No.
7.
Author(s) S.W. Broome, C.B. Craft, S.D. Struck, and M. SanClements
8.
9.
Performing Organization Name and Address North Carolina State University College of Agriculture & Life Sciences Department of Soil Science 3214 Williams Hall Campus Box 7619 Raleigh, NC 27695-7619
10. Work Unit No. (TRAIS)
11. Contract or Grant No.
12. Sponsoring Agency Name and Address U.S. Department of Transportation Research and Special Programs Administration 400 7th Street, SW Washington, DC 20590-0001
13. Type of Report and Period Covered Final Report July 1, 2000 – June 30, 2003 14. Sponsoring Agency Code 2001-12
15. Supplementary Notes: This project was supported by a grant from the U.S. Department of Transportation and the North Carolina Department of Transportation, through the Center for Transportation and the Environment, NC State University. 16. Abstract Salt and brackish water marshes are integral parts of the coastal ecosystem, performing important nutrient cycling and hydrologic functions as well as providing habitat and breeding grounds for many coastal species. As human populations in coastal areas increase so does the need for an improved and more extensive infrastructure including bridging across estuaries and marshes when building roads. Very little research has been conducted to quantify the effects of shading on marsh function and productivity, and to determine the amount of mitigation that should be required to offset these effects. The objectives of this research were to determine the effects of bridge height and width on marsh productivity and function by directly assessing light attenuation under bridges, determining the effects of shading on the dominant salt marsh species and comparing benthic invertebrate communities beneath seven highway bridges with marshes outside of bridge-affected areas (reference marshes). Photosynthetically available light was measured. Plant samples were clipped, dried and weighed to determine aboveground biomass, average stem height, number of stems, number of flowers and basal area. Soil cores were taken to a depth of 30cm to determine soil C and N and below-ground biomass. Both bridge height and width heavily influenced the degree to which shading by bridges affected the underlying vegetation. All plant variables measured showed a strong bridge effect at HW ratios less than 0.5 and light attenuation less than 250 umol m-2s-1 under of the bridges. At a HW ratio of 0.68 bridge effects were still detected although it was greatly diminished. Of thirty-two comparisons between areas under and outside the influence of bridges having HW ratios greater than 0.7, only four significant differences were detected. Regression analysis showed a clear correlation between secondary productivity and bridge HW ratio, (r2=.95). Low bridges, with HW ratio < 0.7 and light attenuation < 260 mol m-2 s-1 (photosynthetic photon flux units), had benthic invertebrate densities and diversity that were significantly lower than reference marshes. Density of benthic invertebrates at low bridges was 25-52% (29,685-72,920 organisms/m2) of densities measured in adjacent reference marshes (119,329-173,351 organisms/m2). Likewise, there were fewer taxa under low bridges (5.8 / 11.35 cm2 core) as compared to the reference marshes (9.0 / 11.35 cm2 core). Density of numerically dominant taxa (oligochaetes, nematodes) as well as surface- and subsurface deposit feeders also were reduced by shading of low bridges. Decreased invertebrate density and diversity beneath low bridges was attributed to diminished above- and below-ground macrophyte biomass that presumably resulted in fewer food resources and available refuges from predators. Data indicates that shading by bridges having HW ratios greater than 0.7 do not adversely impact the productivity or function of the underlying marsh and may not require compensatory mitigation. 17. Key Words marshes, wetlands, estuaries 19. Security Classif. (of this report) Unclassified Form DOT F 1700.7 (8-72)
18. Distribution Statement 20. Security Classif. (of this page) Unclassified
21. No. of Pages 66
22. Price
Reproduction of completed page authorized
i
ACKNOWLEDGMENTS Support for this project was provided by the U.S. Department of Transportation and the North Carolina Department of Transportation through the Center for Transportation and the Environment, NC State University.
DISCLAIMER The contents of this report reflect the views of the authors, who are responsible for the facts and the accuracy of the data presented herein. This document is disseminated under the sponsorship of the U.S. Department of Transportation and the North Carolina Department of Transportation in the interest of information exchange. This report does not constitute a standard, specification, or regulation. The U.S. Government assumes no liability for the contents or use thereof.
ii
Summary The effects of shading from bridging on primary and secondary production of tidal marshes were assessed by comparing plant growth, soil C and N, benthic invertebrates and light under seven bridges with adjacent reference marshes in North Carolina. Results indicated that each of these indicators was negatively impacted under three bridges with heights less than nine meters, and height/width ratios less than 0.7. There was no vegetation growing beneath the bridge that was the lowest (5.9 m) and widest (20.8 m) and it was the only bridge with significantly reduced soil carbon and nitrogen. Invertebrate density, taxa richness, dominant taxa (oligochaetes, nematodes and Capitella sp.), and trophic feeding groups were negatively affected by bridges with a height/width ratio less than 0.7. Neither plant growth nor invertebrates were significantly affected under the four bridges that had height/width ratios greater than 0.7. Results suggest that low bridges adversely affect estuarine marsh productivity by reducing macrophyte growth and soil organic carbon, which in turn reduces density and diversity of benthic invertebrates. Bridges with height/width ratio greater than 0.7, did not have a measurable effect on primary and secondary productivity. This suggests that mitigation for shading effects from high, narrow bridges is not warranted. With attention to bridge design, shading effects can be minimized.
iii
TABLE OF CONTENTS I. Bridge Shading Effects On Vegetation Introduction..............................................................................................................1 Objectives .................................................................................................................6 Materials and Methods ............................................................................................6 Vegetation Sample .................................................................………………8 Soil Samples.........................................................................………………..9 Light Measurements.............................................................………………..9 Seedling Growth Experiment...............................................………………10 Statistical Analysis ...............................................................………………11 Results and Discussions .........................................................................................11 Bridge Characteristics..........................................................………………11 Shading Impacts Under Bridges...........................................………………13 Light Data.............................................................................………………13 Plant Growth Measurements ........................................................................ 17 Soil Carbon And Nitrogen............................................................................ 31 Bridge Height/Width Ratio ..................................................……………....32 Summary.................................................................................................................33 Conclusions .............................................................................................................36
II. Bridge Shading Effects On Benthic Invertebrates Introduction............................................................................................................37 Research Methods ..................................................................................................40 Site Description....................................................................………………40 Field And Analytical Methods .............................................………………41 Results and Discussion...........................................................................................45 Shading Impacts On Benthic Invertebrates..........................………………45 Predictive Relationship Between Bridge Height And Benthic Invertebrates .......................................................………………53 Conclusions .............................................................................................................57
References...............................................................................................................58
iv
I. BRIDGE SHADING EFFECTS ON VEGETATION INTRODUCTION Wetlands are valuable natural resources providing a number of important ecological functions. Wetlands store organic carbon and are sinks for inorganic nutrients such as nitrogen and phosphorus. High primary productivity and rich organic soils make wetlands important contributors to the estuarine food web. Estuarine wetlands act as nurseries for many species essential to commercial fisheries, and many rare and endangered species of flora and fauna are also found in or adjacent to wetland habitat. In addition to providing habitat, wetlands also perform a number of critical hydrologic functions. Wetlands act as sponges or flood control devices by storing water during large storm events and improve water quality by filtering out pollutants and trapping sediments. Despite the many benefits of wetlands they continue to face degradation by many factors both human and natural. Loss of wetland areas has been recognized as a problem for many years resulting in laws allowing for no net loss of these areas. Human populations continue to increase in coastal areas creating demand for further residential and industrial development. With increasing populations comes a need for improved infrastructure in the coastal region, resulting in construction projects in and near estuarine wetlands. In such cases the agency responsible for construction is required to mitigate to compensate for the effected wetlands. Of particular interest is the construction of bridges spanning estuarine wetlands. Presently, mitigation is required to alleviate the effects of shading from bridges spanning these areas; however, mitigation is expensive and increases construction costs. Little research has been conducted to quantify the effects of shading by bridges on marsh function and productivity. These effects must be quantified to understand how bridge height and
1
width affect shading and underlying marsh vegetation. Should the effects of shading be minimal then mitigation requirements can be reduced, in turn reducing construction costs. Light is one of the primary factors limiting growth and reproduction of vegetation (Smith 1996). Photosynthesis provides green plants with nearly all of their chemical energy and is therefore central to their ability to persist and reproduce. Photosynthesis is directly correlated with the amount of photosynthetically available radiation (PAR) at any given site until the saturation point is reached. Specifically photosynthesis is directly influenced by the amount of light striking the leaves of a particular plant. High levels of photosynthesis are not only important to the plants themselves but the ecosystem as a whole. Drake and Read (1981) found that carbon assimilated by photosynthesis has three possible pathways within the ecosystem. Carbon can be returned to the atmosphere through respiratory processes, accumulated in sediments, or exported out of the system as secondary production in the biomass of consumers. Each of these pathways returns energy to the system and is vital to its health. Studies of emergent marsh vegetation indicate that it is light limited during the growing season (Drake 1984, Drake and Read 1981). Thus, it can be expected that decreases in PAR may result in lower returns of energy to marsh systems therefore disrupting both marsh productivity and function. Two different pathways of photosynthesis occur in nature under different light and moisture regimes (Mitsch and Gosselink 1993). These two pathways are the C3 and C4 pathways. Both of these pathways occur in coastal vegetation and are separated by gradients of varying light, salinity and temperature (Drake 1989). Plants using the C3 pathway are adapted to moderate light and temperature levels and include most of the tree and shrub species. Plants with the C3 pathway dominate the temperate regions of the world (Teeri and Stowe 1976). Plants using the C4 pathway are better adapted to high light intensity, hot temperatures and low
2
moisture (Teeri and Stowe 1976). Most C4 plants occur in deserts or in the form of grasses. Many estuarine wetlands are dominated by vegetation that uses the C4 pathway of photosynthesis (Drake 1989). High light intensity, hot summer temperatures and the water limiting osmotic effect of high salinity make wetlands suitable habitat for C4 plants. Very high correlations exist between PAR, restricted water availability, high salinity, minimum average July daily temperature and the spatial distribution of C3 and C4 plants across the landscape (Teeri and Stowe 1976). These correlations result in a distribution where the dominance of C4 plants increases with salinity towards the coast (Teeri and Stowe 1976). Due to their adaptive differences it can be hypothesized that C3 and C4 plants will respond differently to decreases in PAR due to the placement of man made structures. The dominant C4 species in southeastern coastal marshes is Spartina alterniflora, which possesses adaptations that allow it to compete very well in regions of physiological drought such as estuarine wetlands (Drake 1989). Specifically, Spartina alterniflora has the ability to photosynthesize at high light intensities and salt concentrations while using minimal fresh water (Giergevich and Dunn 1978, 1979). At the same time much research shows that C4 plants experience greater reductions in growth in environments with reduced light intensity. Mitsch and Gosselink (1993) found that in C4 plants the rate of photosynthesis increases in a linear manner with respect to increases in light, thus C4 plants rarely become light saturated even in extreme conditions. Several studies have also shown that high light intensity is needed to maintain maximum levels of photosynthesis by C4 plants (Longstreth and Strain 1977). This ability to increase photosynthesis up to very high levels of light is efficient in climates such as the southeastern United States where sunshine is abundant. However, this also suggests that at
3
decreased levels of PAR, C4 plants are likely to suffer relatively greater decreases in photosynthesis and net primary production than C3 plants. Many studies have been conducted to quantify reductions in photosynthesis and productivity associated with varying levels of illumination and soil nutrients. Longstreth and Strain (1977) collected numerous samples of Spartina alterniflora from North Carolina marshes and performed controlled growth experiments in which different nutrient and illumination treatments were applied. Growth at low illumination and high salinity resulted in a fifty percent decrease in growth compared to the control. Furthermore, plants grown at high salinity and high illumination showed significant increases in specific leaf weight and photosynthesis. Salinity treatments were increased until nearly equal with open ocean water and still no reduction was found as long as illumination was maintained at sufficiently high levels. Thus it was concluded that salinity has little effect on photosynthesis and would rarely if ever be a limiting factor in Spartina alterniflora growth (Longstreth and Strain 1977). Light intensity interacts with factors other than salinity to regulate plant growth and productivity. Several studies have been conducted to evaluate the importance of nitrogen availability on the photosynthetic capabilities of C4 plants such as Spartina alterniflora. Salt marsh ecosystems in general have been found to be nitrogen limited (Mendelssohn et al. 1982). Results of studies concerning photosynthetic capacity of Spartina alterniflora have shown a drastic decrease in photosynthesis under low nitrogen, low illumination conditions. Under low illumination high nitrogen conditions photosynthesis decreased less rapidly (Drake 1989). These studies suggest that in low nitrogen environments such as coastal salt marshes human induced shading by a bridge or other structure could significantly reduce photosynthesis and net primary production.
4
Plants using the C3 pathway may act differently under conditions of reduced light. Although not as common in estuarine wetlands as C4 plants, C3 plants do play an important role on the composition of less saline brackish water marshes. These plants possess adaptations allowing them to flourish in temperate regions with moderate levels of sunlight and moderate temperature regimes. The water limiting effect of high salinity confines C3 plants such as Juncus roemarianus to the less saline portions of coastal estuaries (Drake 1984). Differences in light and salinity tolerance led to questions regarding varied response to decreased light availability in C3 plants, which exhibit increasing photosynthesis with increasing light intensity up to the point of light saturation at approximately ¼ to ½ full sunlight suggesting that C3 plants are adapted to lower light levels than C4 plants and are less likely to suffer from decreased solar radiation (Mitsch and Gosselink 1993). Currently, little data exists pertaining to the effects of bridge height, orientation and width on the shading of underlying emergent marsh vegetation. Information regarding height, width and orientation of boat docks with respect to submerged aquatic vegetation does exist. Walker et al. (1989) found that direct damage to sea grass beds by boat docks was minimal. However, the health of habitat under and adjacent to boat docks was compromised and more susceptible to damage. Studies conducted on Zostera Marina L. (eelgrass) beds under boat docks revealed that dock height above marine bottom, dock width, and dock orientation were influential factors in determining bed quality. Loflin (1995) and Burdick and Short (1999) found dock layout to be most influential and its significance is attributed to light levels and shading effects controlled by dock height and width. Recommendations have been made for the building of taller, narrower docks whenever possible (Loflin 1995, Burdick and Short 1999). A minimum
5
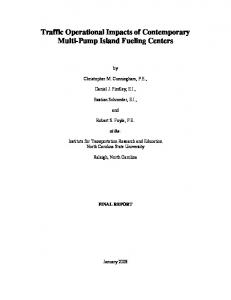
dock height of three meters above the marine bottom oriented in a north-south direction was recommended as the best possible dock design. OBJECTIVES The overall objective of the research project was to determine the effects of shading from bridges, which span salt or brackish-water marshes, on ecosystem structure and function. Specific objectives were to: 1. Evaluate the effects of height and width of bridges on marsh productivity and function of emergent vegetation, soils, and benthic invertebrates. 2. Directly assess light attenuation by bridges using sensors to measure photosynthetic photon flux density under and near the bridges. 3. Compare the relative effects of shading on growth of the dominant species of salt marshes, Spartina alterniflora (a C4 plant), with the growth of the dominant species in brackish marshes Juncus roemerianus (a C3 plant). MATERIALS AND METHODS Seven bridges (Figure 1, Table 1) spanning either salt or brackish water marshes in eastern North Carolina were selected for sampling to determine their effects on marsh productivity. These sites provided opportunities to assess the effects of shading from bridges of various heights and widths on several types of marsh vegetation. Each marsh was sampled twice, once in October of 2000 and again in October 2001.
6
Figure 1. Locations of study sites for bridge shading effects.
Table 1. Bridge study sites with heights and widths of bridges at sampling transects. Site
Plant species
Wrightsville Beach New River Low
Spartina alterniflora Spartina alterniflora Spartina cynosuroides Juncus roemerianus Spartina alterniflora Spartina alterniflora Spartina alterniflora Spartina alterniflora Juncus roemerianus Juncus roemerianus Spartina patens
New Bern Salter’s Creek New River High Ocean Isle Bogue Inlet Cedar Island Low Cedar Island Medium Low Cedar Island Medium High Cedar Island High
Height (m) 5.85
Width (m) 20.82
HW Ratio 0.28
Age (years) 44
Salinity (ppt) 32
Orientation 125o E-SE
7.32
10.73
0.68
7
4
176 o S-SE
8.53
16.71
0.51
24.2
3
112 o E-SE
11.58
10.70
1.08
18
22
125 o E-SE
14.63
10.73
1.36
7
4
176 o S-SE
15.24
9.85
1.55
16
39
167 o E-SE
19.81
11.13
1.78
19
34
168 o S-SE
3.21
9.94
0.32
5
20
39 o N-NE
4.98
9.94
0.50
5
20
39 o N-NE
6.15
9.94
0.62
5
20
39 o N-NE
15.52
9.94
1.56
5
20
39 o N-NE
7
Sampling was conducted to compare productivity under and outside the influence of the bridges (Figure 2). A perpendicular line running from the center of the bridge to points outside the
Figure 2. Sampling design used for sampling of vegetation and soils data during years 2000 and 2001.
shading influence of the bridges was established at each study location. Sampling quadrats were randomly selected on either side of the transect so that areas under and outside the influence of the bridge were sampled. When possible, samples were taken in unaffected areas on both sides of the bridges. However, at most locations it was only feasible to sample a non-shaded area on one side due to the presence of waterways or beaches. Vegetation Samples Vegetation samples were taken at the end of the 2000 and 2001 growing seasons. Sampling transects were located along a line running perpendicular to the bridge from the center
8
outwards. Specific sampling plots were located along this line at points under and outside the influence of the bridges. At each sampling point a 0.25 sq. meter quadrat was placed on the marsh surface, all vegetative growth occurring within the plot was clipped. The number of stems, number of flowering stems, and basal area were recorded. Harvested vegetation was placed in a bag, labeled and returned to the laboratory, dried at 70° C in a forced air oven and weighed. Belowground biomass measurements were taken from within the 0.25 sq meter plots after they were clipped. A soil corer 8.5 cm in diameter and 30 cm deep was used for obtaining samples. Each core was divided into two sections, 0-10 cm and 10-30 cm, returned to the laboratory and washed through a 2mm sieve. The root mass remaining on the sieve was bagged, air dried at 70° C in a forced air oven and weighed. Soil Samples A soil core 8.5 cm in diameter and 30 cm deep was taken from each quadrat for use in soil nutrient analysis. Each core was further divided into a 0-10 cm and 10-30 cm section, returned to the laboratory and sieved through a 2mm sieve. Samples were air dried before being sent to the Department of Soil Science Service Laboratory for Carbon and Nitrogen analysis using a CHN analyzer. Light Measurements Light Measurements were conducted at locations under and outside the influence of the shadow of each bridge. Measurements were taken along the same transects used for vegetation and soil sampling using hand held Apogee quantum meters. Apogee quantum meters measure radiation between 400 and 700 nanometers, which are the most important wavelengths for plant growth. Readings were taken simultaneously under and outside the bridges influence to assure
9
an accurate comparison of solar radiation at each location. Three readings were taken at each measuring point at time intervals of one minute. All light data was collected during July of 2002 at or as close as possible to full sunlight. Seedling Growth Experiment A seedling growth experiment was conducted at the Cedar Island bridge location to assess the effects of varying levels of shading on dominant marsh vegetation types. The species selected for study were Spartina alterniflora, Spartina cynosuroides and Juncus roemerienus. Prior to planting at the bridge seedlings were transplanted to two-gallon pots containing a uniform mixture composed of 1/3 sand, topsoil and a standard potting medium. All pots were fertilized with an equal amount of Osmocote (14-14-14) fertilizer, and seedlings were grown for two weeks in a greenhouse prior to planting in the field. Planting occurred at nine sections of the Cedar Island Bridge, ranging in height from 2.91 to 15.46 meters (Table 2). Three randomized blocks of seedlings were planted at each of the nine sections chosen. One block was located under the center of the bridge, a second under the edge of the bridge, and a third in the natural marsh outside the shadow of the bridge. Each block contained three pots of seedlings of each species for a total of nine pots per block. Table 2. Height and Height Width (HW) Ratios for Cedar Island Bridge sections planted (2002).
Height (m) 3.03 4.14 4.72 5.96 6.63 9.34 11.57 13.38 15.46
HW Ratio 0.3 0.41 0.47 0.59 0.66 0.93 1.16 1.34 1.55
10
Pots were buried flush with the existing marsh surface. Planting occurred during May of 2002, all vegetative growth was harvested during October of 2002 at the completion of one growing season. Upon harvesting each plant was clipped and bagged, number of stems and height of the tallest stem was recorded. All samples were air dried at 70° C in a forced air oven and weighed. Statistical Analysis All data was analyzed under the supervision of the statistics department at North Carolina State University using Statistical Analysis Software (SAS Institute, 1985). An alpha level of 0.05 to indicate significance was chosen for all statistical analysis. Analysis of variance was computed using the following formula: Yijklm =U+Hj+Lj+(H*L)ij+(L*B)jk(i)+Tl+(T*H)il+(T*B)lk(i)+(T*L)jl+(T*L*H)ijl+(T*L*B)jlk( i)+Eijklm .
Where: T=year, H=height or width, L=location, B=bridge, U=mean of
population, E=random error in Y, Yijklm denotes the jth response for treatment i etc. Comparisons were made to determine significance in differences between data collected under and outside the influence of the bridges. Data from each year was examined independently and then pooled and examined. Analysis was conducted using ttests along with the General Linear Model slice option to divide data into categories of low and high bridges. A height of nine meters was chosen to separate “high” and “low” bridges. RESULTS AND DISCUSSION
Bridge Characteristics Bridges at seven locations were used for sampling of plants and soils in October of 2000 and 2001. Vegetation at each bridge was sampled once at a particular bridge
11
height at the conclusion of each growing season. A low and high transect was sampled each year at New River (Table 1).
Bridges range in height from 5.85 meters to 19.81 meters and in width from 9.85 meters to 20.82 meters (Table 1). Bridges were placed into height categories, either low or high (Table 1). Bridges < 9 meters in height were labeled low, and bridges > 9 meters were grouped into the high category. The low category consists of the bridges located at Wrightsville Beach, New River (low transect), and New Bern. The high category includes bridges located at Salter Creek, New River (high transect), Ocean Isle and Bogue Inlet. Bridge age was also determined for each location (Table 1). Bridges ranged in age from 5 to 44 years (NCDOT). Bridge orientations and the salinity of the marsh water were also recorded at every location (Table 1). The Cedar Island site was sampled once in 2001 at 4 heights for plant and soil variables. The seedling transplant experiment was also located at the Cedar Island site. (All Cedar Island data is presented in the Appendix). Unlike other bridges sampled, the marsh Under the New River Bridge was severely disturbed during construction resulting in a change of vegetation from that in the surrounding natural marsh. During construction the area directly under and to the west of the New River Bridge was dredged and refilled with sand. Currently, the area disturbed during construction is occupied by Spartina alterniflora while the surrounding natural marsh is dominated by Juncus roemerianus. The change in soils and vegetation may be responsible in explaining some irregularities in belowground biomass data collected at the New River site. It is also important to note that all sampling was conducted within the area dominated by Spartina alterniflora.
12
A height-width ratio (HW ratio) was also calculated for each bridge transect sampled. The HW ratio was calculated by dividing bridge height by bridge width. The HW ratio combines the effects of both height and width into one number. Arranging bridges by increasing or decreasing HW ratios explains patterns in the data from New Bern and New River that are less clear when viewed against height alone. Shading Impacts Under Bridges Unless stated otherwise the data being discussed within the text and figures is the mean data for the growing seasons of 2000 and 2001. Statistical analysis showed that year of sampling was not significant in determining patterns within the data. In the few cases where the year was significant, the data is discussed separately and the data for each year is presented along with the mean data for the two years. Light Data Light was sampled at the seven bridges along transects where plant and soil samples were taken. Apogee quantum sensors were used to measure photsynthetically available light under and outside the influence of the bridges during July 2002. Table 3 shows light measurements collected under and outside the influence of the bridges in µmol m-2s-1, this data is shown as a percentage of the control in Figure 3.
13
Table 3. Light data collected on July 21 and 22 of 2002. Photosynthetic photon flux (PPF) was measured using Apogee Quantum sensors. Measurements were in µmol m -2 s-1.
Site (Time)
Avg. PPF µmol m -2 s -1 Outside (n=3,5) 1907
Avg. PPF µmol m -2 s -1 Under (n=3,5) 36
1:30-1:40 NR Low
1294
250
19
7.32
11:55-12:15 New Bern
1904
202
11.43
8.54
2:05-2:15 Salter C.
2000
364
18
11.59
N/A NR High
1543
1037
67
14.33
11:55-12:15 Ocean I.
1929
1816
94
15.24
3:15-3:20 Bogue I.
1658
1639
98
19.82
Wrightville Beach
Percent of Control 1.9
Bridge Height (m) 5.85
10:15-10:20
14
Figure 3. Representation of light data collected under bridges during July 2000 as percentage of sunlight outside the influence of the bridge. Means at each located based on n=5 measurements.
Figure 4 depicts aboveground biomass (gm-2) and photosynthetic photon flux (PPF)(umol m-2s-1) measurements from under the bridges as a percentage of the control. Wrightsville Beach Bridge has a HW ratio of 0.28, the smallest HW ratio of all bridges sampled. Average PPF in the reference marsh at the time of sampling was 1907 umol m-2s-1, while the PPF measured at marshes located under the bridge averaged 36.25 umol m-2s-1 (Table 3). The PPF under the bridges at Wrightsville Beach was not adequate for vegetative growth (Figure 4). With a HW ratio of 0.51 New Bern was the next lowest and widest bridge. Average PPF outside the bridge was 1904 umol m-2s-1, PPF under the bridge averaged 217 umol m-2s-1 (Table 3, Figure 4). Reduced light levels reduced vegetative growth under the bridge to less than 50% of that occurring outside the bridges influence (Figure 4).
As bridge HW ratio increases above 0.68 light as a percentage of the control
15
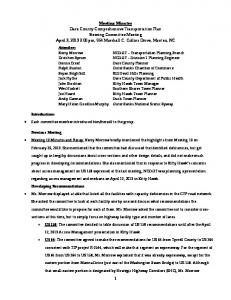
Figure 4. Comparison of ambient light and mean above-ground biomass represented as a percentage of the control at each bridge. Bridges are in order of increasing HW ratios. Asterisks indicate significant differences in biomass between areas under and outside influence of bridges at p 0.70) and 49% less aboveground biomass than the natural reference marshes. Likewise, belowground biomass was 51% to 61% less under low HW ratio bridges when compared to high HW ratio bridges and reference marshes, respectively (Table 8).
47
Under Bridge Reference Marsh
2
Mean Invertebrate Density (1000 organisms/m )
250
200
* *
150
* 100 52%
38%
50
25%
0 Wrightsville Beach
New Bern
New River Low
Salter's Creek
New River High
Ocean Isle
Bogue Inlet
16
Under Bridge Reference Marsh
*
2
Species Richness (# of Taxa / 11.35cm core )
18
14 12
* 10 8
*
54% 77%
6
52%
4 2 0 HW Ratio
Wrightsville Beach
New Bern
New River Low
Salter's Creek
New River High
Ocean Isle
Bogue Inlet
0.28
0.51
0.68
1.08
1.36
1.55
1.78
Figure 23. Composition of benthic invertebrate density and taxa richness under bridges (n = 10 for all sites except Wrightsville Beach and Bogue Inlet where n = 6; mean ± 1 standard error) of varying HW with natural reference areas outside of bridges (n = 10 for all sites except Bogue Inlet where n = 12; mean ± 1 standard error). Values with an asterisk indicate significantly (p