16th Korea-Japan Joint Workshop on Frontiers of Computer Vision
O7-1
Finding Defects in Regular-Texture Images Ilkoo Ahn and Changick Kim† Korea Advanced Institute of Science and Technology (KAIST),
[email protected],
[email protected]† Abstract In this paper, we propose a novel and fast algorithm that can detect defects on images with repeated patterns. This task is done through saliency detection by using spectral residual, which is based on Fourier Transform. In detail, the difference between the original signal and a smooth one in the log amplitude spectrum is calculated, and the saliency map is then obtained by transforming the difference to spatial domain. Unlike prior works, which have been developed to detect a specific form of defect, the proposed method works well for various different detection tasks. Experimental results show the robustness and efficiency of the proposed system and they are also compared with existing methods.
1
Introduction
Traditionally, defect detection in production lines has been conducted by highly skilled and trained human inspectors. However, inspection by human workers must be a tedious job and the workers are limited in their ability to perform objective, consistent and high speed inspection. Therefore, it requires a cost effective and efficiently automated way. The automated inspection systems have been developed in many industrial fields, such as fabric [1]-[5], chemical film [6][7], wood [8], carpet [9], and steel roll [10] inspection for decades. Briefly, these inspection techniques can be broadly classified in terms of texture: regularly patterned texture and irregular texture. This paper is focused on defect detection on images with regularly patterned textures. To detect defects from images with regularly patterned texture, many approaches have been developed throughout the years using neural networks [11], Fourier transform [12], discrete cosine transform [6], Gabor filters [5][7][13], wavelet transform [1]-[4], and so on [14]. However, these methods need high computational cost and are mainly material-dependant, like only for fabric or chemical film, etc. For example, fabric inspection using wavelet is used for only fabric even though wavelet is helpful to other materials. In this paper, a defect detection algorithm is proposed which can be applied to images with repeated pattern or no pattern(plain) using a saliency based scheme. Through continual breakthroughs in vision research, spectral domain approach named spectral residual (SR) [15] is proposed recently. This paper
adopts this SR scheme to detect defects. Defective regions hanging over repeated patterns can correspond to saliency regions in images with repeated pattern. Even if the test image has no pattern, the plain image can be considered to have a repeated unit plain pattern. The main contribution of this paper is that a saliency based detection method can be applied for any test images with repeated patterns regardless of materials such as fabric, chemical, and so on. Moreover, this proposed scheme does not require preprocessing. The rest of this paper is organized as follows: Section 2 introduces how saliency detection method can be linked with defect detection and defect detection using spectral residual(SR) is discussed in detail. To evaluate the performance, Section 3 shows our experimental results comparing with existing works. Conclusions and observations based on this work are outlined in Section 4.
2 2.1
Saliency detection scheme Detecting Defect Regions
Recently, Hou et al. [15] proposed the new approaches for saliency region using analysis of amplitude spectrum. In this section, we briefly introduce the method which requires only one parameter and show how it is applied to defect detection. Saliency analysis with spectral residual is based on the assumption that a naturally captured images consist of the novelty part and the redundant information [15] as follows.
478
16th Korea-Japan Joint Workshop on Frontiers of Computer Vision
O7-1
3
I(Image) = I(N ovelty) + I(Redundant) Redundant information corresponds to worthless information and novelty part corresponds to the valuable information. The repeated pattern corresponds to redundant while defects do to novel part. Defect detection can be summarized as follows. Given an image I(x), A(f ) = < (F (I(x)))
(1)
P (f ) = = (F (I(x)))
(2)
L(f ) = log (A(f ))
(3)
R(f ) = L(f ) − hn (f ) ∗ L(f )
(4)
EM (x) = g(x) ∗ kF −1 [eR(f )+i·P (f ) ]k2
(5)
−1
where F and F denote the Fourier transform and inverse Fourier transform, respectively. A and P denote the amplitude and phase spectrum of the image. Log spectrum can be obtained by L(f ) = log (A(f )). hn (f ) is local average filter to smooth the shape of A(f ). Redundant information I(Redundant) is simply simulated using this local average filter [15] as follows. 1 1 ... 1 hn (f ) = 2 1 1 . . . , n .. .. . . . . .
Experimental Results
The proposed system has been tested in software using MATLAB (version 7). All test images used in the evaluations are resized to a some sizes in gray level scale. The proposed method using SR has been evaluated on the defect detection of various defect images: plain chemical films, PDP mesh films, LCD films, fabric images with various repeated patterns, surface images from various materials. The overall precision and recall are 98.8 and 94.3 respectively. We compare our experimental results with other existing works to show the robustness of this algorithms as shown in Fig.1, Fig.2, and Fig.3.
4
Conclusion
We have presented a simple and effective defect detection algorithm which can be applied to images with repeated pattern or no pattern(plain) using a saliency based scheme. Inspection scheme using saliency detection of spectral residual for any materials of repeated pattern or no pattern materials. Robustness of our method was verified through experiments with various patterns and just some of them are shown. Further work needs to be done in achieving robustness of our algorithm to no repeated patterns. where n is set to three in this paper. The specIn this case, it needs more complicated scheme for tral residual of the image corresponding novelty various patterns. part can be computed by subtracting the averaged amplitude spectrum part corresponding redundant part from log amplitude spectrum of the input imReferences age as (4). g(x) is a 2D Gaussian filter. This is a computationally efficient and reliable [1] X. Yang, G. Pang and N. Yung, “Robust fabric defect detection and classification using multiple mathematical model for defect images as well as adaptive wavelets,”IEE Proceedings Vision, Image natural images. 2.2
and Signal Processing, vol.152, Issue: 6, pp.715723, 2005.
Defect Map
From the EnergyM ap(EM ), we use simple threshold segmentation to detect defect regions like as follows. ½ 1, EM (x) ≥ T DM (x) (6) 0, otherwise where T = E (EM (x)) × α, E() is average operation and α is dependent on the property of repeated patterns of test images. The four directional margins are excepted in calculating the E(EM (x)) since the SR has noise near the image boundaries. The threshold is a trade-off problem. The scale selection of this paper varies pattern by pattern to reflect the property of each pattern. Scale selection affects results and it should be optimized according to the property of its pattern.
479
[2] Xuezhi Yang, Grantham “Discriminative training fect classification based Pattern Recognition, vol.
Pang, and Nelson Yung, approaches to fabric deon wavelet transform,” 37(5), pp. 889-899, 2004.
[3] H. Y. T. Ngan, G. K. H. Pang, S. P.Yung, and M. K. Ng, “Wavelet based methods on patterned fabric defect detection,” Pattern Recognit., vol. 38, no. 4, pp. 559-576, 2005. [4] Yang Xue Zhi, Grantham K. H. Pang and Nelson H. C. Yung, “Fabric defect detection using adaptive wavelet,” IEEE International Conference on Acoustics, Speech, and Signal Processing, (ICASSP ’01), vol.6, pp.3697-3700, 2001. [5] Ajay Kumar and Grantham K. H. Pang, “Defect detection in textured materials using Gabor filters,” IEEE Transactions on Industry Applications, vol. 38(2), pp.425-440, 2002.
O7-1
16th Korea-Japan Joint Workshop on Frontiers of Computer Vision
[6] L. C. Chen and C. C. Kuo, “Automatic TFTLCD mura defect inspection using discrete cosine transform-based background filtering andjust noticeable difference quantification strategies,” Meas. Sci. Technol., vol. 19, pp. 1-10, 2008. [7] N. Ogata, S. Fukuma, H. Nishikado, A. Shirosaki, S. Takagi, T. Sakurai, “An accurate inspection of PDP-mesh cloth using Gabor filter,” Proceedings of 2005 International Symposium on Intelligent Signal Processing and Communication Systems, ISPACS, pp.65- 68, 2005. [8] G.A. Ruz, P.A. Estevez, and C.A. Perez, “A Neurofuzzy Color Image Segmentation Method for Wood Surface Defect Detection,” Forest Products Journal, vol. 55, N 4, pp. 52-58, 2005. [9] L. Siew, R. M. Hodgson, and E. J. Wood, “Texture measures for carpet wear assessment,” IEEE Trans. Pattern Anal. Machine Intell., vol. 10, pp. 92-105, Jan. 1988. [10] J. Laitinen, “Image quality in automated visual web inspection,” Proc. SPIE, vol. 3029, pp. 78-89, Apr. 1997.
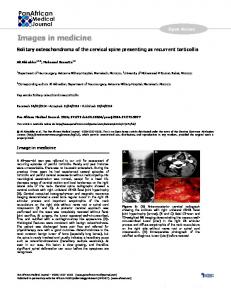
Fig. 1: The comparison of defect detection results(image source from [14]). First column: original images. Second column: EM in (5). Third column: the results of [14]. Fourth column: the result of proposed algorithm. The original size of test image is about 310×310. All images are resized to 64×64 and α is 3.0, 3.9, and 2.5 respectively
[11] I. S. Tsai, C. H. Lin, and J. J. Lin, “Applying an artificial neural network to pattern recognition in fabric defects,” Textile Res. J., vol. 65, no. 3, pp. 123-130, 1995. [12] C. H. Chan and G. K. H. Pang, “Fabric defect detection by Fourier analysis,” IEEE Trans. Ind. Applicat., vol. 36, no. 5, pp. 1267-1276, Sep./Oct. 2000. [13] D. M. Tsai and S. K. Wu, “Automated surface inspection using Gabor filters,” Int. J. Adv. Manufact. Technol., vol. 16, pp. 474-482, 2000. [14] H. Y. T. Ngan, and G. K. H. Pang, “Regularity Analysis for Patterned Texture Inspection,” IEEE Transactions on Automation Science and Engineering, vol.6, Issue:1, pp.131-144, 2009. [15] X. Hou, L. Zhang, “Saliency Detection: A Spectral Residual Approach,” IEEE Conference on Computer Vision and Pattern Recognition(CVPR), pp. 1-8, 2007.
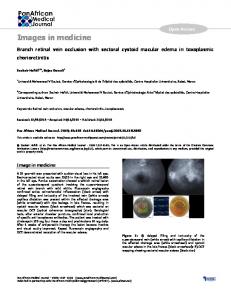
Fig. 2: The comparison of defect inspection results. First column: original images. Second column: EM in (5). Third column: the results of [13]. Fourth column: the result of proposed algorithm. The original size of test image is about 330×300. First three images are no resized and fourth to 128×128 and α is 8.5, 3.5, 3, and 3 respectively
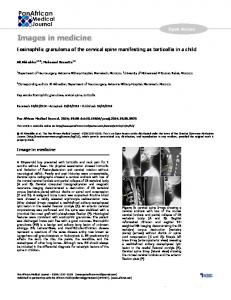
Ilkoo Ahn: is currently pursuing his ph.D course in the dept. of Electrical Engineering, Korea Advanced Institute of Science and Technology(KAIST), Daejeon, Korea. Changick Kim: is an associate professor in the dept. of Electrical Engineering, Korea Advanced Institute of Science and Technology(KAIST), Daejeon, Korea. Fig. 3: The results of mesh film inspection. First column: original images. Second column: EM in (5). Third column: the result of proposed algorithm. Small images below each test image is enlargement of defect areas. The size of original test image is 512×512. No resize needs and α is 4
480