Nov 13, 2009 - Those values support the network administrator in the process of selecting a target. 2. assign a cost value automatically to all ambients ...
FINDING MULTI-STEP ATTACKS IN COMPUTER NETWORKS USING HEURISTIC SEARCH AND MOBILE AMBIENTS
Virginia Nunes Leal Franqueira
Ph.D. dissertation committee: Chairman and Secretary Prof. dr. ir. A. J. Mouthaan Promotor Prof. dr. R. J. Wieringa Assistant promotor Dr. P. A. T. van Eck Members Prof. dr. Frances M. T. Brazier Prof. dr. Pieter H. Hartel Prof. dr. Sandro Etalle Dr. Siv Hilde Houmb Dr. Jurjen Bos
University of Twente, the Netherlands University of Twente, the Netherlands University of Twente, the Netherlands Delft University of Technology, the Netherlands University of Twente, the Netherlands University of Twente, the Netherlands Telenor, Norway Equens SE, the Netherlands
CTIT Ph.D. Thesis Series No. 09-154 Centre for Telematics and Information Technology P.O. Box 217, 7500 AE Enschede, the Netherlands SIKS Dissertation Series No. 2009-43 The research reported in this thesis has been carried out under the auspices of SIKS, the Dutch Research School for Information and Knowledge Systems. The research reported in this thesis has been supported by the research program (www.sentinels.nl) of the Technology Foundation STW, under the contract No. 06679. Typeset with LATEX. Printed and bound by Ipskamp Drukkers B.V. Cover design by the author. Cover images from http://www.dreamstime.com (photographer Sergey Llin). ISSN: 1381-3617 ISBN: 978-90-365-2923-5 http://dx.doi.org/10.3990/1.9789036529235 c 2009, Virginia Nunes Leal Franqueira, Enschede, The Netherlands. Copyright All rights reserved. No part of this book may be reproduced or transmitted in any form or by any means, electronic or mechanical, including photography, recording, or any information storage and retrieval system, without prior written permission of the author.
FINDING MULTI-STEP ATTACKS IN COMPUTER NETWORKS USING HEURISTIC SEARCH AND MOBILE AMBIENTS
DISSERTATION
to obtain the degree of doctor at the University of Twente, on the authority of the rector magnificus, prof. dr. H. Brinksma, on account of the decision of the graduation committee, to be publicly defended on Friday 13 November, 2009 at 15.00
by Virginia Nunes Leal Franqueira
born on October 2, 1963 in Santos, state of S˜ao Paulo, Brazil
This dissertation has been approved by: Prof. dr. R. J. Wieringa (promotor) Dr. P. A. T. van Eck (assistant promotor)
Summary An important aspect of IT security governance is the proactive and continuous identification of possible attacks in computer networks. This is complicated due to the complexity and size of networks, and due to the fact that usually network attacks are performed in several steps. This thesis proposes an approach called MsAMS (Multi-step Attack Modelling an Simulation), demonstrated by a proof-of-concept tool, to automatically find such multi-step attacks. The novelty of MsAMS is the fact that it applies Mobile Ambients and Combinatorial Optimization, more specifically Heuristic Search, to the domain of multi-step network attacks. A variant of ambient calculus is used to model networks, and heuristic search is used to simulate attackers searching for possible attacks in the modelled network. Additionally, and in support to these two aspects, MsAMS uses algorithms from the domain of Link Analysis Ranking, traditionally applied to the domain of Web search. Mobile Ambients allow us to fully represent the hierarchical topology of a network as part of the network model itself. This is essential to relate insights gained from the model to the real network. Furthermore, we can represent dynamics of attacks such as credential theft, what increases the spectrum of possibilities available for attackers since it allows considering non-vulnerable as well as vulnerable hosts as attack steps. Optimization allows managing the complexity of the problem of finding multistep attacks involving credentials without compromising the scalability of the approach for practical use. Therefore, the MsAMS approach comprises: (i) a formal representation of the solution which allows its automatic computation, in our case, the representation of an attack step in a notation based on Mobile Ambients, (ii) a search engine which implements a heuristic method for composing attack steps into multi-step attacks, and (iii) fitness functions used by the search engine for the selection of attack steps among alternatives, according to automatically computed metrics. Similar to search engines that use the structure of the World Wide Web to score webpages, the MsAMS approach proposes the use of the structure of a network to score network assets. In particular, MsAMS uses PageRank and HITS ranking schemes as sources of scalable metrics to: 1. assign asset value automatically to all ambients represented in the network, based on network connectivity rather than on financial value, providing an absolute and comparable view of asset value. Those values support the network administrator in the process of selecting a target. 2. assign a cost value automatically to all ambients represented in the network, also based on network connectivity rather than on financial value, providing an absolute and comparable view of cost for attack steps. Such a measure of cost allows the incorporation of rationality to the ambient-attacker which simulates a strategy of a real-attacker.
v
Samenvatting Een belangrijk aspect van de besturing van IT-beveiliging is de pro-actieve en continue identificatie van mogelijke aanvallen op computernetwerken. Dit is gecompliceerd vanwege de complexiteit en omvang van dergelijke netwerken, en als gevolg van het feit dat netwerkaanvallen gewoonlijk worden uitgevoerd in meerdere stappen. Dit proefschrift stelt een aanpak voor genaamd MsAMS (Multi-stap Attack Modelleren een Simulatie), gedemonstreerd met een proofof-concept tool om dergelijke meerstapsaanvallen automatisch te vinden. Het orginele aspect van MsAMS is het feit dat het mobile ambients en combinatorische optimizatie, meer specifiek heuristisch zoeken, toepast in het domein van meerstaps-netwerkaanvallen. Een variant van ambient calculus wordt gebruikt om netwerken te modelleren, en heuristische zoeken wordt gebruikt om aanvallers te simuleren die zoeken naar mogelijke aanvallen in het gemodelleerde netwerk. Daarnaast en ter ondersteuning van deze twee aspecten gebruikt MsAMS algoritmen uit het domein van link analyse ranking, die traditioneel toegepast worden in het domein van zoekmachines voor het Web. Mobiele ambients stellen ons in staat om de hi¨erarchische topologie van een netwerk volledig te representeren als onderdeel van het netwerkmodel zelf. Dit is essentieel om inzichten uit het model te relateren aan het echte netwerk. Bovendien kunnen wij dynamiek van aanvallen representeren, zoals diefstal van credentials, wat het spectrum van mogelijkheden verhoogt voor aanvallers omdat op deze manier zowel niet-kwetsbare als kwetsbare hosts als aanvalsstappen overwogen kunnen worden. Optimalisatie voorziet in beheersing van de complexiteit van het probleem van het vinden van meerstapsaanvallen met credentials zonder schaalbaarheid van de aanpak voor praktisch gebruik tekort te doen. Daarom bestaat de MsAMSaanpak uit: (i) een formele representatie van de oplossing, zodanig dat automatische berekening van de oplossing mogelijk is: in ons geval de representatie van een aanvalsstap in een notatie gebaseerd op Mobile ambients, (ii) een zoekmachine die een heuristische methode implementeert voor het samenstellen van meerstaps-aanvallen uit aanvalsstappen, en (iii) fitness-functies die de zoekmachine gebruikt voor de selectie van de aanvalsstappen uit alternatieven, volgens automatisch berekende metrieken. Net zoals bij zoekmachines die gebruik maken van de structuur van het World Wide Web om webpagina’s te scoren, stelt de MsAMS-aanpak voor om gebruik te maken van de structuur van het netwerk om netwerk-assets te scoren. In het bijzonder maakt MsAMS gebruik van PageRank en het HITS ranking scheme als bronnen van schaalbare metrieken voor: 1. automatische toewijzing van asset-waardes aan alle ambients in het netwerk, gebaseerd op netwerkconnectiviteit en niet op financi¨ele waarde, die voorzien in een absoluut en vergelijkbaar overzicht van asset-waarde. Deze waarden ondersteunen de netwerkbeheerder in het proces van het kiezen van een aanvalsdoel. vii
2. automatische toewijzen van kosten aan alle ambients in het netwerk, ook gebaseerd op netwerkconnectiviteit in plaats van op financi¨ele waarde. Hiermee wordt voorzien in een absoluut en vergelijkbaar overzicht van de kosten van de aanvalsstappen. Een dergelijke inschatting van de kosten maakt het mogelijk om rationaliteit in acht te nemen van de ambient-aanvaller die een strategie van een werkelijke aanvaller simuleert.
viii
Preface It has been a long, but enriching, marathon (using Roel’s words) that concretely started when I left both husband and daughter behind and landed in Enschede, completely alone, on a rainy day, in the summer 2005. My first thoughts are for them; you were the most affected by my decision but were unconditionally there for me, even if only virtually! Without your love, faith and “push” I would never have reached this stage. But, on the other side of the Atlantic, I had a good surprise! I encountered many great people that contributed positively in one way or another with my PhD journey. I want to express my gratitude to them here. First, I want to thank Roel Wieringa. More than a promotor, he has always been an “enthusiastic” supporter of my research throughout the marathon. His support even intensified towards the end of the race, when he kept encouraging me with contagious optimism, and numerous thorough feedbacks (even while on holiday); they were really essential. Thank you! Second, I want to thank Pascal van Eck. He also played an important role during my PhD providing “daily” support, tips and guidance not only about work-related matters, but also about everyday life in the Netherlands. Pascal has welcomed me from the very first interview, always open-minded for any type of discussion. Thank you for teaching me the “arts of the craft”. Third, I want to thank Peter Hobson for accepting me as a visiting researcher at Brunel University in the summer 2006. But, specially, I want to thank Raul Lopes for a collaboration that lasted much longer than my stay in London. This collaboration involved not only endless discussions about ELAS and MsAMS, but also his programming expertise with functional languages; it represented a turning point in my research. Thank you so much! Moreover, I want to take the opportunity to thank all the members of my committee for donating their time to read my long manuscript. Particularly, I want to thank Jurjen Bos for his careful examination of the text, and constructive comments to improve the final version of this book. I also want to thank Siv Houmb for really insightful feedbacks. Thank you. Next, I want to explicitly thank Chen Li for the time and energy consumed with discussions about a chapter that never ended in this book (!!!), and Maurice van Keulen for his collaboration on the NVD investigation. Thank you. Further, I want to thank Roberto Santana. Life in the Netherlands would have been much harder without the support of Roberto, who became a dear friend. I miss already our conversations in the train from Deventer to Hengelo... He represented my connection with the Dutch world although sharing a real understanding of my background. Cheers! Still, I want to thank Ben Elsinga for many interesting pointers at the beginning of my research, and Manfred Reichert for numerous exchanges of ideas related to work, or not, during the period he spent with us at the IS group. I also want to thank many more people I was lucky to find on my way: Jelena Marincic, Wouter Kuijper, Xiaomeng Su, Zlatko Zlatev, among others. Their ix
friendship filled gaps of an absolutely lonely period and made me feel “at home” in the Netherlands. Not to mention Suse Engbers, Ida den Hamer, and Elvira Dijkhuis who had always true interest in helping on whatever needed. Thank you all. Finally, I want to thank determined women that are extraordinary examples for me: Angela, Maria de Lourdes, Beth, Rosa and, of course, Amanda! But I also want to thank some amazing men: Silvio, Mauricio, and Cardoso. Love you! Last, but not least, well... I want to thank Amanda just for being who she is: strong minded and dedicated but optimistic and funny (!), and for the fantastic moments we spent together in our “nomadic life” across Brazil, England, and the Netherlands. Kisses and hugs!
Virginia Hilversum, October 2009
x
The following song was very much part of my PhD. I dedicate it “back” to the one who shares my unusual journeys, accommodates my crazy changes in plan (or even my complete lack of a plan!), copes with my intrinsic dark side but, still, never gave up on me...
Everything I Own You sheltered me from harm, kept me warm, kept me warm. You gave my life to me, set me free, set me free. The finest years I ever knew, were all the years I had with you. I would give anything I own, give up my life, my heart, my home. I would give everything I own, just to have you back again. You taught me how to love, what its of, what its of. You never said too much, but still you showed the way, and I knew from watching you. Nobody else could ever know, the part of me that can’t let go. I would give anything I own, give up my life, my heart, my home. I would give everything I own, just to have you back again. Is there someone you know, you’re loving them so, but taking them all for granted? You may lose them one day, someone takes them away, and they don’t hear the words you long to say. I would give anything I own, give up my life, my heart, my home. I would give everything I own, just to have you back again. Lyrics by David Gates (Preferred performance by Rod Stewart!)
Contents
I
Motivation and Research Context
1 Introduction 1.1 Background . . . . . . . . . . . . . . . 1.2 Research Scope and Goal . . . . . . . 1.2.1 Non-objectives . . . . . . . . . 1.3 Research questions . . . . . . . . . . . 1.4 Thesis outline . . . . . . . . . . . . . . 1.5 Contributions . . . . . . . . . . . . . . 1.5.1 About the MsAMS Solution . . 1.5.2 Cross Analysis of Contributions
1 . . . . . . . .
. . . . . . . .
3 . 4 . 7 . 8 . 8 . 9 . 11 . 11 . 11
2 Background and Related Work 2.1 Security Terms . . . . . . . . . . . . . . . . . . . . . . . . . . . 2.2 Related work . . . . . . . . . . . . . . . . . . . . . . . . . . . . 2.2.1 Penetration Testing . . . . . . . . . . . . . . . . . . . . 2.2.2 Attack Trees . . . . . . . . . . . . . . . . . . . . . . . . 2.2.3 Attack Graphs . . . . . . . . . . . . . . . . . . . . . . . 2.2.3.1 State Enumeration-based Attack Graphs . . . 2.2.3.2 Exploit-based Attack Graphs . . . . . . . . . . 2.2.3.3 Addressing Visual Attack Graphs Complexity 2.2.3.4 Optimization Perspective of Attack Graphs . . 2.2.3.5 What-if Analysis in Attack Graphs . . . . . . 2.2.3.6 Credentials in Attack Graphs . . . . . . . . . . 2.2.4 Overlap between IDS/IPS and Attack Graphs . . . . . . 2.3 Summary . . . . . . . . . . . . . . . . . . . . . . . . . . . . . .
. . . . . . . . . . . . .
. . . . . . . . . . . . .
15 15 21 21 23 27 28 29 31 34 36 36 38 40
3 Understanding Network Attacks 3.1 Computer Networks . . . . . . . . . . . . . . . . . . . . . . . 3.2 Network Attacks . . . . . . . . . . . . . . . . . . . . . . . . . 3.2.1 Single-step Attacks . . . . . . . . . . . . . . . . . . . . 3.2.2 Multi-step Attacks . . . . . . . . . . . . . . . . . . . . 3.2.2.1 Definition and Purpose of Multi-step Attacks 3.2.2.2 Main types of Single-steps . . . . . . . . . . 3.3 Attackers Strategies and Types of Multi-step Attack . . . . . 3.3.1 Classes of Attackers . . . . . . . . . . . . . . . . . . . 3.3.2 Attacker Strategy: Best Cost-benefit from an Attack 3.3.2.1 Server-side and Client-side Attacks . . . . . 3.3.3 Attacker Strategy: Best Coverage of a Network . . . 3.3.3.1 Botnet Attacks . . . . . . . . . . . . . . . . 3.3.3.2 Distributed Denial of Services Attacks . . . 3.4 Economics of Network Multi-step Attacks . . . . . . . . . . .
. . . . . . . . . . . . . .
. . . . . . . . . . . . . .
43 43 47 47 49 50 51 55 56 56 57 57 58 60 61
. . . . . . . .
. . . . . . . .
. . . . . . . .
. . . . . . . .
. . . . . . . .
. . . . . . . .
. . . . . . . .
. . . . . . . .
. . . . . . . .
. . . . . . . .
. . . . . . . .
. . . . . . . .
. . . . . . . .
. . . . . . . . . . . . .
xiii
CONTENTS 4 Solution Requirements 4.1 Gaps Analysis . . . . . . . . . . . . . . . . . . . . . . . . . . . . . 4.2 Requirements for the Solution . . . . . . . . . . . . . . . . . . . . . 4.3 Solution Direction . . . . . . . . . . . . . . . . . . . . . . . . . . .
67 67 70 73
II
75
Proposed Solution
Background on Heuristic Search . . . . . . . . . . . . . . . . . . . . 77 Why Using Heuristic Search? . . . . . . . . . . . . . . . . . . . . . 78 5 Gaining Insights about Vulnerabilities from the NVD 5.1 Motivation for Empirical Investigation of NVD . . . . . . . . . . 5.2 NIST Initiatives towards Standardized and Measurable Information Security . . . . . . . . . . . . . . . . . . . . . . . . . . . . . 5.3 Data Set and Analysis Approach . . . . . . . . . . . . . . . . . . 5.4 Analysis of Single NVD Attributes . . . . . . . . . . . . . . . . . 5.5 Analysis of Relationships between NVD Attributes . . . . . . . . 5.6 Evaluation: from Access-to-Effect toward Access-to-Impact . . . . . . . . . . 5.7 Classification of Vulnerabilities by Impact on Defender . . . . .
79 . 79 . . . .
82 85 89 92
. 98 . 101
6 Finding Network Attacks as an Optimization Problem 6.1 ELAS: Evolutionary Learning of Attack Scenarios . . . . 6.2 Our Evolutionary Approach . . . . . . . . . . . . . . . . . 6.2.1 Cost and Value Metrics . . . . . . . . . . . . . . . 6.2.2 Solution Representation . . . . . . . . . . . . . . . 6.2.3 Edition Operations . . . . . . . . . . . . . . . . . . 6.2.4 The Evolutionary Algorithm . . . . . . . . . . . . 6.3 Motivating Example: Denial of Services by E-mail Worm 6.3.1 Representation of the DoS Attack . . . . . . . . . 6.3.2 Running ELAS to Find the DoS Attack . . . . . . 6.4 Summary . . . . . . . . . . . . . . . . . . . . . . . . . . .
. . . . . . . . . .
. . . . . . . . . .
. . . . . . . . . .
. . . . . . . . . .
. . . . . . . . . .
103 104 105 106 107 110 111 113 113 114 116
7 The MsAMS Solution: Multi-step Attack Modelling and Simulation 7.1 Proposed Solution . . . . . . . . . . . . . . . . . . . . 7.1.1 Comparison between ELAS and MsAMS . . . . 7.2 Running Example . . . . . . . . . . . . . . . . . . . . 7.3 Modelling a Network . . . . . . . . . . . . . . . . . . . 7.4 Overview of MsAMS . . . . . . . . . . . . . . . . . . . 7.5 Method followed by MsAMS . . . . . . . . . . . . . . . 7.6 Modelling with MsAMS . . . . . . . . . . . . . . . . . 7.7 Simulation of Attackers . . . . . . . . . . . . . . . . . 7.8 Processing Virtual Links . . . . . . . . . . . . . . . . . 7.9 Computing Ranks using the Matrix of Network Links
. . . . . . . . . .
. . . . . . . . . .
. . . . . . . . . .
. . . . . . . . . .
. . . . . . . . . .
119 120 121 122 123 123 124 125 134 139 140
xiv
. . . . . . . . . .
. . . . . . . . . .
CONTENTS
7.10
7.11 7.12
7.13
III
7.9.1 Notions of Inlink, Outlink & Importance in Ambients 7.9.2 Ranking Scheme from PageRank . . . . . . . . . . . . 7.9.3 Ranking Scheme from HITS . . . . . . . . . . . . . . . Further Modelling . . . . . . . . . . . . . . . . . . . . . . . . 7.10.1 Modelling Vulnerabilities, Services and Protocols . . . 7.10.1.1 Vulnerabilities . . . . . . . . . . . . . . . . . 7.10.1.2 Services and Protocols . . . . . . . . . . . . . 7.10.2 Modelling Credentials . . . . . . . . . . . . . . . . . . Search for Attacks . . . . . . . . . . . . . . . . . . . . . . . . Summary . . . . . . . . . . . . . . . . . . . . . . . . . . . . . 7.12.1 Network topology . . . . . . . . . . . . . . . . . . . . 7.12.2 Fully connected subnets . . . . . . . . . . . . . . . . . 7.12.3 Reachability . . . . . . . . . . . . . . . . . . . . . . . . 7.12.4 Access Control . . . . . . . . . . . . . . . . . . . . . . 7.12.5 Attackers and Legitimate Users . . . . . . . . . . . . . 7.12.6 Attackers’ Target & Asset Values . . . . . . . . . . . . Related Work . . . . . . . . . . . . . . . . . . . . . . . . . . . 7.13.1 Mobile Ambients . . . . . . . . . . . . . . . . . . . . . 7.13.2 Link Analysis Ranking . . . . . . . . . . . . . . . . . .
Solution Validation
. . . . . . . . . . . . . . . . . . .
. . . . . . . . . . . . . . . . . . .
. . . . . . . . . . . . . . . . . . .
141 143 145 148 148 148 152 153 158 164 165 165 166 166 166 167 167 167 169
173
Methodology . . . . . . . . . . . . . . . . . . . . . . . . . . . . . . 175 8 Testing the MsAMS Approach 177 8.1 Reuse of Ambients Specification . . . . . . . . . . . . . . . . . . . . 178 8.2 Computing Grid Network Example . . . . . . . . . . . . . . . . . . 180 8.2.1 Specification of the Computing Grid Network Example . . 182 8.2.2 Blocking Firewall Outbound Traffic . . . . . . . . . . . . . 188 8.3 Power Grid Network Example . . . . . . . . . . . . . . . . . . . . . 188 8.3.1 Baseline Specification of the Power Grid Network Example 191 8.3.2 Version One: Adding Credentials . . . . . . . . . . . . . . . 198 8.3.3 Version Two: Hypothesizing about a Vulnerable Workstation202 8.3.4 Version Three: Adding Kerberos Authentication to the Data Historian Server . . . . . . . . . . . . . . . . . . . . . 204 8.3.4.1 Kerberos Authentication . . . . . . . . . . . . . . 204 8.3.4.2 Modelling the Interface with Kerberos . . . . . . . 205 8.3.5 Version Four: Adding Kerberos Authentication to the Citrix Server . . . . . . . . . . . . . . . . . . . . . . . . . . . . 208 8.4 Summary . . . . . . . . . . . . . . . . . . . . . . . . . . . . . . . . 209 8.A Chapter Appendix: Complete Specifications . . . . . . . . . . . . . 211 8.B Chapter Appendix: PageRank and HITS Scores . . . . . . . . . . . 219 xv
CONTENTS 9 Scalability of the MsAMS Approach 225 9.1 Overview of the MsAMS Tool . . . . . . . . . . . . . . . . . . . . . 225 9.2 Scalability of the MsAMS Tool . . . . . . . . . . . . . . . . . . . . 227 9.2.1 Time Performance with Increasing Number of Ambients . . 227 9.2.1.1 Evaluation . . . . . . . . . . . . . . . . . . . . . . 230 9.2.2 Time Performance with Increasing Number of Firewall Rules233 9.2.2.1 Evaluation . . . . . . . . . . . . . . . . . . . . . . 234 9.2.3 Space Performance with Increasing Number of Ambients . 235 9.2.3.1 Evaluation . . . . . . . . . . . . . . . . . . . . . . 237 9.3 Summary of Scalability Results . . . . . . . . . . . . . . . . . . . . 239
IV
Final Remarks
10 Conclusion 10.1 Discussion . . . . . . . . . . . . . . . . 10.2 Opportunities for Future Work . . . . 10.2.1 Further Academic Research . . 10.2.2 Further Industrial Development
241 . . . .
. . . .
. . . .
. . . .
. . . .
. . . .
. . . .
. . . .
. . . .
. . . .
. . . .
. . . .
. . . .
. . . .
. . . .
. . . .
Appendices A Formalization of the MsAMS Approach A.1 Preliminary Concepts . . . . . . . . . . . . . . . . . . . . . . . A.2 The MsAMS Reduction Rules . . . . . . . . . . . . . . . . . . . A.2.1 Reduction which handles ambients movement . . . . . A.2.2 Reduction which handles ambients communication . . . A.2.3 Reduction which handles ambients resource-acquisition A.3 The MsAMS Structural Congruence Rules . . . . . . . . . . . .
257
. . . . . .
B Gathering Defense Requirements using Attack Trees B.1 Introduction . . . . . . . . . . . . . . . . . . . . . . . . . . . . . . B.2 A framework for gathering defense requirements . . . . . . . . . . B.2.1 Supporting deliverable: attack strategies organized in attack trees . . . . . . . . . . . . . . . . . . . . . . . . . . . B.2.2 Supporting deliverable: a matrix of attack versus defense strategies . . . . . . . . . . . . . . . . . . . . . . . . . . . B.2.3 Method for gathering defense requirements . . . . . . . . B.2.3.1 Step 1: Identify critical assets and processes . . B.2.3.2 Step 2: Select one critical asset/process . . . . . B.2.3.3 Step 3: Identify potential attacks related to insiders . . . . . . . . . . . . . . . . . . . . . . . . . B.2.3.4 Step 4: Assess risk level of each potential attack from defense level . . . . . . . . . . . . . . . . . xvi
243 245 250 250 253
. . . . . .
257 257 258 259 260 261 261
263 . 264 . 265 . 267 . . . .
269 274 274 275
. 275 . 275
CONTENTS B.2.3.5
B.3 B.4 B.5 B.6
Step 5: Select defense strategies which counter the potential attacks with high risk . . . . . . . The framework applied: an example . . . . . . . . . . . . . . . . Discussion . . . . . . . . . . . . . . . . . . . . . . . . . . . . . . . Related work . . . . . . . . . . . . . . . . . . . . . . . . . . . . . Summary . . . . . . . . . . . . . . . . . . . . . . . . . . . . . . .
Publications by the Author
. . . . .
276 277 278 279 279 283
References
285
SIKS Dissertation Series
299
xvii
List of Figures
1.1 1.2 1.3 1.4 1.5
Security governance cycle . . . . . . . . . . . . . . . . Total of published vulnerabilities per year (2003-2007) Total of published vulnerabilities per month (2008) . . Thesis outline . . . . . . . . . . . . . . . . . . . . . . . Method followed by the MsAMS Approach . . . . . .
. . . . .
. . . . .
. . . . .
. . . . .
. . . . .
. . . . .
2.1 2.2 2.3 2.4 2.5
. 3 . 5 . 6 . 10 . 12
Relation between threat, vulnerability and risk from [99] . . . . . Relationship between reviewed security terms . . . . . . . . . . . Basic penetration test cycle (adapted from [217, 220]) . . . . . . An example attack tree adapted from [186] . . . . . . . . . . . . An example fault tree, on the left, and its logically equivalent, on the right (adapted from [172]) . . . . . . . . . . . . . . . . . . . . 2.6 An Attack Graph can contain numerous Attack Trees; inductive and deductive reasoning are possible . . . . . . . . . . . . . . . . 2.7 Aggregation applied to a network with 16 hosts and 4 subnets (adapted from [156]) . . . . . . . . . . . . . . . . . . . . . . . . . 2.8 Visual clustering applied to the same network as the one shown in Figure 2.7 (adapted from [156]) . . . . . . . . . . . . . . . . . . . 2.9 Two displays of network topology . . . . . . . . . . . . . . . . . . 2.10 Memoryless pre- and postcondition scheme for dealing with credentials . . . . . . . . . . . . . . . . . . . . . . . . . . . . . . . .
. . . .
17 21 23 24
3.1 3.2
. 48
. 25 . 27 . 33 . 34 . 35 . 37
3.4 3.5
An example network topology . . . . . . . . . . . . . . . . . . . . Relationship between classes of attackers, objectives and strategies, with types of attack . . . . . . . . . . . . . . . . . . . . . . . . . A schematic representation of a sequential attack launched by target-driven attackers . . . . . . . . . . . . . . . . . . . . . . . . A generic IRC-based botnet . . . . . . . . . . . . . . . . . . . . . A generic DDoS attack (adapted from [88]) . . . . . . . . . . . .
4.1
Constructive and improving methods in heuristic search . . . . . . 77
5.1 5.2 5.3 5.4 5.5
CVSS metrics (adapted from [136]) . . . . . . . . . . . . . . . . . Understanding the reclassification of CVEs resulting in “admin” Understanding isolated CVEs with partial CIA impact . . . . . . Representation of CVEs in effect view from [126] . . . . . . . . . Representation of CVEs in impact view derived from NVD investigation . . . . . . . . . . . . . . . . . . . . . . . . . . . . . . . .
. . . .
Life-cycle of a solution (a potential multi-step Main algorithm . . . . . . . . . . . . . . . . . Reproduction phase algorithm . . . . . . . . . Retirement phase algorithm . . . . . . . . . .
. . . .
3.3
6.1 6.2 6.3 6.4
attack) . . . . . . . . . . . . . . .
. . . .
. . . .
. . . .
. . . .
. . . .
. . . .
. 55 . 58 . 59 . 60
85 93 97 99
. 100 106 112 112 113 xix
LIST OF FIGURES 6.5 6.6 6.7 6.8
Denial of Services by E-mail Worm . . . . . . . . . . . . . . Representation of the multi-step attack shown in Figure 6.5 Default network topology adapted from Suehring [204] . . . ELAS Output: multi-step attack . . . . . . . . . . . . . . .
. . . .
. . . .
. . . .
. . . .
114 114 115 116
7.1 7.2
An example network, adapted from Ingols et al. [105] . . . . . . . . 122 Method followed by the MsAMS approach, reflected in its proofof-concept tool . . . . . . . . . . . . . . . . . . . . . . . . . . . . . 125 7.3 Modelling the example network as Ambients . . . . . . . . . . . . . 126 7.4 The running example locality tree . . . . . . . . . . . . . . . . . . 129 7.5 Illustration of synchronous, inter-ambient movement . . . . . . . . 132 7.6 The arrows indicate possible directions the ambient-attacker can take from its initial location in sv A . . . . . . . . . . . . . . . . . 136 7.7 The arrows indicate possible directions an attacker can take from host D until the target sv E is reached . . . . . . . . . . . . . . . . 138 7.8 Simplified pseudocode of the computation of links algorithm; refer to Appendix A for definition of pathTo (Definition 43, in Appendix A)141 7.9 Webpages hyperlink structure represented on a graph . . . . . . . 142 7.10 Inlinks and outlinks for v E from the running example ambient . . 143 7.11 Mutual relationship between authorities and hubs in HITS (adapted from [120, Figure 3.3]) . . . . . . . . . . . . . . . . . . . . . . . . . 147 7.12 Compromise according to service . . . . . . . . . . . . . . . . . . . 154 7.13 Tree showing a successful search task (according to search task in Example 24) for the running example with stamped ambients . . . 159 7.14 Simplified pseudocode of the search algorithm . . . . . . . . . . . . 161 7.15 Illustration of forward-search and backward-search . . . . . . . . . 162 7.16aAmbient-attacker encounters an ambient which requires a credential it does not have . . . . . . . . . . . . . . . . . . . . . . . . . . 163 7.16bAmbient-attacker looks for credential needed . . . . . . . . . . . . 163 7.16cInitial search task resumed . . . . . . . . . . . . . . . . . . . . . . 163 7.17 Simplified pseudocode of the taskExpand method used by the search algorithm (Figure 7.14) . . . . . . . . . . . . . . . . . . . . . 164 7.18 Simplified pseudocode of the selectBestCandidate method used by taskExpand (Figure 7.17) . . . . . . . . . . . . . . . . . . . . . . . 164 8.1 8.2 8.3 8.4 8.5 8.6 8.7 8.8 xx
Modified running example with 10 copies of host B . . . . . . . . . 181 Computing grid network example motivated from practice . . . . . 182 The partitioned network shown in Figure 8.2 as Ambients: internet 183 The partitioned network shown in Figure 8.2 as Ambients: firewall FW2 . . . . . . . . . . . . . . . . . . . . . . . . . . . . . . . . . . . 183 Visual representation of traces 1, 2, and 3 (Example 39) . . . . . . 187 Power grid network (CORPnet) example from [181, 98] . . . . . . 189 Power grid network example as Ambients . . . . . . . . . . . . . . 190 Locality tree corresponding to Figure 8.7 . . . . . . . . . . . . . . . 191
LIST OF FIGURES 8.9 8.10 8.11 8.12 8.13 8.14 8.15
Complete locality tree corresponding to the ambients diagram in Figure 8.10 . . . . . . . . . . . . . . . . . . . . . . . . . . . . . . . 192 Added ambient world within internet, containing an ehome host . 193 Visual representation of the trace produced by MsAMS . . . . . . 198 Visual representation of the trace produced by MsAMS . . . . . . 201 Visual representation of the trace produced by MsAMS . . . . . . 204 Kerberos authentication simplified to 5 steps, adapted from [200, 187]205 Kerberos infrastructure added to the original example scenario shown in Figure 8.6 . . . . . . . . . . . . . . . . . . . . . . . . . . . 206
9.1 9.2
Performance of modules with varied number of ambients . . . . . . 230 Hermite interpolation plot of computing time T of performancedemanding modules, compared to a n2 shape curve where n is the number of ambients . . . . . . . . . . . . . . . . . . . . . . . . . . 231 9.3 Linear regression plot with line of best fit between time measured T and n2 and line of best fit between T and n3 . . . . . . . . . . . 232 9.4 Log-log plot for computing time T of different modules and number of ambients n . . . . . . . . . . . . . . . . . . . . . . . . . . . . . . 233 9.5 Performance of modules with varied number of firewall rules . . . . 235 9.6 Hermite interpolation plot of total computation T , compared to a r2 shape curve where r is the number of firewall rules . . . . . . . 236 9.7 Linear regression plot with line of best fit between time measured T and r2 and line of best fit between T and r3 , where r is the number of firewall rules . . . . . . . . . . . . . . . . . . . . . . . . 237 9.8 Consumption of RAM memory with varied number of ambients . . 238 9.9 Hermite interpolation of memory consumed M by memory-demanding modules, compared to a 2n2 shape curve . . . . . . . . . . . . . . . 238 9.10 Linear regression plot with line of best fit between memory consumed M and n2 , and line of best fit between M and n3 . . . . . . 239 A.1 Scope of methods DenyFromTo and AllowFromTo used to test there is a pathTo from ambient x to ambient y . . . . . . . . . A.2 Simplified pseudocode of the DenyFromTo method . . . . . . . A.3 Simplified pseudocode of the AllowFromTo method . . . . . . .
if . . 258 . . 258 . . 259
B.1 Framework composed by a method and supporting attack and defense strategies . . . . . . . . . . . . . . . . . . . . . . . . . . . . B.2 Tree structure of attack strategies involved with “Pre-attack” . . B.3 Tree structure for attack strategies involved with “Gain access” . B.4 Tree structure for attack strategies involved with “Abuse access” B.5 Attack strategies involved with “Abuse permission” . . . . . . . . B.6 Attack trees as states and possible transitions between them. . . B.7 Method for gathering requirements for defense against insiders . B.8 Example from a fictitious financial institution (from Chinchani et al. [38]) . . . . . . . . . . . . . . . . . . . . . . . . . . . . . . . .
. . . . . . .
266 268 268 269 270 271 274
. 277 xxi
List of Tables
1.1
Summary of contributions . . . . . . . . . . . . . . . . . . . . . . . 13
5.1 5.2 5.3 5.4 5.5 5.6
81 83 86 87 89
Classification of vulnerabilities based on access and effect from [126] Overview of the SCAP initiative from NIST . . . . . . . . . . . . . CVE attributes, as stored in the NVD, that required no preprocessing CVE attributes, as stored in the NVD, that required preprocessing Types of impact according to CIA configurations found in the NVD Distribution of CVEs by single attributes: exploitability of CVEs and resulting privilege from the exploitation of CVEs . . . . . . . . 5.7 Distribution of CVEs by single attributes: impact and attributes derived from CVEs descriptions . . . . . . . . . . . . . . . . . . . . 5.8 Distribution of CVEs in terms of privilege gained by their exploitation against type of impact caused by their exploitation . . . . . . 5.9 Distribution of CVEs with expressions in their descriptions that indicate gainAdmin effect resulting from their exploitation . . . . . 5.10 Privilege gained by the exploitation of CVEs and type of impact caused, against access required to exploit CVEs . . . . . . . . . . . 5.11 Distribution of CVEs in terms of effects DoS and runCode (derived from CVEs description) resulting from their exploitation . . . . . . 5.12 Complete clustering of CVEs based on impact and privilege resulting from their exploitation . . . . . . . . . . . . . . . . . . . . . . . 7.1 7.2 7.3
90 91 92 93 94 95 98
Scores produced by PageRank for the running example (α = 0.85) 146 Authority and hub scores produced by HITS for the running example (ξ = 0.85) . . . . . . . . . . . . . . . . . . . . . . . . . . . . 148 Schematic overview of types of vulnerabilities against modelling abstraction . . . . . . . . . . . . . . . . . . . . . . . . . . . . . . . 150
8.1 8.2 8.3 8.4 8.5
Summary of network access allowed . . . . . . . . . . . . . . . PageRank scores, power grid example, Section 8.3.1 (α = 0.85) HITS scores, power grid example, Section 8.3.1 (ξ = 0.85) . . . PageRank scores, power grid example, Section 8.3.2 (α = 0.85) HITS scores, power grid example, Section 8.3.2 (ξ = 0.85) . . .
. . . . .
. . . . .
190 220 221 222 223
9.1 9.2 9.3
Performance of modules with varied number of ambients . . . . . . 229 Performance of modules with varied number of firewall rules . . . . 234 Percentage of RAM memory consumed by each module . . . . . . 236
B.1 Extract from a matrix which correlates attack strategies, defense strategies and control principles . . . . . . . . . . . . . . . . . . . . 273 B.2 Potential attacks and derived risk level (from defense level) for the critical process “business account transactions” . . . . . . . . . . . 281 B.3 Defense goals for the critical process “business account transactions”282 xxiii
Part I
Motivation and Research Context
1
1
Introduction “Comparing the exploit vs the patch performance, one observes that the speed of insecurity exceeds the speed of security. It is harder to produce a patch than to produce an exploit.” [78]
Organizations face nowadays an overwhelming amount of network security events reported by security mechanisms or devices such as vulnerability scanning tools, Intrusion Detection Systems (IDS), firewalls. Reducing this overload of information becomes crucial to manage and extract useful knowledge for decision making related to security. Therefore, correlation and aggregation of security events is needed both for proactive security, which deals with preventing possible attacks, and for reactive security, which deals with detecting actual intrusions. These two perspectives complement each other and fit into the security governance cycle illustrated in Figure 1.1. strategic level
drivers for security enforcement
legal and regulatory requirements
incident response plans
security policies
security investments
proactive security
check security events
feedback for decision making
reactive security
MsAMS solution events vulnerability scanning tools, intrusion detection systems, firewalls
operational level
Figure 1.1: Security governance cycle 3
CHAPTER 1. INTRODUCTION In this thesis, we focus on the proactive aspect of finding possible network attacks before they become incidents. Traditionally, organizations have applied the principle of Defense in Depth to protect their networks and safeguard their most valuable assets with several layers of defense. The idea was that even if the first layers were bypassed, other layers would still be able to maintain the inner network secure. However, we learn from practice that this idea is mistaken because attackers can exploit vulnerable hosts as stepping stones to bypass all layers of defense or can even skip some layers and progress from there step-by-step to reach valuable assets deeper in the network. Furthermore, a computer network is an ever-changing environment. New business agreements trigger changes in firewall rules. New network functionalities trigger the configuration of new servers, new network services, and new users increasing the chance of introducing mis-configurations in the network. Additionally, patches are not always available and, even when they are, it may not be cost-effective to patch all vulnerabilities present in a network. Besides, when they are cost-effective, applying patches require a cycle of testing since they may cause side-effects, and therefore patches may not be immediately applied. Hence, no network is free from opportunities for attackers, and the security of all networks need to be assessed constantly. Finding steps of possible attacks turns out to be a rather challenging problem due to the complexity and size of networks, and the high number of possible combinations among steps which represent opportunities for potential attackers. To address the problem of proactively finding possible multi-step attacks in networks, this thesis proposes the MsAMS (Multi-step Attack Modelling and Simulation) solution: (i) an approach that uses a variation of Mobile Ambients as modelling paradigm, and Heuristic Search as simulation paradigm, supported by Link Analysis Ranking1 algorithms as a source of metrics. As an evidence of feasibility of this approach in networks of realistic size, this thesis introduces the (ii) MsAMS proof-of-concept tool, and shows that this is scalable to realistic networks.
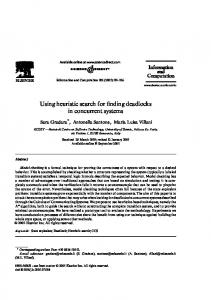
1.1 Background The Internet brought many benefits to organizations and individuals in the last few decades. Access anytime from anywhere is the (very) convenient new paradigm. Nevertheless, it also enhanced the risks of having hosts compromised without the need of physical access. This reality is reflected on the number of published vulnerabilities reported for Commercial-Off-The-Shelf (COTS) and open source software components [161], as illustrated in Figure 1.2 2 . We see that from 2003 to 2006 we had a sharp increase in the number of vulnerabilities, and from 2006 to 2007, an insignificant decrease of 1.4%. Nevertheless, in 2007 alone, a total of 6515 vulnerabilities were published. Zooming in on 2008, as shown in Figure 1.3, we observe that, although we have an oscillation along the months with August 1 This field of research deals with the prioritization of search results using the link structure of webpages. 2 The data was collected from the statistics page of NIST [161] on 08-Jan-2009
4
1.1. BACKGROUND
5000 4000 3000 2000 0
1000
Number of vulnerabilities
6000
7000
as the lowest score (367 vulnerabilities) and October as the peak (535 vulnerabilities), on average 470 vulnerabilities were reported per month, bringing us to an average of 16 vulnerabilities per day. This situation is unlikely to change. One reason is that information security is an externality [188] since the cost of insecurity is mostly paid by those who buy software components instead of those who produce them. A second reason is that there is time-to-market pressure and, in the end, software components are often initially released with little security and improved later on via patches or new versions [8].
2003
2004
2005
2006
2007
Year of publication (Jan/2003 − Dec/2007)
Figure 1.2: Total of published vulnerabilities per year (2003-2007) (Source: NVD [161]) Therefore, this volume of vulnerabilities requires management from organizations to determine which of the daily reported vulnerabilities apply to their environment according to the software they have installed, their version and configuration. At first sight, this appears to be a manageable problem in network administration, because the filtering of vulnerabilities that apply to a specific organization can be provided on a daily basis by contracted companies, as a service. However, a number of factors may turn this into a rather challenging management problem. First, there is a timelag between vulnerability discovery and patch release [78]. Besides, network administrators are usually very slow in applying fixes [177] (e.g. apply patches, perform upgrades, or disable services) to vulnerable systems. Therefore, there will be always a time-window of opportunities for attackers. 5
400 300 200 0
100
Number of vulnerabilities
500
600
CHAPTER 1. INTRODUCTION
Jan
Feb
Mar
Apr
May
Jun
Jul
Aug
Sep
Oct
Nov
Dec
Month of publication (Jan/2008 − Dec/2008)
Figure 1.3: NVD [161])
Total of published vulnerabilities per month (2008) (Source:
Second, even in well managed networks with strict security policies, entry points to attackers may be completely unknown to network administrators. In such networks, the absolute majority of hosts tend to have the same configuration, and their users are only allowed to use corporate-supported software; these hosts are automatically patched. However, there is always a small percentage of hosts used by users with administrative rights. This means they can install software themselves, and maintaining these hosts up-to-date depends on user initiative. Third, vulnerabilities are not only exploited in isolation. Once an attacker has found a way in a network she, as a rational being, will try to maximize her return on investment, as reported by the media (e.g. [194, 67]) and reflected in several research works (e.g. [49, 38, 185]). Therefore, network administrators have to manage not only isolated vulnerabilities but the risk of vulnerabilities composed in multi-step attacks. Furthermore, not only vulnerable hosts can be used to compose attack steps. Having access to a credential may allow attackers to also exploit non-vulnerable hosts. All in all, solving every isolated vulnerability, for example by patching, deactivating services and hosts, is never a solution for multi-step attacks. Finally, the road map of potential multi-step attacks is a very sensitive piece of information [126] since it would put a potential attacker who has access to it in an extremely advantageous position. As a consequence, organizations either 6
1.2. RESEARCH SCOPE AND GOAL tend to do this management internally or not at all. The above factors motivate the need for support in managing network vulnerabilities in the face of possible multi-step attacks. The major problem to be solved to improve manageability is to find out which multi-step attacks are possible in a network, for later analysis of which ones are worth defending against. The goal of this thesis is to provide a methodology for doing this, supported by a tool. Three main streams of research deal with multi-step attacks in a proactive way: Attack Graphs, Attack Trees, and Penetration Testing. These streams will be further discussed in Chapter 2, but our research is primarily related to the first stream. The first stream is the research field of Attack Graphs [105, 4, 111, 157, 206, 125, 164, 87, 192]. Vulnerabilities in COTS (Commercial-Off-The-Shelf) components, usually output of vulnerability scanning tools, represent attack steps which are organized in a graph structure that can support the search for several possible attack goals. The second stream is the research field of Attack Trees [186]. Attack steps are organized in a tree structure with an attack goal as the root of the tree. Therefore, an attack tree allows reasoning about one specific, known goal. Finally, the third stream is the research field of Penetration Testing [220, 94]. This is an empirical method where authorized professionals mimic attackers bypassing layers of defense.
1.2 Research Scope and Goal The driving overall goal of this research is to Provide decision making support to improve network security. This goal comprehends several sub-goals and we chose to approach the aspect of possible network attacks, which represent, in fact, a risk to be addressed, and about which decisions must be made in order to improve network security. However, before we can attempt to improve network security against possible attacks, by assessing the risk that possible network attacks represent and by addressing this risk, we have to Identify possible network attacks. It means that we have to address two sub-goals. First, we need to Understand network attacks. For this we have to investigate further what the causes and consequences of network vulnerability are and how the problem has been approached so far. This sub-goal motivates the research questions RQ1, RQ2 and RQ3, presented in the next section, which aim, in broad sense, at increasing knowledge about network attacks. Second, we need to Design a way to find possible network attacks. This sub-goal motivates the research questions RQ4, RQ5 and RQ6 (see next section). They aim, in broad sense, at addressing design issues of a solution to find attacks. The outcome of this research brings us closer to achieve the overall goal. The following breakdown of goals positions the scope of this thesis with respect to the broader perspective of the security governance cycle of Figure 1.1. The scope of this thesis is goal G1.1.1, understanding and finding possible network attacks. Risk assessment and management is left for future research. 7
CHAPTER 1. INTRODUCTION G1 Provide decision making support to improve network security G1.1 Manage risk of possible network attacks G1.1.1 Identify possible network attacks G1.1.1.1 Understand network attacks G1.1.1.2 Design a way to find possible network attacks G1.1.2 Assess risk that possible network attacks represent G1.1.3 Treat risk of possible network attacks G1.2 Manage risk of network intrusions G1.2.1 Detect network intrusions G1.2.2 Assess risk that network intrusions represent G1.2.3 Treat risk of network intrusions We take the approach of simulation 3 for finding possible attacks in a modelled network.
1.2.1
Non-objectives
The focus of this thesis is to address goal G1.1.1 but isolated from real-time issues. The solution proposed aims at improving the state-of-the-art in the active field of Attack Graphs from where the requirements of the solution were obtained. The solution proposed is not meant to be a proactive monitoring tool, therefore, it is not intended to be used live in a network. Rather, the solution is meant to be used off-line for diagnosis and exploration of a real network via its model, represented in the formalism proposed, with the objective of uncovering possible multi-steps which represent possible attacks. This thesis also does not deal with issues related to automatic import of input or export of output. Those issues have been extensively treated by the Attack Graph community. Nevertheless, we take into consideration the possibility of automatic import, when applicable, such as it happened for the selection of the conceptual model of vulnerabilities we adopt in our solution (presented in Chapter 5).
1.3 Research questions Our research goal is translated into the following research questions (RQ). • RQ1 Which properties and attributes of a network turn it susceptible to attacks? 3 Simulation, according to Merriam-Wester [137], is the imitative representation of the functioning of one system or process [the real system] by means of the functioning of another [the system model].
8
1.4. THESIS OUTLINE • RQ2 Which attackers’ objectives turn a network susceptible to attacks? Which strategies are used by attackers to achieve those objectives? • RQ3 What are possible attack steps? • RQ4 How to model a network in a simplified but realistic way? • RQ5 How can multi-step attacks be represented considering the type of steps uncovered in RQ3? • RQ6 How to find attacks in a way that serves attackers’ objectives and strategies mentioned in RQ2 and that uses the answers to questions RQ4 and RQ5? We view these questions from the perspective of knowledge and design problems, a terminology introduced by Wieringa et al. [226, 227]. Research questions 1-3 are knowledge problems. It means that their answers enhance the knowledge of stakeholders about a subject, i.e. the answers fulfil the gap between what stakeholders know and what they would like to know. Typically, to solve these problems one has to perform literature review, ask experts, or perform empirical research. While research questions 4-6 are design problems. It means that there is creativity involved to build something useful, therefore, reaching a practical goal. Their answers close the gap between what is perceived by stakeholders (i.e. phenomena) and is the desired state of the World. It is very much likely that different individuals will address a design problem differently although achieving the same goal.
1.4 Thesis outline Despite the fact that some of the research questions that guided this research are knowledge problems and others are design problems, the research involved with this thesis, as a whole, was treated as a design problem [226, 225]. Therefore, its outline reflects the main stages of the engineering cycle: Part I presents knowledge gained about the problem, part II presents the proposed solution, part III describes the solution validation, and finally part IV concludes the thesis. Figure 1.4 shows the partition of chapters within those parts. More specifically, Chapter 2 presents the terminology used throughout the thesis and reviews related work. Chapter 3 discusses the elements which make a network susceptible to attacks. Besides, it explains the idea of attack steps, and discusses attackers strategies and corresponding types of attack. Chapter 4 introduces the requirements for the solution derived from both literature, reviewed in Chapter 2, and from aspects of network attacks, reviewed in Chapter 3. The next three chapters present different aspects of the solution. In Chapter 5 we investigate the NVD4 , a publicly available database of vulnerabilities from 4 National
Vulnerability Database [161]
9
CHAPTER 1. INTRODUCTION
Chapter 2: Background and Related Work
Chapter 1: Introduction
Chapter 3: Understanding Network Attacks
Chapter 4: Solution Requirements
Part I − Motivation and Research Context
Chapter 5: Gaining Insights about Vuln. from the NVD
Chapter 6: Finding Network Att. as Optimization Prob.
Chapter 7: MsAMS: Multi−step Att.Modelling & Simul.
Part II − Proposed Solution: MsAMS
Chapter 8: Testing the MsAMS Approach
Chapter 9: Scalability of the MsAMS Approach
Part IV − Final Remarks
Part III − Solution Validation
Appendix A: Formalization of the MsAMS Approach
Chapter 10: Conclusion
Appendix B: Gathering Defense Req. w/ Attack Trees
Appendices
Figure 1.4: Thesis outline
NIST5 , to validate a classification of vulnerabilities found in the literature, and propose a variation of such classification, adopted in our solution, that is feasible for automatic import. Chapter 6 introduces the perspective of finding multi-step attacks in network as an optimization problem. We describe how we formalize attack steps in such a way that they can evolve into multi-step attacks by means of an evolutionary algorithm. However, this first approach did not meet the requirements we set for the solution in Chapter 4, therefore, another approach is introduced in the following chapter. Chapter 7 presents the MsAMS solution. It describes the method followed by the MsAMS approach, and different aspects of the solution, such as how we model a network in terms of a variation of Mobile Ambients, how we obtain multi-step attacks using Heuristic Search, and for which purposes we use Link Analysis Ranking algorithms to support the process of searching for attacks. Chapters 8 and 9 validate the MsAMS solution. In Chapter 8 we, first, reason about the scalability of modelling networks with MsAMS. Then, we test the MsAMS approach using example scenarios that demonstrate its use, and advan5 National
10
Institute of Standards and Technology [152].
1.5. CONTRIBUTIONS tages over attack graph approaches found in the literature. All traces of possible multi-step attacks and scores from Link Analysis Ranking algorithms reported throughout this chapter were produced by the MsAMS proof-of-concept tool. In Chapter 9 we analyze the complexity of the algorithms used in the tool and report results of empirical tests to evaluate the scalability of the tool itself. Chapter 10 concludes this thesis revisiting the research questions and requirements set in Chapter 4, and discussing achievements. Moreover, it presents opportunities for future work in terms of further research and industrial development of the MsAMS solution. Finally, Appendix A formalizes the reduction rules and structural congruence rules relevant to the MsAMS solution. Appendix B exemplifies the use of Attack Trees in a method for gathering requirements for defense against possible insider multi-step attacks.
1.5 Contributions This section provides a brief overview of the main contribution of this thesis, in Section 1.5.1, and a more detailed view of contributions, including a traceability matrix of publications, in Section 1.5.2.
1.5.1
About the MsAMS Solution
The MsAMS (Multi-step Attack Modelling and Simulation) solution proposed by this thesis to address goal G1.1.1 (presented in Section 1.2) comprehends an approach to model networks and simulate attackers, and a tool that implements this approach as a proof-of-concept. The method followed by the MsAMS approach is illustrated in Figure 1.5. It provides basically three functionalities highlighted in the figure: (i) modelling of a network in terms of ambients6 , (ii) ranking of ambients that feeds the next functionality and delivers connectivitybased asset values and cost metrics for the network modelled, and (iii) simulation of ambient-attackers which is, in fact, a search for possible multistep attacks in the network modelled.
1.5.2
Cross Analysis of Contributions
The contributions (CT) of this thesis are listed next. • CT1 Two heuristic search algorithms to find possible attacks on a modelled network. Each of them uses a different representation of attack steps, but 6 Ambients are the central abstraction of Mobile Ambients, introduced by Cardelli and Gordon [35].
11
CHAPTER 1. INTRODUCTION Network Configuration
Vulnerabilities and attributes
Authentication methods (Credentials)
Modelling of the Network 1 Network Model as Ambients
Network Model as Ambients Subset of Links
2 Complete set of Links
Simulation of Ambient−Attackers Target 4 Multi−step Attacks
Processing of Virtual Links
Ambient−attacker Initial Location
and Metrics for Search
Ranking of Network Ambients 3 Connectivity−based Asset Values
Cost Metrics
Figure 1.5: Method followed by the MsAMS Approach both use the concept of a pool of possible multi-step attacks. The search used in the MsAMS solution is able to mimic an attacker behavior when dealing with credentials needed to access non-vulnerable hosts in the network, a strength of MsAMS compared to existing attack graphs. • CT2 Two representations of attack steps that allow their manipulation by the heuristic search algorithms in a rich way, e.g. in terms of different compositions of attack steps. Particularly, the representation used in MsAMS allows the representation of movement, resource-acquisition, iteration, and communication steps, and allows taking into account location of ambients. Therefore, they have the potential to represent not only sequential attacks, as the other attack graph approaches do too, but can also represent attacks involving parallel attack steps. • CT3 Network models in a Mobile Ambients-based formalism that allows the representation of nesting and capabilities of ambients. It allows us to address gaps found in the literature of Attack Graphs, such as to fully represent the topology of networks in an abstract way. • CT4 A classification of known vulnerabilities by access and impact, that allows to classify almost 100% of vulnerabilities stored in the National Vulnerability Database (NVD [161]). That improves significantly the currently used access-to-effect classification, which covers only 65% of the NVD. This means that using our access-to-impact classification, all NVD entries can be automatically processed and fed into our MsAMS too (see also Figure 1.5). 12
1.5. CONTRIBUTIONS
Contribution
Goal
CT1 CT2
G1.1.1.2 G1.1.1.2
CT3 CT4 CT5 CT6 CT7 CT8
G1.1.1.2 G1.1.1.2 G1.1.1.2 G1.1.1.2 G1.1.1.1 G1.1.1.1
Research Question RQ6 RQ5 RQ4 RQ2 RQ4 RQ6 RQ1 RQ2 RQ3
and
Chapter Chapters 6 and 7 Chapters 6 and 7, and Appendix A Chapter 7 Chapter 5 Chapter 7 Chapter 7 Chapter 3 Chapter 3 and Appendix B
Table 1.1: Summary of contributions • CT5 The use of the Link Analysis Ranking algorithm HITS7 allows the calculation of connectivity-based scores used to search for possible attacks using the MsAMS solution. These scores allow incorporating a rationale to the selection of alternative steps, using a HITS-based metric that indicates cost of an attack step, thus avoiding the need for manual input of attack step cost. • CT6 The use of Link Analysis Ranking algorithms HITS and PageRank [27] allows the calculation of connectivity-based asset value automatically, used to indicate potential targets. This allows MsAMS to search for attacks that reach valuable targets. • CT7 A list of network properties that make them susceptible to attacks. • CT8 A review of attackers’ goals and strategies, and of possible attack steps, reflected in the MsAMS solution. Table 1.1 summarizes contributions against goals (presented in Section 1.2), research questions (presented in Section 1.3) and chapters (presented in Section 1.4).
7 Hypertext
Induced Topic Search [116]
13
2
Background and Related Work
In this chapter we recap security terms relevant for the remaining of this thesis. Additionally, we review related work which will be useful for extracting requirements for the solution in Chapter 4.
2.1 Security Terms An Information System is a set of interrelated components that collect (or retrieve), process, store, and distribute information to support decision making, coordination, and control in an organization [121]. where: Information is data [streams of raw facts representing events] that have been shaped into a form that is meaningful and useful to human beings [121]. Examples of information systems are business applications, databases, network services, and file systems. Most often (but not necessarily) information system components are implemented via software, which execute over an Operating System, and operate in computers. Information Security is the preservation and protection of confidentiality, integrity and availability of information; in addition, other properties such as authenticity, accountability, non-repudiation and reliability can also be involved (adapted from [107]). where: Confidentiality is the property that ensures information is not made available or disclosed to unauthorized individuals or processes (adapted from [107]). Integrity is the property that ensures information and the methods used to process and manage it are accurate and complete (adapted from [107]). Availability is the property that ensures assets are accessible and usable to authorized users when needed (adapted from [107]). where: 15
CHAPTER 2. BACKGROUND AND RELATED WORK An Asset is anything that has value to the organization, its business operations and its continuity [66]. Reliability is the property that ensures the continuity of correct service or information over time (adapted from [12]). Note that the difference between Security and Safety comes from the field of Dependable Computing [12]. While the former refers to the concurrent existence of confidentiality, integrity and availability, the latter refers to the absence of catastrophic consequences on the users and the environment (which, for example, endanger human lives). Thus, safety is an extension of reliability. Authenticity is the property that ensures the integrity of a message content and origin, and possibly of some other information, such as the time of emission [12]. It guarantees that information exchange is genuine, and trustful [153]. Accountability is the property that ensures the availability and integrity of information about the identity of the person who performed an operation [12]). It ensures that actions performed by an entity involving manipulation of information can be traced uniquely to that entity [153]. Non-repudiation is the property that ensures the availability and integrity of the identity of the sender of a message (non-repudiation of the origin), or of the receiver of a message (non-repudiation of reception) [12]. Neither sender nor receiver can later deny having processed the information [153]. Accountability supports non-repudiation [153] in the sense that the latter involves accountability of identity of the sender of a message and accountability of identity of its receiver. The concept of Attack is directly or indirectly related to many other security concepts, such as threat, vulnerability, risk, asset (already defined), and security controls. An Attack is a specific sequence of events1 indicative of an unauthorized access attempt [153]. An attack becomes an incident if it is successful [201], resulting in a compromise of information security. Note that the term attack is rather fuzzy and its distinction from incident is not always made, specially by the media. This terms become even harder to distinguish when intrusions are considered. Attack, for the context of this thesis, are compositions of events (i.e. attack steps that composed represent possible attacks), observable in a network model. Therefore, we do not deal with incidents. Attack in the context of reactive security, such as in the IDS (Intrusion Detection Systems) field, are compositions of actual events (called intrusions), observable in a network or host. These intrusions may represent attacks (i.e. attempts of compromise), or may represent incidents (i.e. successful attempts of compromise). Since we deal with possible attacks, and an attack is an attempt, i.e. it may be successful or not, possible attacks represent a risk to organizations, more 1 Any
16
observable occurrence in a network or system [153].
2.1. SECURITY TERMS specifically, to organizations’ assets. IT-related Risk is a function of (adapted from [202]): (i) the likelihood that a given threat agent (defined next) will exploit or trigger a particular information system vulnerability (ii) the resulting impact of this exploitation for an organization, if successful Therefore, risk of attack is only present if both elements threat and vulnerability exist, as illustrated in Figure 2.1. threat vulnerability R I S K
Figure 2.1: Relation between threat, vulnerability and risk from [99]
A threat is a potential for a threat-source to successfully exploit a particular information system vulnerability [153]. A threat source can be of many types, such as natural, environmental and human-related [202]. However, in this context, we are specifically interested in the last category, from now on called threat agent or simply attacker2 . Threat agent is an agent which actively exploits a vulnerability while performing an attack. A threat-agent can be automated or manual (i.e. can be a human being), and it may intentionally exploit a vulnerability or accidentally trigger a vulnerability [153]. An agent can be automated to different degrees, for example it can be completely autonomous as it happens in worm and virus attacks, or it can be controlled as it happens in botnet attacks. However, there are always motivations and abilities behind a threat-agent. Motivation is related to attackers’ goals, and strategies which will be further discussed in Chapter 3. The aspect of ability is related, for example, to attackers’ expertise, and resources [66], also further discussed in Chapter 3. Vulnerability3 is a very broad concept and is defined as a weakness in an information system, system security procedures, internal controls, or implementation that could be exploited or triggered by a threat agent[153]. 2 Hacker 3 also
is also used as a synonym. called flaw
17
CHAPTER 2. BACKGROUND AND RELATED WORK This definition makes explicit that vulnerabilities can reside in the social, physical and information systems domains. Besides, even within this last domain, it can exist in a software implementation or in internal controls. Hence, we use a narrower definition of vulnerability, and an explicit definition of exposure, borrowed from the “Common Vulnerabilities and Exposures” initiative [52]. For most of the thesis (e.g. parts II and III), we use the definition of vulnerability provided next. However, we also deal, in Appendix B, with vulnerabilities in security controls (defined below). Therefore, when confusion may arise, we make this context clear using terms “vulnerability in COTS” and “vulnerability in security controls”. A vulnerability is a mistake in software which hackers can use directly to access protected data [131]. Vulnerabilities are exploited, therefore, an exploit is the application of a threat against a vulnerability [201] to breach the security of an information system. An exploit can be manual or automated. For example, it can take the form of a specially crafted input, or an exploit code4 , as we will see in Chapter 3. An exposure provides information or capabilities that can indirectly provide access to protected data [131]. An example of vulnerability is a buffer overflow5 since its exploitation by an attacker allows direct access to data within the host containing the vulnerability. An exposure can be a mechanism which allows an attack to recover credentials within a vulnerable host, e.g. by using tools that decrypt passwords saved in the host hard drive, therefore, acquiring capabilities that can indirectly provide access to data in further non-vulnerable hosts. In summary, both vulnerabilities and exposures can function as steppingstones for attackers, and represent an important component of a successful attack. These two concepts will be further discussed in Chapter 3. Controls are the policies, procedures, practices and organizational structures designed to provide reasonable assurance that business objectives will be achieved and undesired events will be prevented or detected and corrected [109]. Security Controls are controls prescribed for an information system to protect the confidentiality, integrity, and availability of the system and its information [153]. Although each organization implements specific controls according to their goal(s)/business mission they are based on common control principles which apply to any organization. Examples of common control principles are: (i) Separation of Duties (SoD), (ii) Dual Control, (iii) Delegation and Revocation, (iv) Audit, (v) Least Privilege, and (vi) Non-repudiation. A security control can be effective in two ways, by reducing the impact of 4A
program that allows attackers to automatically break into a system[153]. condition at an interface under which more input can be placed into a buffer or data holding area than the capacity allocated, overwriting other information [153]. 5A
18
2.1. SECURITY TERMS a threat, and consequently of an attack, on an asset value or by reducing the probability of occurrence (i.e., likelihood ) of a threat/attack [66]. It is interesting to note that, on the one hand, security controls are enforced by the organization, i.e. by defenders, to assure a certain level of security, and, on the other hand, they are exploited by threat agents, i.e. by attackers, due to weaknesses in processes, applications, infrastructure, etc. These weaknesses are also vulnerabilities, but in much broader sense. This view is discussed in Appendix B. Therefore, vulnerabilities in security controls also represent opportunities, i.e. “open doors”, available for attackers to gain access to assets, defined previously. Asset value represents the relative value and importance of an asset, perceived by its stakeholders (adapted from [107, 66]). It is interesting to realize that not all stakeholders perceive the same value for a specific asset, due to different assumptions, needs and concerns. That is why asset value is relative. We adapt the Requirements Engineering view of stakeholders [82] to the context of our interest, as stated next. Stakeholder is a person or organization who influences an information system (e.g. by making decisions about it) or who is impacted by it (e.g. by the compromise of its security). Note, therefore, that attackers are also stakeholders since they can also influence an information system by compromising its confidentiality, integrity and availability, i.e. its security. As mentioned above, stakeholders may perceive different values for a same asset. On the one hand, asset owners and legitimate stakeholders perceive a value relative to the impact of losing the asset, reflected e.g. on expected loss of revenues, affected reputation, rebuilt of the asset, and effect on business-asusual. On the other hand, attackers perceive a value relative to the financial gain they can obtain by trading the asset on the black market, by the indirect benefit the compromise of the asset may represent, in terms of new opportunities it may bring, or by the disruption it may cause to legitimate stakeholders. As an example, a stolen credit card number can be negotiated on the black market for US$10 [230] (perceived value for attackers), while legitimate stakeholders may attribute a value well above that for it. We resume this discussion in Chapter 3. A target (of an attack) is an asset which has high value as perceived by a threat agent, i.e. by an attacker (adapted from [66]). Assets associated with Information Systems can be of many types (adapted from [107, 66]): (i) information, such as data files and databases (ii) software, such as application software and firewall software 19
CHAPTER 2. BACKGROUND AND RELATED WORK (iii) physical, such as computer equipments (laptops, desktops and servers, generically called hosts in this thesis), and other equipments (routers, printers) (iv) services, such as network services (v) human, such as end-users (vi) logical, such as login ID and credentials (vii) intangibles, such as reputation, mission and image We only consider targets which are relevant for the solution proposed, as explained in Chapters 6 and 7. For example, human and intangible assets are out of the scope of potential targets for us. An attacker strategy is an adverse action or actions (i.e. a plan of actions) performed by a threat agent on an asset to achieve a goal (adapted from [37]). Also referred to as Attack strategy. We can talk about strategies at different levels of abstraction. For example, in Appendix B we consider attack strategies as a plan of actions derived from four high level attack steps (Pre-attack, Gain Access, Abuse Access and Abuse Privilege). However, for our solution, as introduced in Section 3.3 on page 55, we consider attack strategies at an even higher level of abstraction. In any case, anticipating attack strategies allows the defender to plan for countermeasures, although a detailed plan of actions of the attacker is always unknown for the defender. Countermeasures are actions, devices, procedures, techniques, or other measures that reduce the vulnerability of an information system [153]. Synonymous with safeguards, and to some extent with security controls. Therefore, countermeasures reduce, i.e. mitigate, threat. In this sense, they can be considered as counterpart for attacker strategies, from now on called defender strategy or defense strategy. Security requirements are a translation of security objectives into security functional requirements (adapted from [37]). where: A security objective is a statement of intent to counter identified threats that satisfy identified organization security policies and/or assumptions, to ensure the confidentiality, integrity, and availability of the information being processed, stored, or transmitted (adapted from [37, 153]). It is worth emphasizing that a source of security requirements is the desire to counter identified threats. Hence, security requirements are also derived from defenders’ strategies which address identified attackers’ strategies. Figure 2.2 summarizes the relationship between the most relevant terms reviewed in this section. 20
2.2. RELATED WORK estimate value legitimate stakeholders (defenders)
threat agents (attackers) cause
estimate value
enforce exploit
vulnerabilities in COTS manage exposures
threat increase likelihood of is realized in
vulnerabilities in security controls
represent (increase) attacks
contain
risk
security controls
counter− measures
reduce
assets value impacts cause impact on assets
Figure 2.2: Relationship between reviewed security terms
2.2 Related work In the remaining of this chapter, we provide an overview on how the problem of finding potential multi-step network attacks has been approached in the literature. As mentioned in Chapter 1, there are three main streams of work, directly related to this topic: Penetration Testing, reviewed in Section 2.2.1, Attack Trees, reviewed in Section 2.2.2, and Attack Graphs, reviewed in Section 2.2.3. Furthermore, indirectly related work comes from the research field of Intrusion Detection/Prevention Systems (IDS/IPS), reviewed in Section 2.2.4.
2.2.1
Penetration Testing
Penetration Testing, often called Pen Testing, is a method to check security strength [220] of a target under evaluation, either for attesting compliance to regulations or for quality assurance purposes. It is performed by authorized professionals which actually mimic a threat agent, employing the same set of tools and strategies, to circumvent security controls in place. Targets of evaluation can be an organization network, or partitions of it, and in this case, the goal usually is to assess the network against the risk of gaining access to sensitive information. 21
CHAPTER 2. BACKGROUND AND RELATED WORK Other targets of evaluation can be specific like a host, a web application, or any other target of particular interest, for example, assess an organization against the risk of outsiders installing and later exploiting a wireless point to get access to the inner network. Unlike most of assurance methods, this type of test is holistic [220]. It means that rather than analyzing a target under one specific aspect, pen testers consider vulnerabilities from several domains, for example, the physical, telecommunications (wireless communications networked communication), and humans [94]. Pen tests can be conducted in several ways: they can be executed in a black or white box manner, overt or covert. A black-box type of test is more appropriate to simulate attacks from outsiders of an organization. In this case, testers are provided with a minimum, publicly available, set of information about the target under evaluation, and need to acquire the remaining information needed to launch attacks the same ways as remote, non-employees do [81]. The first stage testers have to bridge is to identify a way-in the network firewall and then, if successful, they can attempt to reach, interactively, other hosts within the network [217]. Alternatively, a white-box type of test is more appropriate to simulate attackers from insiders. In this case, testers are given the level of information and access equivalent to an employee, and the aim is to find paths to reach information the employee is not authorized to reach. On the one hand, an overt pen test happens when the organization staff has full knowledge about the testing. It is usually performed internally, by employees organized on a so called Blue Team [217]. On the other hand, a covert pen test happens when only the upper management responsible for the initiative has full knowledge about the testing. It is usually performed by teams called Red Teams6 from trusted third parties, with or without warnings. Either way has advantages and disadvantages. Red Teams have advantages related to specialization such as speed, expertise, and methodology. Beside, separation of duties among who is responsible for the target under evaluation and who actually performs the evaluation is also important [81]. Blue Teams have advantages related to secrecy, and cost since outsourced pen tests are expensive. Furthermore, they have more knowledge about the target under evaluation and, therefore, tend to be more likely to find extra attack paths. A pen test has basically four stages and is usually supported by the Flaw7 Hypothesis Methodology (FHM) [220], as illustrated in Figure 2.3: 1. a planning phase where scope of the testing, conditions for completion and threat sources to be considered (e.g. social engineering) should be agreed. 2. a discovery phase for information gathering about the target under evaluation and flaw discovery where vulnerabilities are detected. This phase can be supported by tools for identification of network topology and configuration, and for vulnerability scanning [91]. 6 Red
Teams are often used in the military domain to play the enemy role [213]. is equivalent to the broad view of vulnerability described in Section 2.1.
7 Flaw
22
2.2. RELATED WORK 3. an attack phase where actually the ethical hackers confirm and generalize flaws by exploiting them to identify the risk they pose if exploited by real attackers. There is a feedback loop between Attack and Discovery, since exploitation leads to more discovery. Besides, the attack phase itself can also be iterative because one successful exploitation might open opportunities for further exploitations [217]. Hackers toolkits and detailed instructions about exploitations found in specialized forums like www.securityfocus.com play an important role at this stage. 4. a reporting phase where findings and recommendations for flaw elimination are drawn, supported by considerations about risk. The planning is also documented in this phase. additional discovery
Planning (Testing goals, target to be evaluated, etc)
documented
Discovery (Flaw generation)
Reporting
Attack
further opportunities
(Flaw confirmation & generalization) documented
(Flaw elimination)
Figure 2.3: Basic penetration test cycle (adapted from [217, 220]) Penetration Testing is an empirical method which aims at checking security by uncovering flaws [220]. Nothing guarantees its completeness and, therefore, it is an assessment exercise which is part of the security governance cycle shown in Figure 1.1, and should be performed regularly. As with program testing, Pen Tests can be quite effective in showing the presence of vulnerabilities, but they are inadequate to show their absence [62]. Pen tests are expensive, labor-intensive and totally dependent on the skills (i.e. creativity, diligence, discipline) and technical expertise of testers [81]. Besides, they are constrained in time or funds unlike the attacker who might, e.g., leave a process running long after testers budget has expired [232]. Attack Trees [79], and manually generated Attack Graphs as reported by Sheyner and Wing [192], and discussed next, are used as support for Red Teams. Additionally, researchers have proposed the use of Petri Nets [132] and host-based attack chaining [4] to automate some aspects of pen tests.
2.2.2
Attack Trees
We have already seen in our discussion of Penetration Testing (in the previous section) that the Attack Phase, shown in Figure 2.3, is iterative i.e. one successful exploitation might open opportunities for further exploitations. Besides, this 23
CHAPTER 2. BACKGROUND AND RELATED WORK figure also shows a feedback loop between Attack and Discovery Phases, since one exploitation may lead to more discovery. Both loops bring the attacker closer to achieving a goal. Attack Trees provide a structured, top-down way to organize sub-goals (maybe obtained via Penetration Testing) which represent means to achieve a goal. Therefore, the root of the tree is an attacker goal, and the leaves are sub-goals which contribute towards their parent’s goal. An attack is a path from a leaf to the root, and as it happens in any tree structure by definition, any sub-goal (i.e. node) in an attack tree can only have one parent-goal [19]. Open Safe
Pick Lock
Learn Combo
Find Written Combo
Threaten
Cut Open Safe
Install Improperly
Get Combo from Target
Blackmail
Eavesdrop
Bribe
AND Listen to Conversation
Get Target to State Combo
Figure 2.4: An example attack tree adapted from [186] Figure 2.4 shows an example attack tree where leaf nodes are alternatives (OR-gates), i.e. only one sub-goal is sufficient to achieve its parent goal, unless explicit AND-gates indicate that all sub-goals are needed to achieve their parent goal. Attack Trees (AT) are in fact a variation of Fault Trees (FT) applied to the domain of Information Security by Bruce Schneier [186]. The root of a Fault Tree represents a failure, i.e. an undesired event, and leaves represent causes which contribute to the parent failure, i.e. basic observable failures. The construction of both types of tree (AT and FT) requires deductive reasoning8 , which means thinking backwards looking for means or causes of a phenomenon to be avoided. Figure 2.5 (on the left) shows an example FT which is a graphical representation of the following Boolean expression. T OP = V F ∪ [(F P 1 ∪ EF ) ∩ (F P 2 ∪ EF )] A FT can be analyzed in two aspects: qualitative and quantitative. Qualitative analysis of a FT involves reducing the tree into an equivalent one containing only minimum cut sets9 . By translating the FT into a Boolean ex8 Deduction
constitutes reasoning from the general to the specific [199]. minimum cut set is a set of leaves such that if they all occur then the root occurs; it is minimum if the root will no longer occur if any node is eliminated [198]. 9A
24
2.2. RELATED WORK No water from fire pump system
No water from fire pump system
TOP
Valve blocked or failed to open
TOP
No water from the two pumps
VF
Valve blocked or failed to open
G1
No water from pump 1
VF
No water from pump 2
G2
Failure of pump 1 FP1
EF
Failure of pump 2 FP2
EF
Failure of pump 2
FP1
Failure of engine EF
Failure of engine
G1
Failure of pump 1
G3
Failure of engine
No water from the two pumps
FP2 OR-gate AND-gate basic event
Figure 2.5: An example fault tree, on the left, and its logically equivalent, on the right (adapted from [172]) pression, top-down substitutions are possible, reducing the tree into an equivalent one containing only minimum cut sets. For example, the reduction of the FT on the left side of Figure 2.5 is shown on the right side, and is represented by the expression: T OP = V F ∪ (F P 1 ∩ F P 2) ∪ EF Therefore, the minimum cut sets of the original FT are: M CS1 = V F , M CS2 = F P 1 ∩ F P 2 and M CS3 = EF . It means that if any of the M CSi happens, the top event happens, and it also means that to prevent the top event to happen, all M CSi have to be prevented. As we can see, minimum cut sets relate basic events (leaves) to the top event (root), and do not provide complete paths through the tree, from leaves to root. This always works fine for Dependable Systems10 , however, it might or not work for analysis where Security rather than Safety is relevant; it will depend on the intended application. For example, Helmer et al. [93] use FT to identify and analyze security requirements for IDS11 . The minimum cut set in this case provides “what components of a distributed system [modelled as leaves] must be monitored to detect the intrusion [modelled as root]” [93]. Quantitative analysis of a FT involves determining the probability of the top event to happen, based on given probabilities of the basic events (i.e. leaves) to happen. Hence, leaves contain faults that are observable events associated e.g. with component hardware failures, human errors, software errors, or any other 10 Dependable systems are systems that have the “ability to avoid service failures that are more frequent and more severe than is acceptable” [12]. 11 Intrusion Detection Systems
25
CHAPTER 2. BACKGROUND AND RELATED WORK pertinent events which can lead to the undesired top event [199], but for which failure data exist [172]. Also the top event should be unambiguous and clear enough to answer 3W questions like what (e.g. fire), where (e.g. in the process oxidation reactor), and when (e.g. during normal operation) [172]. In the domain of network security, quantitative data about leaves of an AT are hard to obtain but, when available, FT techniques also apply to propagate values to the root of the tree. In summary, although AT are FT, analysis techniques and construction guidelines of the latter do not necessarily apply to the former, since AT tend to contain more subjective nodes, as illustrated in Figure 2.4. In fact, while in Attack Trees (leaf) nodes usually result from brainstorming, leaf nodes in Fault Trees nodes result from observable faults in the system being analyzed. Fault Tree Analysis is a technique which belong to the category of Probabilistic Risk Assessment (PRA). Tree-based PRA techniques such as, for example Event Tree Analysis (ETA)12 , are all scenario-based approaches for risk evaluation. Therefore, the effectiveness of results depend on the identification of significant scenarios [224]. In the domain of Dependable Systems it is easier to work in the failure space because usually a few fault tree covers all significant scenarios [224]. However, in the domain of Information Security, and more specifically in Network Security, this assumption does not always hold. The spectrum of attackers’ goals is usually very large in part because there are several potential targets which can be reached via different paths. As a consequence, Attack Trees are useful to assess specific scenarios, not the network as a whole. Tree-based deductive analysis, such as Fault Tree Analysis (FTA), is intrinsically a static technique which is often used for investigating accidents [224], since it allows the reconstruction of events which led to the accident in a logic and methodological way. The same happens for the static investigation of ways to achieve an attacker goal using Attack Trees. In the domain of security, attack trees have been used, e.g., to reason about countermeasures [21], assess risk, such as the commercial tool SecurlTree [3] from Amenaza Technologies, and to elicit requirements. This last application of Attack Trees is used by the SQUARE (System Quality Requirements Engineering) methodology [134, 83] to provide a high level picture of the nature of potential attacks on a system to-build, and has also been used by us. We organize, in Attack Trees, high-level means to achieve insiders’ sub-goals used to gather goalbased (security) requirements for the defense against insiders [75]. This work is reported in Appendix B. SecurlTree determines the risk of attack scenarios to happen using Attack Trees. Experts have to: (i) build the tree representing an attack scenario, (ii) determine the attacker profile in terms of technical ability, expected effort and level of risk the attacker is willing to take, and (iii) estimate impact indicators such as expected damage from the attack to the organization, and expected gain 12 Event Tree is an inductive reasoning method to analyze consequences of an initiating event, for example, an incident (root of the tree).
26
2.2. RELATED WORK for the attacker. Based on this input, the tool calculates risk and determines the least cost path to achieve the goal. The drawback of the tool is the amount of information it requires [222] which is not available in practice, therefore, making it totally expert-specific, and its limitation to completely known scenarios.
2.2.3
Attack Graphs
An Attack Graph can be viewed as a structure which contains numerous Attack Trees. This means that (i) one node can have more than one parent, (ii) more than one attacker and more than one goal can be represented, and (iii) both inductive reasoning13 (more common), forward from means to consequences, i.e. from an attacker initial location to a goal, and deductive reasoning, backward from consequences to means, i.e. from an attacker goal to an initial location, are possible. Figure 2.6 illustrates these observations. deductive reasoning
attacker goal attacker
goal inductive reasoning
Figure 2.6: An Attack Graph can contain numerous Attack Trees; inductive and deductive reasoning are possible Attack Graphs are used to uncover attack paths in a network which allows attackers to reach goals, i.e. allows attackers to compromise the network security. Attack Graphs have two main characteristics. First, network vulnerabilities are always represented. This is motivated by the recognition that “combinations of exploits [vulnerabilities] are the typical means by which an attacker breaks into a network” [5]. Second, and derived from the first, traversing the graph provides attack paths. Furthermore, graphs are a data structure that accommodate dynamics to different extents, such as pre- and postconditions attached to its nodes, very much used in the domain of Attack Graphs as we will see in this section. 13 Induction
involves reasoning from individual cases to a general conclusion [199].
27
CHAPTER 2. BACKGROUND AND RELATED WORK 2.2.3.1
State Enumeration-based Attack Graphs
Early approaches relied on state enumeration (i.e. state of the attacker and the network) to generate Attack Graphs. Model checker graphs are one example of such approach. Sheyner and Wing [192, 193], from Carnegie Mellon University, use a symbolic model checker (NuSMV) to build Attack Graphs. The approach requires as input a model of the network in a finite state machine representation and a property (system invariant) to be checked against the model. The model checker builds the model using information related to connectivity among hosts and a library of attack actions specifying details about vulnerabilities in terms of (1) intruder and network preconditions and (2) intruder and network effects. The security property indicates an attacker state, i.e. a goal or target, never to be reached. The model checker searches the entire state space defined by the model and returns all possible counter-examples, i.e. an attack graph containing all possibilities which lead to the attacker goal/target, if the property is not satisfied by the model. Results from their performance tests [191] show that the attack graph for a network with 3 hosts and 4 vulnerabilities was build in about 5 minutes. However, when the network increased to 5 hosts and 8 vulnerabilities, it took the model checker 2 hours to build a graph which had 5948 nodes and 68364 arcs. An evolution of their tool [135] relies on prioritization as a way to overcome attack graph complexity, as mentioned in Section 2.2.3.3. Model checker approaches in general tend to suffer from the drawback of the state explosion problem [214]. It means the complexity of the graph generated grows exponentially O(2n ), in terms of the size of the state space n, in this case, in the number of hosts and vulnerabilities. Other examples are the tools by Swiler and Phillips [167, 206] and Dacier et al. [57, 162]. The former tool requires detailed information about the network in configuration files, attacker profiles establishing initial capabilities based on attacker skill levels, and attack templates representing a generic state of an attack (pre- and postconditions of an attack step organized in a customized database). These three kinds of information are matched to generate the Attack Graph, reaching a goal state. Arcs represent transitions from one attack state to another, and an attack path is obtained via a near-optimal shortest path algorithm. They improve scalability with algorithms to eliminate redundant arcs and nodes and eliminate self-loops by means of templates, therefore, reducing the state space. Additionally, they suggest (i) aggregating machines with similar configurations to be represented as a single node in the graph, and (ii) decomposing the network hierarchically for analysis. However, despite interesting scalability measures (explored further by other researchers later), their graph remains fundamentally exponential in terms of the number of hosts. Examples provided are very small, e.g. with 2 hosts and 5 vulnerabilities [167] and with 3 hosts and 2 vulnerabilities [206]. The tool by Dacier et al. is based on privilege graphs where nodes are possible attack initiators and possible targets, i.e. nodes are a set of privileges owned by 28
2.2. RELATED WORK users or group of users. Arcs are vulnerabilities which allow the acquisition of privileges of a node-target by a node-initiator, if a transition occurs. The authors transform a privilege graph to a Stochastic Petri Net obtaining a state graph which eliminates initial duplication of states. Nevertheless, to estimate the probabilistic METF (Mean Effort To Failure), i.e. mean effort for an attacker to reach a target, they have to enumerate all possible paths to this target. Experiments with a file system containing 13 vulnerabilities, reported in [162], failed to successfully compute “due to the complexity of the algorithm” , showing that the METF “can only be computed when the number of paths between the attacker and the target is relatively small”14 . Therefore, state enumeration-based attack graphs (e.g. [192, 178, 170, 206, 57]), also called full graphs, do not scale to real networks. An important aspect of these graphs is the presence of state repetition since states are enumerated in every possible order. In practice it means that the attacker would visit the same state more than once to reacquire capabilities. The next generation of attack graphs assume that attacks are monotonic, as described next. 2.2.3.2
Exploit-based Attack Graphs
The monotonic assumption in the domain of network attacks was introduced by Ammann et al. [5]. It means that the attacker never has to backtrack, i.e. the attacker does not loose capabilities acquired previously in the course of an attack. This assumption is reasonable at the level of details required by attack graphs. As noted by Noel and Jajodia [157], “when non-monotonic attack behavior does occur, it is usually at a very detailed level”. This assumption allowed researchers to explore dependencies among vulnerabilities and other security attributes (generically called exploits) since, under the monotonic assumption, an exploit precondition is never invalidated by another exploit postcondition, i.e. once a precondition is satisfied it remains satisfied. Therefore, a new generation of Exploit-based Attack Graphs began, opposed to the previous State Enumerationbased Attack Graphs generation. Exploit-based graphs rely on pre- and postconditions to find attack paths on a network. Although scalability is no longer the main issue in this graph generation because instead of scaling to few hosts/vulnerabilities, as in the previous generation, they now scale to tens or hundreds of hosts (e.g. [111, 196]), or even to thousands of hosts (e.g. [105, 164]), it remains, along with other aspects, an important requirement for new approaches in the field of attack graphs. Ammann et al. [5] propose a graph where nodes represent generic pre- and postconditions of exploits and arcs represent exploits. Exploits can be vulnerabilities, or attacker and network attributes (e.g. a service running, a buffer 14 This result was obtained with the “Total memory (TM) assumption: at each step of the attack process, all the possibilities of attacks are considered (i.e. those from the newly visited node of the privilege graph and those from the already visited nodes that he did not apply previously, in a breadth-first fashion). At each step, the attacker may choose one attack among the set of possible attacks” [162].
29
CHAPTER 2. BACKGROUND AND RELATED WORK overflow, the fact the attacker has FTP access) and are associated with two or three host variables, which are instantiated when initial attacker conditions are given. Therefore, if an exploit e has 3 preconditions and 2 postconditions, there will be 6 arcs labeled e in the graph. As a consequence, it becomes difficult to follow attack steps from the graph [157] because the number of arcs with the same label tend to become high. Ammann et al. compute attack paths using breadth first search to find the shortest path, in terms of number of exploit, between the attacker and a goal/target. CAULDRON (Combinatorial Analysis Utilizing Logical Dependencies Residing On Networks) tool, from George Mason University (GMU), first introduced as TVA (Topological Vulnerability Analysis) tool [111], generates attack graphs based on the following input: (i) network configuration retrieved automatically from the Nessus scanning tool [149], (ii) a database of vulnerabilities provided with the tool and updated periodically by GMU researchers [50] specifying detailed pre- and postconditions of each vulnerability, and (iii) information about initial capabilities of the attacker and the goal/target. They build a type of graph which is the opposite of the one from Ammann et al. [5]. Exploits are nodes while pre- and postconditions are arcs, therefore, the exploit e above would be a node with 3 incoming and 2 outgoing arcs. They show, in [111], a backwards analysis of the graph, i.e. from the goal, using algebraic substitution. This way, they derive the minimum set of (pre/post)conditions that allow the attacker to reach the goal. The network administrator can, then, make choices to what conditions to tackle. However, as the number of exploits grow, “an attack graph with 100 exploits could have up to 1002 = 10, 000 edges [arcs] in the exploit dependency graph”, as observed by CAULDRON creators [157]. As a consequence, these graphs become too complex for humans to understand. To reduce this visual complexity several techniques have been proposed, as reviewed in Section 2.2.3.3. NetSPA (NETwork Security and Planning Architecture) tool, from MIT, has evolved from the generation of a full graph [10] to more efficient graph representations such as the predictive graph [126] and the multi-prerequisite (MP) graph [105]. The MP graph has 3 types of nodes (i) state, i.e. the attacker level of access on a host, (ii) prerequisite, i.e. reachability or a credential needed for exploiting a vulnerability, and (iii) vulnerability instance. This tool uses a different, more simplistic, approach to model vulnerabilities which can be populated with publicly available information such as the National Vulnerability Database [161] from NIST. It uses an access-to-effect paradigm, also used by other researchers (e.g. [125]). This paradigm adopts the type of access required for the exploitation of vulnerabilities (e.g. the attacker needs remote or local access) as precondition, and the resulting effect of the successful exploitation of vulnerabilities (e.g. the attacker gains admin privilege) as postcondition. Reachability between hosts obtained from firewall rules is pre-computed and used to create prerequisite nodes and their incoming and outgoing arcs. Although the tool scales to thousands of hosts, as reported in [105], the MP graph is abstract and difficult to convey to reality because the hierarchy of the network is not reflected in the graph. To overcome this problem, a solution based on treemaps is proposed in [228]. This 30
2.2. RELATED WORK solution is reviewed in the next sub-section. Ou et al. [165] use Datalog rules in the MulVAL (Multihost, multistage Vulnerability Analysis) tool for modelling the input required for the generation of Attack Graphs. All the input (including firewall rules as a so-called “hacl” rules) and possible state transitions are captured in Horn clauses of the type L0 := L1 , ..., Ln , where L0 is true if L1 , ..., Ln is true. Although they use public databases and the output of scanning tools to populate these rules, the rules themselves need to be stored in a private database. The Prolog reasoning engine has been adapted to produce a derivation trace used to generate a logical attack graph [164]. Performance tests with up to 2000 hosts [165] show that MulVAL escalates to thousands of hosts. However, the attack graph generated is large and difficult to understand, as reported in [180]. For example, for a network with 6 hosts and 2 firewall rules, “hacl” nodes appear 12 times in the graph generated. To overcome the size problem, they use node ranking [180], as mentioned in Section 2.2.3.3. At least two commercial tools generate a sort of Attack Graph to identify critical vulnerabilities to be patched: Skybox [196] and RedSeal [174]. The former relies on real-time data collected by monitoring and aggregation host-based agents scattered in the network [50]; it is unclear the consequences that this live analysis might cause on network performance, and the security scheme used to make sure that this information does not end up in the hands of attackers. According to [228], Skybox generates the shortest path between a given starting point and a target. The latter uses given asset values for the entire network to provide vulnerability metrics taking into account, e.g., access paths from a vulnerability. Both have their own database of vulnerabilities. From this first analysis of the second-generation of attack graphs, the main point that strikes is the fact that the graphs themselves are still large and incomprehensible. In the next section, we see how current approaches deal with this complexity a-posteriori, i.e. after the graph is generated. Besides, there are other aspects observable from the above review. Many approaches require private, customized databases of vulnerabilities because they rely on a set of attributes not available in public databases, such as the NVD [161]. We use vulnerability attributes based on the access-to-effect paradigm to avoid this problem15 . Approaches that use asset value assume they are provided (we will see in Chapter 4 that this aspect motivates requirement R3 ), and attack graphs typically consider only steps from one vulnerability to another, we come back to this aspect in Section 2.2.3.6. 2.2.3.3
Addressing Visual Attack Graphs Complexity
Several researchers have recognized attack graph visual complexity, e.g. [157, 228, 135, 206], even with simplifications such as the access-to-effect paradigm to model vulnerabilities. Attack graphs are difficult for humans to understand for two main reasons. First, they do not fully represent the topology of the network, 15 In fact, we will see in Chapter 5 that we use an improved classification of vulnerabilities based on an access-to-impact paradigm.
31
CHAPTER 2. BACKGROUND AND RELATED WORK i.e. firewalls, network hierarchy, logical grouping of hosts such as subnet, LAN (Local Area Network) and VLAN (Virtual LAN) are not represented in the graph itself. As a consequence, it is difficult to relate attack graphs to the network itself. Second, the overload of information is above humans capacity even for small networks due to number of arcs and the absence of logical constructs for “zooming in” or “zooming out”. Solutions for the problem rely on: (i) grouping, (ii) aggregation, (iii) clustering, (iv) treemaps, and (v) prioritization, applied after the attack graph is built, as reviewed next. Swiler et al. [206] suggest grouping of nodes with similar configurations into one single node in the graph. They reason that such hosts may have similar vulnerabilities as well. They leave as a challenge to “determine how to group these subsets in an efficient way so that there is little overlap and redundancy in the paths”. Other researchers (e.g. [105] in NetSPA tool) apply grouping method to reduce reachability computation. Noel and Jajodia apply aggregation rules [157], visual clustering [156], and adjacency matrix clustering [158] to overcome the complexity of attack graphs generated by CAULDRON tool. In their first approach, the computation of aggregated nodes uses a hierarchy of rules which guarantee that aggregations are not formed on an ad hoc basis but are rather semantically correct. They aggregate, for example: (i) conditions (preand postconditions) related to a same host into single host nodes by computing common attributes, (ii) exploits (i.e. vulnerabilities) between pairs of hosts into single exploit nodes by computing graph cliques, i.e. fully connected subgraphs, and (iii) fully connected hosts into single subnet nodes by computing subnet mask and IP addresses. Additionally, subnets can be aggregated, e.g. into LAN (Local Area Network) and VLAN (Virtual LAN), depending on input from users, provided that sets obtained form a connected subgraph. Figure 2.7 illustrates this technique. Their second approach, is similar to the first but the visualization is improved. For example, subnets are more explicitly represented, as shown in Figure 2.8. In their third approach, each arc of the attack graph becomes an element of an adjacent matrix. If there is at least one arc between hosts h1 and h2 , it means there is at least one exploit between them. In this case, element Aij of the matrix is filled with a 1 (visually black), otherwise with a 0 (visually white). The clustering algorithm finds blocks denoting similar patterns among attack graph arcs, as shown in Figure 2.9(a). While the adjacency matrix shows single attack steps, multiple attack steps are obtained by matrix multiplication. Therefore, the matrix resulting from the computation A2 represents all 2-step attacks, and so on. A multi-step reachability matrix calculated by A + A2 + A3 + ... + An−1 provides the minimum number of steps to reach each pair of nodes. Instead, if a boolean sum A ∨ A2 ∨ A3 ∨ ... ∨ An−1 is calculated, i.e. the transition closure of A, it is possible to know if a host can be reached by the attacker independent on the number of steps. The authors claim [158] that “there are improved algorithms,..., that come closer to O(n2 )” for computing the transitive closure. Williams et al. [228] use treemaps, as well as RedSeal commercial tool [174], 32
2.2. RELATED WORK
Attack
1 exploit
1 exploit
m3 1 exploit
m2 6 exploits
Subnet 1
m1 6 exploits
2 exploits
2 exploits
m4 m7 m6 m5 m9 m10 m8 m12 3 exploits 2 exploits 3 exploits 3 exploits 2 exploits 2 exploits 2 exploits 1 exploit
Subnet 2
4 exploits
2 exploits
m13 4 exploits
4 exploits
Subnet 3
m15 m14 4 exploits 1 exploit
m11 2 exploits
1 exploit
m16 4 exploits
Subnet 4
Figure 2.7: Aggregation applied to a network with 16 hosts and 4 subnets (adapted from [156])
to improve readability of attack graphs generated by the NetSPA tool. Hosts are grouped automatically depending on reachability into subnets, and vulnerabilities are grouped per host. The size of displayed subnets is proportional with the number of hosts it contains; arcs are hidden by default. It is up to users to position subnet treemaps into a meaningful hierarchy which represents the real network. They show the attacker’s ability to penetrate the network by means of arcs which indicate the shortest, worst-case, path between sets of nodes, as illustrated in Figure 2.9(b). Other approaches address attack graph complexity via prioritization. Both Sawilla and Ou [180] and Mehta et al. [135] use Link Analysis Ranking16 algorithms, such as Google’s PageRank [27], to achieve that. The former approach prioritizes configurations and conditions (e.g. vulnerabilities) which lead the attacker to achieve a determined goal/target in attack graphs generated by MulVAL. The latter approach has similar aim to prioritize states of the attack graph which are more relevant for the attacker to reach a goal. As we have seen in this section, current attack graph approaches address complexity by processing the graphs after they have been generated. Some complexity is decreased automatically by applying algorithms that compute subgraphs via 16 This field of research deals with the prioritization of search results using the link structure of web pages.
33
CHAPTER 2. BACKGROUND AND RELATED WORK
Attack
1 exploit Subnet 1 m2 m3 1 exploit 6 exploits
m1 6 exploits
Subnet 2 m12 1 exploit
m9 m11 m8 m10 2 exploits 2 exploits 2 exploits 2 exploits
2 exploits Subnet 3
2 exploits
1 exploit
m7 m6 m5 m4 2 exploits 3 exploits 3 exploits 3 exploits
Subnet 4 m16 m15 m14 4 exploits 1 exploit 4 exploits
m13 4 exploits
Figure 2.8: Visual clustering applied to the same network as the one shown in Figure 2.7 (adapted from [156])
ranks or graph cliques, subnets via reachability, or that hide arcs, and group vulnerabilities per host. However, other aspects of the topology of a network such as logical groups, e.g. LANs, and the hierarchy itself depends on users manual positioning. However, even with those automatic and manual structuring of a network, Figures 2.7 to 2.9 do not show networks that are easy to relate with the real network topology since we cannot identify, e.g., firewalls that are an important component of the topology. We will see in Chapter 4 that this aspect motivates requirement R1 . Furthermore, we also acknowledge that there are hosts with similar configurations in large organizational networks, and this similarity makes the network manageable. However, instead of taking the perspective of grouping nodes for the effect of graph processing or display, we take the perspective of copying configurations for the effect of network modelling, as we will see in Chapter 8. 2.2.3.4
Optimization Perspective of Attack Graphs
Optimization problems have to rely on at least one metric to guide the search process, as we can see next. Metrics can be the distance between two nodes, e.g. in terms of arcs, with the objective of finding the shortest path between them, or incorporate other metrics to achieve other objectives. Attackers do not necessarily choose the shortest path in terms of number of arcs (i.e. number of attack steps) between an initial location and a target, as some tools assume. This is simply because the attacker most probably do not have full knowledge about the network topology and of vulnerabilities it 34
2.2. RELATED WORK
EXTLAN
To Subnet 1 From Subnet 1
To To To Subnet 2 Subnet 3 Subnet 4
To Subnet 5
A1,1
10
lansubnet
20 From Subnet 2 From Subnet 3 From Subnet 4 From Subnet 5
30
A2,2
40
A3,3
50
A4,4
enclaveDMZ
60
A5,5
70
(a) Adjacency matrix for network with 75 hosts (adapted from [156])
enclaveINT
(b) Treemap for network with 4 subnets and 80 hosts collapsed into 25 nodes (adapted from [228])
Figure 2.9: Two displays of network topology
contains [162, 167]. Besides, the attacker when faced with alternatives from a current location (e.g. identified via a port scan), may give preference to less difficult-to-exploit vulnerabilities, or to alternatives which match with certain resources (e.g. a password or a toolkit). Furthermore, automated “attackers” may make choices based on conditions to be met (e.g. vulnerabilities which result in the ability to run code). Therefore, there is a heuristic component in attacks, recognized by other researchers. For this reason, efficient algorithms to find the shortest path between two nodes in a graph (e.g. Dijkstra’s [61]) may not good enough to find attack paths. Therefore, we need to incorporate other optimization criteria than the length of the attack path, such as a measure of cost of attack. Swiler et al. [206] assume that low cost paths for the attacker are the most exploitable. In their approach, costs or other type of weights, such as likelihood, average time to succeed and effort, are assigned to arcs and provided by users. Since they realize attackers are not likely to choose the shortest path, they opt for the �-optimal shortest path to find attacks in their attack graph, where � is is “large enough to account for uncertainty in individual edge metrics and uncertainty in the actual path the attacker will choose” [206]. More about their attack graphs have been discussed in Section 2.2.3.1. Chinchani et al. [38, 87], from Buffalo University, proposed a target-centric approach which allows not only the modelling but also the simulation of an attacker searching through the graph. Nodes are associated with tokens, e.g. credentials, and arcs associated with communication channels and cost. They use 35
CHAPTER 2. BACKGROUND AND RELATED WORK a greedy heuristic to search for attack paths. During the search, the attacker may acquire tokens at nodes, and if he has a token he incurs minimum cost to traverse an arc that requires that token, otherwise he incurs maximum cost. Their token is abstract enough to represent any information such as “mother maiden name” and “privilege acquired”, and their graph can represent a broad range of connections like telephone links. However, their computation of cost requires a two-layer classification of attributes related to the supposed attacker, vulnerability data, and asset information. The numeric values associates with those attributes are organized in a custom database, and the minimum and maximum costs are obtained via database queries. Their complicated scheme of cost assignment requires information that is either dependent on expert assignment, therefore is stakeholder-specific and subjective, or is dependent on information that is difficult to retrieve or automate. It means that this information is not available in large scale in practice. We share the opinion that finding attacks in a network is an optimization problem. However, we realize that this perspective is constrained by the lack of metrics which scales. We will see in Chapter 4 that this aspect motivates requirement R5 . 2.2.3.5
What-if Analysis in Attack Graphs
What-if analysis allows the validation of hypotheses against an attack graph. It means that one wants to validate the consequence, in terms of attacks, of an hypothesis made. In literature, we find hypotheses about: • attackers location (all attack graph approaches allow this type of hypothesis) • attackers goal, e.g. [165, 111, 191] • zero-day vulnerabilities (refer to Section 3.2.2.2 in page 51 for an explanation about this topic), e.g. [228] What-if analysis is an important aspect to be considered by new approaches to find attacks. However, apart from those type of hypotheses mentioned above, there are others not currently contemplated. For example, “what-if an attacker acquires a credential somehow, such as via social engineering?”. Furthermore, there are what-if hypotheses that are related to the dynamic aspect of networks, such as “what-if a firewall rule is changed?”, “what-if a certain vulnerability is patched?”, or “what-if a new firewall is deployed?”. We will see in Chapter 4 that this aspect motivates requirement R4 , and in part requirement R2 . 2.2.3.6
Credentials in Attack Graphs
Some attack graph approaches incorporate the concept of credentials for access control, as e.g. NetSPA [228], MulVAL [163], and Chinchani et al. [38]. 36
2.2. RELATED WORK The first (i.e. NetSPA) uses pre- and postconditions, where a state (specific host plus access level) may provide a credential to an attacker. If an attacker acquires root privilege on such a host which has a credential as postcondition, it is automatically assumed that the attacker acquires the credential and can use it later on hosts which have this credential as precondition. However, since states are memoryless, this approach does not allow a credential acquired in a current step to be used a few steps further. This is illustrated in Figure 2.10, where we see hosts B and C reachable from host A and hosts D and E reachable from host C. Since host A has credential c as postcondition and hosts B and C, reachable from A, have credential c as precondition then a step can occur between A and B or A and C. However, a step between C and D or C and E cannot occur because credential c is not postcondition of C. In summary, they use preconditions and postconditions to model trust relationships between hosts which share credentials. c as precondition
c as precondition
B A c as postcondition
D C E
reachability
Figure 2.10: Memoryless pre- and postcondition scheme for dealing with credentials The second (i.e. MulVAL), similar to the first, assumes a quite static, worsecase approach to the acquisition of credentials. A victim’s credential is acquired by an attacker in two circumstances. First, if the victim has an account, and the attacker obtains full control (root access) over the victim’s host; in this case it is assumed that the “Victims credential will be compromised by Attacker” [163]. Second, if the victim is labelled as “security incompetent”, as in a what-if hypothesis; in this case also the attacker will get hold of the victim’s credential automatically. This approach does not allow to model any dynamic which reflects uncertainty in the process of acquiring a credential. Besides, there is no distinction about which credential is acquired. In fact, credential is not part of the Horn clauses used for modelling acquisition of credential (refer to Section 2.2.3.2 for an overview of MulVAL), as we can see in the extract below [163]: principalCompromised(Victim, Attacker) :- hasAccount(Victim, H, User), execCode(Attacker, H, root), malicious(Attacker). principalCompromised(Victim, Attacker) :- incompetent(Victim), malicious(Attacker).
Therefore, modelling at the level of host and principal is rather a limited approach to the acquisition of credentials, it is important to model at the granularity of credential. 37
CHAPTER 2. BACKGROUND AND RELATED WORK The third (i.e. Chinchani’s) does not deal with credentials explicitly, but with tokens which may represent credentials. Their algorithm to find attacks incorporate some degree of uncertainty reflected on the cost (minimum or maximum) of the attacker step. Hence, credentials are not used to model authentication to hosts which require them but may not be vulnerable. As we have seen in this section, credentials have been addressed only by a few attack graph approaches. When addressed, it has been in a limited way in the sense that credentials are not entities of their own, their acquisition is automatic under certain conditions, and the acquisition of credentials is memoryless in all approaches reviewed (although this aspect ha only been discussed for the first). We have the view that credentials are an important aspect to be modelled more thoroughly because they allow expanding the underlying motivation behind attack graphs which is the recognition that “combinations of exploits [vulnerabilities] are the typical means by which an attacker breaks into a network” [5]. However, credential theft, e.g., can also be used in multi-step attacks since it opens opportunities to compromise non-vulnerable hosts as well. In addition to that, we have a dynamic perspective to credential acquisition. We will see in Chapter 4 that these aspects motivate requirement R2 .
2.2.4
Overlap between IDS/IPS and Attack Graphs
Although the source of information used by Intrusion Detection Systems (IDS) and Intrusion Prevention Systems (IPS) fundamentally diverge from information used by Attack Graphs there are points of intersection between these research areas. First we start by providing a little background information on IDS/IPS, essential for understanding the relation between them and Attack Graphs. An IDS is a software sensor which detects malicious activities, which happened or are happening, based on signatures, i.e. patterns of known attacks, or based on unusual or abnormal user behavior. The former is referred to as a signature-based IDS and the latter as an anomaly-based IDS. There are two main sources of data for an IDS: data collected from a single host or single application, or from network traffic. An IDS that uses the former is called a Host IDS (HIDS); an IDS that uses the latter is called a Network IDS (NIDS). A hybrid IDS combines both approaches and can also combine different detection methods. IDSs scan network traffic or also incoming and outgoing host traffic to find potentially malicious packets. Thus, traditionally they analyze packets at OSI layers 3 (Network) and 4 (Transport) (see [14] for a survey). Along the years, several types of application-based IDS have emerged [223]. In the first type, the IDS uses intercepted traffic going in and out of the application. In the second type, the IDS relies on third-party logs from Operating Systems, databases and firewalls [42, 208]. Finally, in the last type, the IDS directly uses internal application messages and library calls [112, 2]. However, only recently, IDSs started to analyze the semantics of application protocols (OSI layer 7), like FTP [64] and HTTP [22], for example. Nevertheless, IDSs consider events at 38
2.2. RELATED WORK much lower level of abstraction compared to the ones dealt by Attack Graphs. IPS (Intrusion Prevention Systems) differs from IDS because, while the latter analyzes traffic that “passes by” (more or less like an intelligent sniffer) the (IDS) system, the former analyzes traffic that flows through the (IPS) system. Therefore, an IPS gains the ability to react and block intrusions in real-time. As a consequence, IPS becomes proactive (such as Attack Graphs) instead of reactive (such as IDS). The overlap between these research areas are reviewed next. • Correlation of events: the same way as attack steps are correlated to provide a higher-level view of possible attacks, via Attack Graphs, alerts are also correlated with the same objective. Kruegel et al. [118] discuss approaches to alert correlation and their challenges. The correlation of alerts uses information such as source or destination IP address associated with network packets, and timestamp, or known scenarios (i.e. signatures). Attack description languages based on complex sets of pre- and postconditions are also used to correlate alerts (e.g. [207, 51, 139, 65]), similar to some approaches used to correlate attack steps on Attack Graphs (e.g. [111, 60, 167]). • Aggregation of alerts and vulnerabilities: the aggregation of these sources of information can be useful for many purposes, using Attack Graphs or isolated vulnerabilities. First, to reduce the rate of false negatives, i.e. missed attacks. With that purpose, Noel et al. [160] use an Attack Graph to calculate the distance (i.e. the shortest path) between exploits, later used to analyze alerts produced by an IDS. Second, to correlate, predict and hypothesize. Wang et al. [219] propose such approach. They use an Attack Graph as support to correlate alerts which are arbitrarily far away, to hypothesize about missing alerts (false negatives) traversing edges of the Attack Graph in reverse order, and to predict future attacks (i.e. alerts not yet observed) by looking steps ahead into the Attack Graph. Third, to provide a holistic view and centralize management of assets. Tenable Network Security provide a tool for that, where vulnerabilities are considered in isolation. • Ideal placement of IDS: Attack Graphs are also used to resolve the problem of covering all paths to critical assets with a minimum number of sensors, an instance of the Minimum Set Cover Problem [80]. Noel and Jajodia [159] find those paths by means of an Attack Graph and then use a Greedy algorithm to determine placement of IDS. Modelo-Howard et al. [144] use Attack Graph to build a Bayesian Network and infer the likelihood that an attacker goal is achieved, therefore evaluating accuracy and precision of different placements of IDS. They also use a Greedy algorithm to determine the best placement using data collected from the inference. 39
CHAPTER 2. BACKGROUND AND RELATED WORK
2.3 Summary In this chapter we have seen three streams of research directly related to the problem of finding potential multi-step network attacks. Here we provide a helicopter view of the conclusions we derive from this literature review. Penetration Testing Pros • very useful, if performed regularly • effective in uncovering attack paths • precise in paths reported
Attack Trees Pros • structured and top-down way to organize means to achieve an attack goal/target (root of the tree)
• very useful methodology for brainstorming specific scenarios
• intrinsically a deductive reasoning method that allows logic connection between a node and its parent node
40
Cons • expensive • labor-intensive • totally dependent on skills and technical expertise of testers • constrained by time and budget
Cons • analysis techniques and construction guidelines of Fault Trees (from which Attack Trees are derived) do not necessarily apply to attack trees, since attack trees tend to contain more subjective (and ambiguous) nodes • do not scale when numerous scenarios may arise or when depth and breadth of the tree grow beyond a certain limit, e.g. for analysis of a whole network • intrinsically a static technique, so it is not possible to represent any sort of attack dynamic, e.g. compose attack steps under certain conditions or represent acquisition of credentials • a path from each leaf to the root represents an attack, however in reality from a current location (e.g. a leaf) an attacker may have more than one alternative to follow; this is not possible to represent with attack trees since, by definition, each node in a tree structure has an unique parent node
2.3. SUMMARY Attack Graphs Pros • allows inductive and deductive reasoning about attacks, from an attacker initial location to a goal/target and vice-versa, respectively • allows representing several possible goals/targets, and several initial locations; traversing the graph provides an attack path • network vulnerabilities are always represented; pre- and postconditions allow composing attack steps
• what-if hypotheses are provided by attack graphs to some extent • metrics used, such as asset value and measures of cost of attack steps, are assumed given
Cons
• graphs become large and incomprehensible, and it becomes difficult for humans to recognize in the graph the topology of the real network • non-vulnerable hosts are not the focus of attack graphs; attack and network dynamics are not represented; credentials are not distinct entities in attack graphs, thus, credential theft cannot happen • what-if related to dynamics (e.g. with credentials) not present • in practice these metrics are stakeholder-specific, time-consuming and difficult to be evaluated; not available for large networks
Those gaps found in the field of Attack Graphs are discussed further in Chapter 4, where requirements for a better solution are specified. This thesis shifts the paradigm of Attack Graphs to Mobile Ambients.
41
3
Understanding Network Attacks “Unfortunately, even with industry-best defenses, a sufficiently motivated attacker can penetrate the network [210].”
In the previous chapter, we reviewed literature related to the problem of finding potential multi-step network attacks. In this chapter, we focus on networks, particularly we review aspects of computer networks, attacks and attackers that help in understanding why a network is susceptible to attacks, and what are possible attack steps. From this understanding, and also from related work, reviewed in the previous chapter, we derive our solution requirements presented in Chapter 4.
3.1 Computer Networks For several reasons, listed below, computer networks are more and more vulnerable to attacks. 1. Dedicated communication channels are replaced by standard protocols1 . Even safety and mission critical systems, such as the ones responsible for control of power plants, electricity grids, and oil platforms, are becoming more vulnerable to publicly known vulnerabilities. In the past, they used dedicated communication channels owned by the organization or leased from a trusted third party (such as dedicated phone lines) for data transfer. However, due to cost constraints, this situation is changing [102]. Nowadays, these systems are getting connected to the Internet via dial-up or broadband connections using the TCP/IP protocol. As a consequence, all parts of the communication, i.e. data in transit and end-points, become more and more susceptible to remotely exploitable and known vulnerabilities. 1 It does not mean that networks were safe before and are unsafe now, it means that networks were already vulnerable in the past and are even more vulnerable nowadays. The same is true for the next item.
43
CHAPTER 3. UNDERSTANDING NETWORK ATTACKS 2. Proprietary software is replaced by standard software. An example of this phenomenon is observable in SCADA (Supervisory Control and Data Acquisition2 ) systems. In the past, they used proprietary software while, nowadays, SCADA systems are built using standard operating systems such as Windows and Linux [69], and rely on other standard components such as Web browsers. Therefore, SCADA systems and SCADA networks (which are linked to corporate networks) are now exposed to vulnerabilities in Commercial-Off-The-Shelf (COTS) software [166], which arise everyday, as seen in Figures 1.2 and 1.3, and are publicly known. 3. Time-to-market pressure contributes to less secure software. As time-to-market requirements shorten to guarantee advantage over the competition, software producers are shipping not-so-well-tested products, relying on fixing vulnerabilities in later versions or via patches [8]. This becomes an option for them because, all-in-all, security is an externality [188, 7], since the risks caused by these vulnerabilities are paid by software consumers, not software producers. Bad reputation which might result from this strategy may always be overcome by marketing initiatives. Nevertheless, although time-to-market contributes to aggravating the security problem, the underlying cause is software complexity. Considering that building software to be deployed on a network only adds to the complexity of building software which resides on a stand-alone computer [187], the way to assure software security is to proof its correctness afterwards or proof its correctness at design time [63], which is still far away from being achieved in practice [17] (in part due to the economics of security, briefly discussed in this item). 4. Networks are dynamic environments. Networks are enablers of business opportunities, therefore, as organizations engage in new partnerships, joint ventures, outsourcing and subcontracting activities, organizations have to allow access from third parties to their networks. Not only that, this process is dynamic, meaning that configurations of firewalls have to be eventually changed, opening up opportunities of misconfiguration. Besides, nowadays it is often the case that employees need to access a corporate network from their computer at home, or in transit from laptops and PDAs, and again networks should allow their traffic in. However, this need for reachability represents new threats since there is no way to distinguish legitimate from malicious access, if the latter uses legitimate ways to get in the network. 5. Networks are never vulnerability-free. 2 SCADA systems are used to control and monitor industrial processes, and vital infrastructure components.
44
3.1. COMPUTER NETWORKS Studies show that: (i) there is a time-window of opportunity between vulnerability discovery and patch release [78]; (ii) even when patches are released quickly, administrators are usually slow in applying fixes (patches, upgrades and disabling services), in spite of the announcement of exploits (i.e. malicious code) which take advantage of the vulnerability [177]. A possible explanation for this slowness is the fact that patches may have unforeseen consequences, raising other vulnerabilities [133] in the system or elsewhere in the network. Therefore, unless the patch is trivial, patching requires testing prior to deployment in production. Additional studies, like the one on Data Breach by Verizon [16], which analyzed 500 cases of insider attack between 2004 and 2007, uncovered what they called “unknown unknowns”. They found that nine out of ten cases analyzed involved some sort of unknown to the organization: unknown systems, unknown data, unknown connections/pathways, or unknown accounts/privileges. Therefore, even if fixes are available and have been applying to the majority of the network, it may as well happen that organizations have forgotten systems which contain easily exploitable vulnerabilities. These facts lead us to conclude that it is unlikely that a network, as a whole, will ever be free from (known) vulnerabilities. 6. Humans contribute to making networks even more vulnerable. Even in a hypothetical world where a network is 100% secure, there is a high chance that humans will make it insecure [187]. We perceive threats from the physical domain much easier than threats from the digital domain. It means that we try to avoid going into a bad neighborhood, protect our wallet, and refuse to give personal details to a stranger in the street, just because threat here is obvious and visible. However, we have a different attitude when visiting web sites, choosing the same password for several applications, and filling forms with personal details, e.g. to register for a conference or to obtain a brochure. In this case, threat is not obvious at all because it can come from the other side of the globe. Furthermore, there is always a trade-off between usability and security. If this is apparent, e.g. if it requires manual intervention, people tend to choose the former in spite of the latter. In addition, humans are easily convinced and faithful, that is why social engineering3 to obtain something from another person, and personalized spam are often effective. Therefore, humans are a source of exposures (as defined in Chapter 2), which indirectly makes networks vulnerable. 7. Threats are increasingly endangering networks. The assessment of threats is usually performed based on the following factors (see e.g. [37, 66]): (i) threat agent motivation, (ii) threat agent skills, 3 An attempt to trick someone into revealing information (e.g., a password) that can be used to attack systems or networks [153].
45
CHAPTER 3. UNDERSTANDING NETWORK ATTACKS expertise or knowledge, (iii) time, effort or resources a threat agent needs to execute a type of attack, and (iv) opportunity for a threat agent to launch a type of attack. However, the increasing use of automation in attacks, and the advent of the Internet, have put at least factors (ii) and (iii) under a different perspective, difficult to reason about. Let’s consider four examples of resources, i.e. tools publically available, that threat agents can nowadays take advantage of: (a) Backdoor tools: these are programs that allow attackers to gain remote access to a system, bypassing authentication measures, such as login and password. They listen on a pre-configured port (e.g. DNS port 53, allowed by external firewalls) for connections coming from the attacker located on the Internet. Netcat4 is such a tool; it creates a root-level shell able to listen on any TCP or UDP port of Unix-based systems. For Windows-based systems, backdoors can be created with other tools, such as Black Orifice. (b) Kernel-level rootkits: these are a set of Trojan horse5 programs that replace or modify entire kernel modules by trojan modules. They allow attackers to keep elevated access to a system (i.e. come and go as they wish), and actually control every aspect of the host, such as its hardware and software, with a high chance of remaining undetectable. One of such trojans can be, e.g., a key logger that collects user key strokes in a file, later retrieved by the attacker. These rootkits are an evolution from traditional rootkits which targeted application-level programs like ls and ipconfig. Example tools are Knark for Linux, and RootKit for Windows. (c) Distributed password crackers: these are tools which distribute the password cracking load across several systems, and coordinate the collection of results. They represent an improvement compared to traditional crackers because distribution significantly speeds the cracking process. Password cracking consists of an automated loop of guessing a password, encrypting it, and comparing the guessed (and encrypted) password with stolen (encrypted) passwords. They assume that usually users use passwords that are easy to remember, therefore, composed of dictionary words (or userID) appended or prepended with different characters, and combinations of these, like reverse words, and some capitalized letters. Traditional crackers include John-the-Ripper, which focus on cracking Unix passwords, and L0phtCrack, focused on Windows NT passwords, while examples of distributed crackers are Mio-Star and Saltine Cracker. (d) War driving tools: these are tools used to identify wireless access points. Using a laptop, a wireless card, an antenna and such a tool, 4 Netcat
is also used by network administrators to administer systems remotely. horse programs “appear to have some useful function, but in reality are just disguising some malicious activity [210].” 5 Trojan
46
3.2. NETWORK ATTACKS which has a GPS module, attackers can pinpoint geographically wireless access points, later used to penetrate a network. Example tools are NetStembler (for Windows) and Mini-Stumbler (for Unix). For more information about the mentioned tools, including URLs, refer to [210, 97]. This selection of ready-to-use tools for different purposes shows that these tools can be used by attackers with low-to-moderate expertise, skills and knowledge, at least a lot less than what was needed to build these tools. Hence, there is an army of attackers out there, with basic expertise, skills and knowledge, able to follow step-by-step procedures on how to use them. Besides, automation also puts effort and time under a different dimension. Does it matter if a password cracking tool takes a day to crack 1000 passwords (as reported in [187])? It seems not, because the attacker is not coordinating or executing the cracking process manually. If, at the end of the day, the tool reports one password cracked, the attacker attempt resulted in success, and the attacker can possibly penetrate or proceed penetrating a network. Therefore, the most important factors determining threat seem to be motivation and opportunity. Motivation will determine the strategy chosen by a threat agent, and the goal/target of the attack. Since strategy and target are unknown, defenders require tools to reason about network attacks. This thesis contributes to the provision of such tools (refer to Section 3.3 for discussion about attackers objectives and strategies, and to Section 3.4 for discussion about asset value and targets). We assume the worse-case scenario that there will always be motivated threat agents willing to take opportunities to reach targets deeper on a network. It is up to organizations to track such opportunities, it means to track possible multi-step attacks.
3.2 Network Attacks In the previous section we have seen factors which contribute for making networks vulnerable. In this section, we discuss network attacks in terms of single and multi-step attacks (in Sections 3.2.1 and 3.2.2, respectively).
3.2.1
Single-step Attacks
Some attacks can be launched in one single step. Let’s consider that an organization has the network topology shown in Figure 3.1. The network shown in the figure is divided in three zones: internet, DMZ6 , and internal (LAN). The internal network is further segmented into three subnets: sales, production, and administration. 6 Demilitarized zone, term borrowed from military usage, is a logical or physical subnet which intermediates the external world (i.e. it provides external services) and the organizational LAN.
47
CHAPTER 3. UNDERSTANDING NETWORK ATTACKS
internet
200.30.0.1 NIDS
80
200.30.0.2 – www.example.com web server
DMZ
200.30.0.3
25
mail server
200.30.0.x 53
200.30.0.4 DNS server 10.16.100.10
10.16.0.1
33 14
10.16.0.2
subnet sales 10.16.200.x
subnet administration subnet production
10.16.100.40 25 internal mail server
10.16.100.50
10.16.100.20 2049 web pages file server 10.16.100.30
53
10.16.300.x
customer data
database
internal DNS server
administration server
Figure 3.1: An example network topology
Hypothetically, an attacker located in the internet can cause a Denial of Services by exploiting a remotely exploitable buffer overflow7 on the Web server, protected by the external firewall of the organization, as illustrated in Figure 3.1. The attacker will have high chance of success, if the request is not detectable by defense mechanisms such as a NIDS (Network Intrusion Detection System), also shown in the example network. Let’s consider that the Web server is an Apache Web Server (part of the Oracle WebLogic 10.3 platform) and contains the following high-severity vulnerability, published in the NVD [161] (see Section 3.2.2.2) on 22 July 20088 . CVE-2008-3257 description [53]: Stack-based buffer overflow in the Apache Connector (mod wl) in Oracle WebLogic Server (formerly BEA WebLogic Server) 10.3 and earlier allows remote attackers to execute arbitrary code via a long HTTP version string, as demonstrated by a string after ”POST /.jsp” in an HTTP request. The exploit occurs when a client (i.e. a remote attacker) sends a HTTP 7 A condition at an interface under which more input can be placed into a buffer or data holding area than the capacity allocated, overwriting other information [153]. 8 Oracle released a patch for this vulnerability on 04 August 2008.
48
3.2. NETWORK ATTACKS request containing a long, specially crafted, POST command to submit data to be processed by the server. If the input is crafted successfully, this input will exceed a fixed-size string buffer allocated by an Apache plug-in module called mod weblogic on the execution call stack. This allows the attacker to change the return address of mod weblogic. Therefore, if the input contains embedded exploit code, when the return address (provided by the attacker) pointing to the code is reached, the exploit code is executed. This is a classical stack buffer overflow (for more information refer to [97]) which allows attackers to actually execute arbitrary code on a target. Depending on the code executed, it may cause the server to crash (i.e. Denial of Services) or get further compromised [54], e.g. the attacker may gain root access to the server if the shellcode executes with elevated privilege.
3.2.2
Multi-step Attacks
In the attack described above, the attacker will probably be willing to progress beyond the Web server, if opportunity to do so exists. In such cases, the attacker may try further steps to reach more valuable assets deeper into the network. Let’s consider that the database, illustrated in Figure 3.1, is a Microsoft SQL Server 2005, and that the Web server is able to authenticate to the database to retrieve customer details. The database contains the following vulnerability, published in the NVD [161] on 10 Dec 20089 . CVE-2008-5416 description [55]: Heap-based buffer overflow in Microsoft SQL Server 2000 8.00.2050, 8.00.2039, and earlier allows remote authenticated users to cause a denial of service (access violation exception) or execute arbitrary code by calling the sp replwritetovarbin extended stored procedure with a set of crafted parameters that trigger memory overwrite. NOTE: it was later reported that SQL Server 2005 9.00.1399.06 is also vulnerable. Because the Web server is able to authenticate to the database, the attacker could take advantage of its vulnerability CVE-2008-3257 to submit a query to be parsed and executed by the SQL server [68]. The code injected through the query has to be crafted in a way to trigger the heap buffer overflow (i.e. CVE-2008-5416) on the procedure sp replwritetovarbin. Heap memory is dynamically allocated and released by programmers using e.g. functions like “malloc()” and “free()”. If this is not properly done, in this case the sp replwritetovarbin procedure, becomes subject to this kind of buffer overflow, and the attacker can divert the flow to a memory area which contain malicious code. Similar to what happens with the stack buffer overflow, the attacker acquires the ability to actually execute arbitrary code on the target, e.g. a script to compromise the database integrity. 9 No patch was available at the time of writing (January 2009); solution was either upgrade the SQL server or workarounds such as disable the sp replwritetovarbin procedure or run a script to deny public execute permission on the procedure.
49
CHAPTER 3. UNDERSTANDING NETWORK ATTACKS In the way we just described, attackers can progress step-by-step into a network. If there is any vulnerable host in the DMZ zone, this is natural way-in. However, even if there is none, an attacker can penetrate in a network via vulnerabilities in client applications (refer to Section 3.3.2.1) or via exposures. This is the reason why there is a common sense among security practitioners that the network is as weak as its weakest “point”, meaning that any point of entry for an attacker can endanger a network as a whole. Before we review the main types of single-steps that an attacker can take advantage of to penetrate and progress in a network (in Section 3.2.2.2), we define and review the purpose of multi-step attacks next. 3.2.2.1
Definition and Purpose of Multi-step Attacks
An accepted definition of multi-step attack (also called an attack path), among the community of Attack Graphs is: Definition 1 “An attack path [i.e. a multi-step attack] is then a sequence of exploits [here used as synonym for vulnerabilities] sj1 , sj2 , ..., sjl that leads to agoal [goal] becoming true” [111]. However, a multi-step attack is not necessarily only a sequence of vulnerabilitysteps towards a target, but it may have other purposes, as defined next. Definition 2 “Multi-stage [i.e. multi-step] attacks can be orchestrated [i] to strike highly protected targets, [ii] to coordinate waves of scripted exploits and/or [iii] to conceal the true origin of an attack” [209]. The first two purposes of multi-step attacks, relevant in the context of this thesis, drive attacker strategies we review in Section 3.3. Matching Definitions 1 and 2, we see that the Attack Graphs community deals only with the first purpose (as reviewed in Chapter 2). It means that this community aims at uncovering sequences of vulnerability-steps to reach a goal/target. The second aim of multi-step attacks is addressed by other research communities dealing with the propagation of malware such as botnets, worms, and virus10 . As we will see in Parts II and III, this thesis do not extend the scope of the field of Attack Graphs in this particular respect. The thesis contributes in other ways, e.g. by considering the acquisition of credentials as attack step (as we will see next), and by addressing gaps in this research area collected in requirements listed in Chapter 4. Nevertheless, we identify an attacker strategy that, if incorporated to the current solution MsAMS, would allow finding possible attacks with the second purpose, as described in Section 3.3; this is left as an opportunity for future work, described in Chapter 10. 10 Botnets
50
are explained in Section 3.3.3.1.
3.2. NETWORK ATTACKS 3.2.2.2
Main types of Single-steps
After a high-level view on how steps can be composed in multi-step attacks in the previous section, we switch the focus to what actually can represent a single step. This is a difficult question since it depends on the level of abstraction one is considering. A step is an action that an attacker can potentially take from a current location. As we have seen above, the main type of action modelled in the area of Attack Graphs is the action of exploiting vulnerabilities. We have seen in Chapter 2 that vulnerability-steps can be modelled in detailed sets of preconditions, involving both the network and the attacker, which must hold for a step to happen, triggering a set of postconditions, as e.g. [111, 60, 167]. In the example multi-step attack discussed previously, the attacker sends the code to be executed in both the Web server and the database embedded in the HTTP request and the SQL query, respectively. However, there are several other options the attacker could use. For example, the attacker could first download a backdoor tool (e.g. netcat), then execute it to establish the backdoor and further compromise the servers. Therefore, modelling vulnerability-steps in low-level of details is errorprone, time-consuming, and not practical because this level of information, when available in public vulnerability databases, requires manual analysis later stored in private databases. This approach of pre- and postconditions have also been approached with a lighter model of vulnerability-steps based on two attributes: access required and effect resulting from exploitation. We come back to this subject in Chapter 5. For now, we concentrate not on how vulnerability-steps are represented but on which types of vulnerabilities and exposures can potentially be considered as attack steps. The purpose of the following review is to set up the stage for discussion about requirements for the solution in Chapter 4. 1. Vulnerabilities in COTS (Commercial-Off-The-Shelf) and Open Source software components. Known vulnerabilities are the main source of opportunities available for attackers. They are cataloged in public databases, such as the National Vulnerability Databased (NVD) hosted by the NIST11 , in an effort to provide a centralized source of reference information. As part of this NIST initiative, each known vulnerability receives a standard name, called CVE12 , as we have seen before with CVE-2008-3257 and CVE-2008-5416, where 2008 is the year the vulnerability was published (i.e. cataloged) and the four digits which follows form a sequential number. CVE is recognized worldwide and used as reference by security bulletins (e.g. www.securityfocus.com, http://xforce.iss.net, and www.readhat.com), specialized forums (e.g. http://isc.sans.org, and www.modsecurity.org/blog), media (e.g. www. darkreading.com) and security tools (e.g. Nessus [149] and many more [222]); refer to Chapter 5 for an overview of related NIST initiatives. 2. Vulnerabilities in custom software components. 11 National 12 Common
Institute of Standards and Vulnerabilities Vulnerabilities and Exposures [52]
51
CHAPTER 3. UNDERSTANDING NETWORK ATTACKS Another source of opportunities for attackers are software components, or entire applications developed in-house. We have seen how attackers can exploit stack and heap buffer overflows in procedures of commercial products such as the Apache Web Server (by Oracle) and Microsoft SQL Server, as it happens with vulnerabilities cataloged in the NVD as CVE-2008-3257 and CVE-2008-5416, respectively. However, the same type of vulnerabilities can occur e.g. in PHP13 code written by web developers, or not-so-experienced programmers, employed by the organization. Although these vulnerabilities are not, and cannot be, cataloged in the NVD, known vulnerabilities in commercial and open source components are a good source of easy-to-find vulnerabilities that can be used as inspiration to find similar vulnerabilities often present on in-house built software as well. For example, according to recent trend analysis of CVEs [41], PHP remote file inclusion (RFI) vulnerabilities skyrocketed almost 1000% in 2006 compared to previous years. These remotely exploitable vulnerabilities usually derive from “the use of variables in include() or require() statements” [40], which allow an attacker to run arbitrary PHP code on Web servers. 3. Zero-day vulnerabilities. As we have seen in Chapter 1, in average 16 vulnerabilities are published in the NVD every day, according to data from (and including) 2003 to 2008. Although attackers make use of those off-the-shelf vulnerabilities (for which workarounds and/or patches already exist) to launch attacks, e.g. to build botnets, as discussed in Section 3.3.3.1, they are constantly and actively trying to spot new vulnerabilities (for which workarounds and/or patches do not exist). These brand-new vulnerabilities are called zero-day vulnerabilities because the affected vendor/supplier has zero days to deliver a patch for the flaw which is already operational, i.e. for which evidence of successful compromise has been acknowledged. Zero-day vulnerabilities represent an effective source of attack steps, as happened with the Microsoft Internet Explorer [233] flaw discovered as being in use on December 10, 2008 and affecting all versions of IE. It allowed attackers to execute arbitrary code when the victim visited a specific compromised web page. At this point the code self-executed, without any further intervention from the victim. A patch was released on December 17, 2008 (CVE-2008-4844). 4. Exposures allowing the acquisition of credentials. As seen in Chapter 2, an exposure does not imply direct compromise of a host, such as a vulnerability. However, it may represent an important step towards a successful attack because it provides capabilities and information 13 Scripting language used to build dynamic web pages. PHP is a free, easy-to-learn, language which has become very popular over the years.
52
3.2. NETWORK ATTACKS which allow the attacker to, e.g., reach non-vulnerable hosts. For example, the acquisition of credentials (i.e. any sort of information used for authentication, such as passwords, tickets, or session keys), via an exposure, opens further opportunities for attackers. Next we review some example methods that are possible because of exposures, most of them result in credential theft. • Acquire encrypted credentials saved locally Authentication agents may be instructed to keep pass phrases or passwords in memory to discharge users from the need of retyping those at each authentication instance. For example, current browsers, such as Internet Explorer and Mozilla Firefox, (and web applications) provide “remember me” features which automatically fill-in passwords when a user revisits a Web page from the same computer [148]. However, even when passwords are stored encrypted (the password and the web site are encrypted together in this case), there are free tools to decrypt them, like IE PassView [104] which shows passwords saved in the computer hard drive in plaintext, if the corresponding Web sites, accessed via Microsoft Internet Explorer, are found in the history file. Similarly, it is possible to retrieve credentials saved locally by authentication agents in SSH clients, if an attacker has privileged access to the host [184]. This way, attackers can acquire credentials and access further (non-vulnerable) hosts or applications. • Steal plaintext passwords For example, as the SSH server decrypts a user password into plaintext before checking it against the password file, an attacker with sufficient privilege may collect these passwords (as reported by Schechter et al. [184]), and authenticate to other, non-vulnerable, hosts. • Obtain passwords using cracking tools This method allows authentication to one or more hosts or applications; e.g. if an attacker with privileged access to a Unix-based host, gets hold of the shadow file where passwords are kept encrypted, there is a high probability that the attacker will obtain a weak password using password cracking tools (discussed in Section 3.1), if sufficient time is available. Also, if an attacker with privileged access to a host can install a rootkit which contains a key-logger tool, there is a good chance that the attacker will retrieve credentials to access further (nonvulnerable) hosts or applications. • Guess obvious passwords shipped by default Obvious passwords shipped by default is not an uncommon type of exposure. For example, CVE-2008-4296, published in the NVD [161] on 27 September 2008, reports “The Cisco Linksys WRT350N [wireless router] with firmware 1.0.3.7 has ”admin” as its default password for the ”admin” account, which makes it easier for remote attackers 53
CHAPTER 3. UNDERSTANDING NETWORK ATTACKS to obtain access.”. Another example is CVE-2008-6588, published in the NVD on 04 March 2009, that reports “Aztech ADSL2/2+ 4-port router has a default ”isp” account with a default ”isp” password, which allows remote attackers to obtain access if this default is not changed.”. Guessing may also be enough to retrieve obvious weak passwords used by users and administrators to access other hosts in the network, e.g., via SSH once an attacker has compromised their hosts. This knowledge may allow an attacker to penetrate or progress in a network. • Exploit trust relationships among hosts For example, SSH allows rhosts (also used by insecure protocols rlogin and rsh) and shosts (SSH-specific) authentication. In both cases, the SSH server accepts connections from clients listed in its files /.rhosts or /.shosts without requiring the password of the target user account. It allows an attacker who has compromised the client host an easy-toexploit opportunity to access the non-vulnerable server. Trust among hosts may also happen when one credential allows access to more than one host in the network. Single sign-on technologies, such as Microsoft Active Directory, may be an example since authentication on it allows access to services provided by different hosts. • Insert or replace credentials This method can be used if an attacker gains the ability to overwrite a password file. For example, a more secure mode of SSH authentication (compared to the trust mode described above), used in more recent versions, rely on public and private key pairs. After an user (on client Y) has created such a key pair, he can insert the public part on a file called authorized keys (along with the DNS name of Y), and transfer such file to a SSH server X. From this moment on, the user can authenticate on X using only the private part of his key, and does not need to provide an account password. The server SSH relies on the file to determine which keys can be used from an user on Y. If an attacker, maybe through social engineering, convince a user from Y to upload his authorized key file to server X, he acquires the ability to log to X with his private key only. • Obtain credentials via social engineering As mentioned in Section 3.1, this is an efficient method to obtain personal details, specially if the attacker is an insider or an outsider colluding with an(other) insider. The attacker is then able to impersonate legitimate users and gain access to non-vulnerable hosts via some of the methods listed above, for example. Besides, since people tend to see no problem in sharing passwords (in and out of the organization), e.g. “to get work done” [187], obtaining credentials sometimes does not even require social engineering. 54
3.3. ATTACKERS STRATEGIES AND TYPES OF MULTI-STEP ATTACK Per our review of existing attack graph approaches in Chapter 2: the main focus of the Attack Graph community is on single steps represented by the exploitation of vulnerabilities in COTS and Open Source software components. Zero-days vulnerabilities can also become single-steps if they are considered via hypotheses in what-if analysis. However, the acquisition of credentials (via exposures or not) is not considered as single steps of an attack. As seen in Section 2.2.3.6 on page 36, credentials are not represented as a separate entity by current attack graphs and, as a consequence, they are not acquired but automatically given. We consider this as an over-simplification of the reality. In fact this acquisition is an important part of the dynamics of attacks and may result in success or not. This aspect motivates requirement R2 , as we will see in Chapter 4. The reader should keep in mind that the steps reviewed here are main types of single step. We will see in Chapter 7 that an attack may perform other steps in between (e.g. access a service).
3.3 Attackers Strategies and Types of Multi-step Attack In this section, we identify classes of attackers, and strategies they can use to achieve the first two purposes of multi-step attacks uncovered in Section 3.2.2.1: [i] to strike highly protected targets, [ii] to coordinate waves of scripted exploits. It is interesting to notice that those multi-step attack purposes can also be regarded as attackers objectives. In fact, different attackers objectives and strategies14 motivate different types of attack, also reviewed in this section. The relationship between attackers classes, objectives and strategies, with types of attack is illustrated in Figure 3.2. main objective is motivated by determines
class of attacker uses
main strategy
to launch
specific types of attack
Figure 3.2: Relationship between classes of attackers, objectives and strategies, with types of attack
14 This
term has been introduced in Section 2.1 on page 15.
55
CHAPTER 3. UNDERSTANDING NETWORK ATTACKS
3.3.1
Classes of Attackers
We assume, like many other researchers [49, 185, 129], that attackers are rational. It means they do not take random actions, instead they follow a strategy when launching an attack (i.e. when choosing among alternative steps during an attack), which depends on an objective. We identify two classes of attackers: target-driven and fame-driven, discussed next. Target-driven attackers are a generalization of profit-driven attackers, as described by Leeson and Coyne [122]. The latter is a class of attackers motivated by greed of financial benefit. Typically, they perform server-side attacks (see Section 3.3.2.1 below) toward targets which are assets with high perceived value, such as a database or a file server. Fame-driven attackers are motivated by notoriety, and “fame” is a function of inventiveness and severity [122], which raises peer recognition and media attention. Instead of acquiring direct benefit from targets, most of the time, this class of attackers gain indirect benefit from the magnitude of disruption caused to the defender. Therefore, they aim at recruiting the maximum number of assets to launch attacks. Note that with this main objective of maximum number of assets, this class of attacker can also reach direct benefit from the structure recruited. Typically, they perform attacks involving botnets (see Section 3.3.3.1) or worms15 . As mentioned already, although botnets can be used for profit, e.g. they can be rented per hour [113] or used for identity theft [15], the primary objective of attackers in this case is to recruit the maximum botnet structure they possibly can. Each of these two classes will choose different strategies, and will be able to launch different types of attack, explained next. The reader should keep in mind that, since we take the approach that finding attacks in a modelled network is an optimization problem, we need metrics (as mentioned in Section 2.2.3.4 on page 34) to find attacks. These strategies put metrics into perspective and determine the type of attacks that can be found.
3.3.2
Attacker Strategy: Best Cost-benefit from an Attack
Target-driven attackers seek for the optimal net benefit from an attack, i.e. the best expected value gained with the less cost. Using this strategy, defenders can proactively uncover possible sequential attacks (server-side and client-side attacks, discussed in the next section). Recall from Section 2.2.3.4 on page 34 that only a few attack graph approaches take metrics into account to find attacks that reach a target, and that these metrics are assumed given (we come back to this point in Chapter 4). However, we believe that considering these metrics better captures the economic aspect of network attacks, discussed in the next section. 15 A computer worm is a self-replicating computer attack tool that propagates across a network, spreading from vulnerable to vulnerable system [210].
56
3.3. ATTACKERS STRATEGIES AND TYPES OF MULTI-STEP ATTACK Note that attackers do not know the exact topology of the network, prior to an attack attempt. Therefore, from each actual position, an attacker has to estimate the cost that each alternative step available represents against an expected gain. Only then the attacker can choose for the best option(s). 3.3.2.1
Server-side and Client-side Attacks
Server software listens, i.e. waits for requests, on specific ports on the network, and provides services or interfaces to remote users, while client software issues those requests from remote or local users, and waits for a response from the server [97]. Client software, embedded in several applications such as Web browsers, media applications, word processors and spreadsheets, is able to execute code received as input from servers. Similarly, server software receives input requests from clients to query databases, perform system calls and file manipulation. Hence, servers respond to and control client software. As a result, attackers behind a client software (or directly through backdoors tools, mentioned previously) can send requests which exploit vulnerabilities in the server software and benefit from their effect, or they can send requests directly to another client software such as in P2P16 networks (e.g. via instant messaging, VoIP and file sharing applications). It means that an attacker, from a remote client, can gain access to a network either via a vulnerability in a server, called server-side attack, or via a vulnerability in a client, called client-side attack. Figure 3.3 illustrates schematically the server- and the client-side attack mentioned17 . In Figure 3.3(a) we see an attacker located outside a network, and how hypothetically s/he could exploit a vulnerability in a server (e.g. a Web server) bypassing the firewall to finally reach a target (e.g. a SQL database) via multiple sequential steps. In Figure 3.3(b) we see an attacker located outside a network, and how hypothetically s/he could exploit a vulnerability in a client (e.g. a workstation) directly from outside the network to finally reach a target (e.g. a SQL database) via multiple sequential steps. The best cost-benefit strategy allows a defender to proactively find possible server- and client-side attacks that reaches a target, provided that vulnerabilities in servers and clients of the network are represented.
3.3.3
Attacker Strategy: Best Coverage of a Network
Fame-driven attackers seek for the best coverage of the network, i.e. the maximum number of compromised hosts (which allow the execution of code) per unit of time. 16 peer-to-peer 17 Note that the expression “client-side attack” can also refer to the propagation of an infected server to clients that access it, such as the mass exploit attack by SQL Injection published in January 2008 [234]
57
CHAPTER 3. UNDERSTANDING NETWORK ATTACKS
server attacker
client
attacker target
firewall
target
firewall
LAN
Network
(a) Server-side attack: point of entry is a remote server vulnerability reachable via the firewall
LAN
Network
(b) Client-side attack: point of entry is a remote client vulnerability reachable directly from the internet
Figure 3.3: A schematic representation of a sequential attack launched by targetdriven attackers This strategy mimics attackers in the process of building a botnet in the defenders’ network, but also allows defenders to anticipate and discover the susceptibility of their network to botnet. Actually this strategy allows finding several types of attack, not only botnets, where network coverage is the primarily objective, such as propagation of malware like worms. However, botnet is a representative type of attack for this strategy, and is well studied in terms of metrics. Two botnet metrics, borrowed from Dagon et al.[58], determine the best coverage of a network: • Botnet effectiveness measures the botnet size, i.e. the largest connected portion of bots (i.e. recruited nodes) in the network graph which can participate in a botnet attack. • Botnet efficiency measures the botnet diameter, i.e. the average length of the shortest path connecting any two pair of bots in the network. Effectiveness is an indication of the magnitude of disruption (or damage) which can be caused by the botnet. While efficiency is an indication of how well the communication between the attacker and the bots will be. The larger the botnet diameter, the slower is this communication, i.e. the flow of commandand-control messages, update of botnet code and the feedback of information gathering. 3.3.3.1
Botnet Attacks
Botnets are a network of autonomous agents (i.e. robots or bots) controlled by an attacker. They are autonomous in the sense that they (re)act with minimum human interference. Traditional botnets use “Command and Control” mechanisms, 58
3.3. ATTACKERS STRATEGIES AND TYPES OF MULTI-STEP ATTACK such as IRC channels18 ), to scan (i.e. recruit), exploit and infect a network, and later for their usage for different purposes [15]. Thus, in this case, the attacker performs the setup of IRC servers or uses already available ones to act as botnet controllers. Malware is installed on these controllers to scan for reachable and vulnerable hosts. Usually botnets exploit known vulnerabilities which allow the execution of code. This process of recruit-exploit-infect is recursively repeated (according to instructions contained in the malware) creating a network of vulnerable hosts acting as bots19 . Each bot has either a dynamic DNS name of the IRC server or its hard coded IP address. After been infected, the bots authenticate themselves to an IRC channel on an IRC server and wait for control commands. The attacker remotely authenticates himself to the IRC servers (i.e. the bot controllers) to actually control the botnet. In the end, the attacker has the control of a tree or a forest of infected hosts where each leaf becomes an attacking host, i.s. a bot. Refer to Zou and Cunningham [236] for advances on botnet structure from centralized IRC-based to distributed P2P-based botnets. bots attacker
LAN IRC servers
Network
bots
Figure 3.4: A generic IRC-based botnet Although researchers (e.g. [113, 58]) and the media report large-size botnet of tens of thousands of nodes, there is evidence [45] that botnets are shrinking in size. The reason is twofold. First, smaller botnets are harder to detect and easier to trade. Second, because even a few hundreds of nodes with broadband connection of 1Mbps can saturate high speed connections (155Mbps) used by large organizations. Thus, botnets used to attack organizational targets can be formed inside the organization itself and having a view of the potential of botnet infection becomes valuable for planning defense strategies. Thus, botnet threat can affect an organization in two ways because the attacker can recruit bots inside a LAN to attack somewhere else, involving litigation issues to the organization, and because 18 Internet Relay Chat channels allow real-time communication from one host to another or to many. 19 The propagation process of botnets, i.e. recruit-exploit-infect, is similar to the process used by worms and virus [15]. However, botnets are more flexible because they serve for a larger set of purposes.
59
CHAPTER 3. UNDERSTANDING NETWORK ATTACKS the target can be inside the organization itself. Figure 3.4 represents a botnet schematically. In this figure we see the three elements involved in botnets: an attacker, IRC servers under the control of the attacker, and bots under the control of IRC servers. There are 3 basic methods for dealing with botnet threat [45]: (1) prevent systems from being infected, (2) detect “command and control” traffic, or (3) detect secondary evidences such as propagation and attack behavior. Therefore, even better than investing on detective measures (approaches 2 and 3), is to proactively identify the structural susceptibility of a network to botnet attacks, the first approach.
3.3.3.2
Distributed Denial of Services Attacks
DDoS (Distributed Denial of Services) attacks can render a target unavailable for legitimate users, sometimes bringing it to crash. In fact, DDoS (an evolution from the traditional Denial of Services (DoS) attack) is composed of two stages. The first stage is responsible for infection of the networks. Botnet is the most used [15, 113] way of infection. In this case, botnets controllers are called “masters” and bots are called “zombies”. The second stage is responsible for reaching a target from the zombies, a kind of server-side attack. However, specific to DDoS is the synchronization required in the launch stage, responsible for consuming the resources of the target. It means that the volume of simultaneous requests reaching a server software (called attack rate [142]) needs to exceed the target’s capacity of response, otherwise the (D)DoS attack is not successful. Figure 3.5 illustrates a generic DDoS attack, where the infection phase (Figure 3.5(a)) is achieved via botnet. The IRC servers are called “masters” in the DDoS terminology and the bots are called “zombies”. The launch phase (Figure 3.5(b)) is the actual use of the botnet which, in this case, has the specific purpose of compromising the availability of the target. Therefore, as we can see, DDoS is an example application of botnets. zombies
zombies
attacker
attacker
LAN
LAN
target
masters
target
masters
zombies
Network
(a) Infection phase (via botnet)
zombies
(b) Launch phase
Figure 3.5: A generic DDoS attack (adapted from [88]) 60
Network
3.4. ECONOMICS OF NETWORK MULTI-STEP ATTACKS Note that DDoS attacks mix both strategies, i.e. best cost-benefit and best coverage. For the first stage of infection, the best coverage strategy applies, while for the second stage of launch, the best cost-benefit strategy applies. It means that, after recruiting the more effective and efficient botnet, the aim of the attacker is to reach a target perceived as valuable, therefore, there are types of attack that specifically involve one strategy, and there are others that involve more than one strategy. In summary, in this thesis we focus on: → target-driven attackers, as seen in Section 3.3.1 → that have as main objective “to strike highly protected targets”, as seen in Section 3.3 → therefore, use best cost-benefit strategy, as seen in Section 3.3.2 → to find sequential (either server-side or client-side) attacks, as seen in Section 3.3.2.1 However, other strategies can be incorporated to the proposed solution, such as the best coverage. This will remain as opportunity for future work, discussed in Chapter 10.
3.4 Economics of Network Multi-step Attacks Network attacks do not only involve the risk of attacks, i.e. the simultaneous presence of vulnerability and threat, as illustrated in Figure 2.1. It also involves economic-related aspects, such as the ones listed next. 1. Asset value. In Section 2.1 on page 15 we mentioned that asset value represents the relative value and importance of an asset. Besides that, we emphasized that it is stakeholder-specific. Legitimate stakeholders (including asset owners) perceive this value relative to the impact of loosing or damaging the asset, while attackers perceive this value as relative to how much the asset is worth on the black market, the indirect benefit of new opportunities the compromise of the asset may bring (e.g. in terms of alternatives of attack steps), or the indirect benefit gained from the disruption that compromise may cause to legitimate stakeholders. The perception of asset value for these two disparate categories of stakeholder, i.e. legitimate and illegitimate, are different. However, because the gain an attacker can obtain from the compromise of an asset is unknown, we will assume in this thesis, quite reasonably, that a high value asset from the perspective of the organization, will also be a high value asset for the attacker because the latter is able to recognize potential market value of the asset and magnitude of disruption the compromise of the asset may cause to the former. Therefore, assets with high value for the organization are potential targets for attackers. However, determining asset values from the perspective of the organization 61
CHAPTER 3. UNDERSTANDING NETWORK ATTACKS is also a challenge. For example, according to CRAMM20 User Guide [218], physical assets (such as a host) should be valuated in terms of replacement and reconstruction costs. However, their value is affected by the asset value of data and software application assets that depend or are stored on them. Therefore, CRAMM suggests interviews with asset owners to: (i) identify and understand the nature and function of each of those assets, and (ii) to determine possible worst case scenarios that could impact the asset, in terms of the information security properties mentioned in Section 2.1 on page 15. The next stage involves translating those scenarios into a scale 1-10 that reflect the consequences, for the organization, if the asset is really impacted. This last stage is supported by guidelines determining which factors (in total 14) should be taken into account to analyze the scenarios, e.g., personal safety, legal and regulatory obligations, financial loss, commercial and economic interests. CRAMM tool, then, consolidates the intrinsic asset value of a physical asset with the asset values implied by data and software assets related to it to derive a single financially-based asset value for the physical asset. As we can see, the valuation of assets depends on expert judgement and involves several stakeholders (at least asset owners, and evaluators). Therefore, disagreements and inconsistencies among them are inevitable, despite the use of guidelines and best practices. A way to overcome this problem is the aggregation of disparate expert opinions such as the one proposed by Houmb [99]. Furthermore, not only the valuation of assets is difficult to determine because it involves either tangible and intangible variables, hard to quantify, but also the identification of the constituent assets for valuation is also a complex task. Last, but not least, valuation of assets is context-specific, as we can see by looking at the stages involved and, hence, no cross-organizational reuse of valuation is possible. As a consequence, asset values at the scale of a network are hardly readily available. We will see in Chapter 4 that this aspect motivates requirement R3 with the purpose of determining targets. 2. Cost of attack step. Cremonini and Martini define cost of an attack as “the perceived cost sustained by the attacker to succeed [i.e. to successfully perform each attack step]” [49]. It is a very broad concept which may involve a large spectrum of costs, e.g., material costs such as computers, Internet connection, and tools. However, this cost is unknown, and may even be irrelevant nowadays, such as the cost with computers and Internet. In terms of tools, we are back to the discussion we had in item 7 on Section 3.1 about “time, effort or resources a threat agent needs to execute an attack”. There, we discussed that the high availability of ready-to-use tools and attack automation put 20 Risk Analysis and Management Method developed by the UK Government, and currently operated and maintained by Siemens Enterprise Communications Limited (www.cramm.com).
62
3.4. ECONOMICS OF NETWORK MULTI-STEP ATTACKS these attributes into a different dimension. Therefore, a quantitative estimation of cost based on expected time, effort and resources needed to launch an attack step can only be obtained via expert judgement and, as a consequence, is stakeholder-specific and subjective. Some researchers adopt a relative approach for cost estimation. Chinchani et al. [38] use cost metrics as a relative quantity defining the amount of deterrence offered by one security measure compared to another. Howard et al. [103, page 12] also take a relative expert approach to assign weights to channel types. Similarly, we considered in [70] cost as a measure of difficulty that an attacker encounters to bypass channels implementing different protocols (e.g., FTP, SMTP, SSH, VPN) to progress across network nodes, as described in Chapter 6. Therefore, the cost of each of these channels are assigned based on a relative approach by comparing protocols in terms of the level of security they provide, determined e.g. by their encryption algorithms and authentication methods. However, again, any of these relative approaches depends on manual evaluation by experts and, consequently, subjectivity becomes a major issue. Besides, a relative approach works fine when the set to be evaluated is rather small since it requires pairwise analysis, hence, scalability and consistency may also become an issue. Other researchers consider cost in absolute terms, but consider attributes to cost that are simply not available in large scale. For example, Liu et al. [129] consider the risk of an attacker being traced or arrested as part of the cost of attack. We neglect this aspect because, in our view, it is attackerspecific and difficult to generalize. Other researchers [87], mentioned in Section 2.2.3.4 on page 34, rely on complicated schemes to assign cost based on several attributes of vulnerabilities, attackers and attacks. Again, they do not scale, are stakeholder-specific and subjective. Despite these differences in approaches to estimate cost of an attack step, it is important to recognize cost as a measure that allows reasoning about attackers trade-off when selecting among alternatives of attack steps, as mentioned in item 4 below. In summary, cost measures should scale, should be absolute, consistent and comparable, i.e. should not be stakeholderspecific and subjective. We will see in Chapter 4 that this aspect motivates requirement R5 . 3. Risk of attack. Risk of attack is the potential that a given threat agent will exploit one or a set of vulnerabilities of an asset or group of assets and thereby cause harm to the organization. It is measured as a function of the likelihood (or frequency) of exploitation and impact resulting from a successful exploitation (adapted from [108, 202]). The analysis of identified risks can be qualitative or quantitative. On the one hand, the former, usually adopted by standards used to evaluate security such as the Common Criteria [37], and the ISO 27k series (e.g. [107]), 63
CHAPTER 3. UNDERSTANDING NETWORK ATTACKS is more descriptive and therefore more intuitive and flexible. However, it requires a clear definition of syntax (i.e. of scales, e.g. “high”, “medium”, “low”) and semantics (what does level “high” mean for impact of an attack?; what does level “high” mean for likelihood of an attack step?). Additionally, qualitative analysis works at the level of order of magnitude, and is subjective, biased by the interpretation of standards by the evaluators, plus their own experiences. On the other hand, the latter requires only the definition of semantics (what does 0.8 likelihood for an attack step mean?). Nevertheless, “the quality of the analysis depends on the accuracy and completeness of the numerical values and the validity of the models used” [11]. In addition, quantitative analysis of risk faces a major challenge which is the scarce availability of historical data to derive e.g. likelihood21 . Despite this challenge, “risks cannot be managed better until they can be measured better” [8]. Therefore, quantitative risk analysis is preferred compared to qualitative analysis because it allows reasoning about trade-offs (discussed in the next item). Although we share this vision, recall that the goal we aim to address in this thesis, mentioned in Chapter 1, is goal G1.1.1: Identify possible network attacks, and that assess the risk derived from these possible attacks (G1.1.2) is out of the scope of this thesis. 4. Attacker and Defender Trade-offs. Security is about trade-offs. We assume that not only defenders are rational but attackers are rational too, as mentioned in Section 3.3. Under this assumption, both aim at the highest possible return of their investments in the presence of alternatives. It means that attackers when faced with alternatives that result in the same benefit, will choose for the lower cost option. Similarly, defenders will try to balance the benefits derived from countermeasures with the cost of adopting them. Therefore, attackers and defenders perform cost/benefit analysis for decision making. Attackers’ trade-off involve the gain from a successful attack, i.e. the perceived asset value of a target (for target-driven attackers) or the perceived magnitude of disruption caused (for fame-driven attackers), versus the perceived cost for performing an attack step. Since these gain and cost are not available for defenders, as discussed previously, the trade-off for the attacker can be restated as: asset value of a target, as perceived by defender (approximating the notion of gain from attack), versus the cost of attack steps for attackers, as perceived by the defender. This approach allows the defenders to get awareness about risk of possible attacks. Defenders’ trade-off involves evaluating the risk of attacks versus the cost of implementing and maintaining countermeasures to mitigate those risks, both as perceived by the defender. 21 An initiative to reverse this lack of metrics is the CVSS (Common Vulnerability Scoring System), funded by the U.S. Department of Homeland Security and maintained by FIRST22 (www.first.org). We explored this initiative to derive the risk level of a system in [102, 100].
64
3.4. ECONOMICS OF NETWORK MULTI-STEP ATTACKS As just mentioned in the previous item, in this thesis we focus on goal G1.1.1 (Identify possible network attacks) using attackers’ trade-off, as perceived by the defenders and emphasized above, to search for possible attacks in the network. Not part of this thesis is the next stage related to actually assessing the risk they represent. This assessment allows defenders to perform trade-off analysis and develop business cases when applying for budget to hardening network security [84].
65
4
Solution Requirements At this point we have reviewed related work, in Chapter 2. We have also reviewed, in Chapter 3, what makes networks vulnerable to attacks, main types of singlesteps, classes of attackers (i.e. threat agents), their main objective, and strategy to launch different types of attack and, finally, economic-related aspects which play an important role in network attacks. From both reviews, we identify existing gaps, described in Section 4.1, and derive a list of requirements for the solution, described in Section 4.2.
4.1 Gaps Analysis Despite all progress in the field of Attack Graphs, there are areas where improvement is still needed (summary in page 41). 1. As we seen in Section 2.2.3.3 on page 31, attack graphs are still difficult to understand by people since they do not fully represent the network topology (i.e. entities relevant for the domain of network attacks and network hierarchy) needed to relate the model to the real network. Current approaches to this problem rely on techniques such as grouping, aggregation, clustering, treemaps, and prioritization of graph nodes, but nevertheless the network topology remains not completely represented. We identify next two aspects which are lacking from current approaches. • Firewalls are not clearly represented. They are considered only for the calculation of (inbound) reachability. As a consequence it becomes difficult to relate paths identified in the graph to the network itself, and to support decisions about countermeasures. For example, if several firewalls are traversed by an attacker it may be difficult, e.g., to identify which ones should be changed, since they are not explicitly represented in the graph. • Network topology (to some extent) is added to the model a-posteriori and is not part of the modelling activity itself. As a consequence, the hierarchy is not viewed as a top-down, refinement process, where a 67
CHAPTER 4. SOLUTION REQUIREMENTS subnet contains hosts, a host contains services, and so on. Instead, the network is considered as flat, and the hierarchy is added bottomup as an afterthought. For example, in current approaches, after the attack graph is generated, hierarchy can be incorporated based on rules and context information that provide semantics or based on visual positioning of subnets (e.g. treemaps) which aim to guarantee that the hierarchy is not added ad-hoc but is rather meaningful and represents the real network. Therefore, there is a need for improving the representation of network topology. 2. As discussed in Section 3.2.2.2 on page 51, the acquisition of credentials is a type of single step an attacker can take advantage of. Current approaches which deal with this aspect, reviewed in Section 2.2.3.6 on page 36, remain rather static and worse-case based, i.e. those approaches do not incorporate any uncertainty. They basically rely on pre- and postconditions. Hence, if an attacker reaches a specific level of access on a host which has a credential as postcondition, it is considered that the attacker automatically fulfills this credential postcondition, and can access any reachable host which has this credential as precondition. However, pre/postcondition pairs are memoryless and, therefore, an acquired credential must be used in the next attack step. An alternative approach found in the literature uses the same concept of pre- and postconditions but incorporates the notion of exposure: if the user of a host meets some condition (e.g. is labelled as “security incompetent”), again, it is assumed that an attacker which gains access to the host, automatically fulfills the credential condition. Nevertheless, in none of these approaches, credentials are distinct entities, thus, is not possible to: • represent that an attacker may gain access to a host due to credentials acquired more than one step ago, i.e. these approaches are unable to represent credential theft, but can only represent trust relationship between two hosts • represent uncertainty that an attacker may or may not acquire a credential even when an exposure which allows this acquisition exists; maybe because the attacker overlooked and did not find the exposure, therefore, if an attacker reaches a host that requires a credential, and if this credential is not already known to the attacker, she has to search for this credential • perform what-if analysis related to credentials and their dynamics Therefore, there is a need to simulate attack dynamics. 68
4.1. GAPS ANALYSIS 3. As we seen in Section 2.2.3 on page 27, some algorithms to generate attack graphs consider (i) all possible attack paths. Hence, it is as if every node in the network would be a potential target [105, 229]. Other algorithms require (ii) the direct assignment of a target, assuming that potential targets are common knowledge [164, 196], or the indirect indication of targets, assuming that (iii) asset values are given [70]. The first type of approach is advantageous for analysis of the network as a whole. However, it finds attacks reaching irrelevant hosts. Therefore, asset values (assumed given) are needed a-posteriori to assign priorities to attacks found. The second type of approach is fine, assuming that the network administrator has complete knowledge about potential targets on the network. The third type of approach has the drawback that it is dependent on given asset values, the same way as the first approach turned out to be as well. As we have seen in Section 3.4 on page 61, financially-based asset values are not available for an entire network for many reasons. All in all, asset valuation is a complex, time-consuming and subjective process. Besides, even when using guidelines and best practices, different legitimate stakeholders tend to diverge in valuation, and inconsistencies may then arise. Furthermore, the valuation of assets is also context-specific, hence, no cross-organizational reuse of valuation is possible. What happens in practice, in the end, is clear in the following statement from authors of NetSPA (refer to Chapter 2), recently turned into the commercial tool GARNET1 [229], “Asset values currently default to 10 for all hosts and are typically hand-assigned to higher values for critical hosts, such as key servers or hosts containing confidential information”. Therefore, this type of approach in fact assumes, as the second type of approach does, that potential targets are always known. Therefore, there is a need for objective, consistent and comparable asset values that are computed automatically, and can be useful for the assignment of potential targets. 4. As we have seen in Section 2.2.3 on page 27, the majority of attack graphs do not consider cost metrics to find possible attacks. Only a few approaches that follow the stream of optimization consider cost metrics a-priori. However, cost metrics incorporated to the process of search itself capture economic aspects and allow considering different strategies, to find different types of attack, as discussed in Section 3.3 on page 55. For example, the strategy of best cost-benefit can incorporate the trade-off of the targetdriven class of attackers with information available for the defender, by considering asset value of a target, as perceived by defender (approximating the notion of gain from attacker), versus the cost of attack steps for 1 Graphical
Attack Graph and Reachability Network Evaluation Tool.
69
CHAPTER 4. SOLUTION REQUIREMENTS attackers, as perceived by the defender. This strategy allows uncovering sequential attacks, and is the focus of this thesis. However, we have also discussed in Section 3.4, on page 61, that metrics of cost are not available in large scale, since they are usually dependent on information that is difficult to obtain, and cannot be automatically retrieved. As a consequence, the estimation of cost rely on expert judgement, e.g., based on a relative approach involving pairwise comparisons. It means that, unless the same stakeholder evaluates the costs involved with all entities represented in the network model, values most probably will not be comparable and consistent, and will not be useful for implementing the best cost-benefit strategy. Therefore, there is a need for a cost metric that scales, is objective, consistently and automatically calculated following a rationale, and is absolute allowing comparison between alternative attack steps.
4.2 Requirements for the Solution From the above gaps, and additional information from Chapters 2 and 3, we identify the following solution requirements. R1 The solution should permit full representation of the network topology. This is reflected in two aspects. First, there are a number of entities, either physical (e.g. hardware) or logical entities (e.g. subnets), which need to be represented to model the network the closest as possible to the real network. Second, the model should represent the hierarchy of the network determined by firewalls, as well as by logical grouping of hosts. This is required to better relate the model with the real network. As a consequence, network administrators can recognize the real network via the model, e.g. for executing what-if analysis, maintaining the model up-to-date, and relating attack paths identified in the model to the network itself. Therefore, we should be able to represent: – firewalls – subnets, LANs (Local Area Network) and VLANs (Virtual LAN) – hosts – network services – TCP & UDP ports and protocols 70
4.2. REQUIREMENTS FOR THE SOLUTION – vulnerabilities – vulnerability attributes – attackers – credentials R2 The solution should permit the representation of attack dynamics and network dynamics. These dynamics involve the ability to represent acquisition, movement or replication of resources, and the ability to use these resources at any step of the attack, as seen in the previous section. Besides, a network is to some extent a reactive system since it reacts to requests initiated by actors, either users or threat agents, from inside or outside its outer perimeter. Since the spectrum of possible behaviors, from attackers, is vast and unknown, we have to execute the model in different ways, i.e. we have to perform simulations2 , using metrics available for the organization (treated in requirements R3 and R5 ) in an attempt to anticipate possible attacks. Concrete examples of attack and network dynamics: – change in firewall rules, e.g. expand connectivity due to new business demands – change in network security policies, e.g. restrict connectivity due to past attacks – movement of assets, e.g. due to relocation of hosts – deployment of new assets, e.g. new firewalls, new hosts or new network services – mobile code, e.g. malicious code which travel across a network – credential theft allowing the exploitation of non-vulnerable hosts, e.g. by means of credentials acquired not necessarily in the previous step – patch of vulnerabilities R3 The solution should allow for reasonable automatic estimation of asset values, useful for assignment of potential targets. As discussed in the previous section, asset value is hardly available for an entire network. However, they can be a useful instrument to assign potential targets, if they are consistent, objective, and comparable. Therefore, the solution should provide an alternative, large-scale approach to calculate asset values to support the selection of targets. 2 Simulation, according to Merriam-Webster [137], is the imitative representation of the functioning of one system or process [the real system] by means of the functioning of another [the system model].
71
CHAPTER 4. SOLUTION REQUIREMENTS R4 The solution should allow the investigation of hypotheses, via what-if scenarios. What-if scenarios allow network administrators to make hypotheses and investigate new opportunities they may bring to attackers. For example, these hypotheses may relate to changes in the network topology or network configuration, to hypotheses about attackers or about vulnerabilities. What-if scenarios should involve minimum effort to be considered practical, therefore, not requiring to re-process the whole attack graph or re-build the network model. We take as example the following what-if scenarios: – hypotheses about initial attacker location and resources, e.g. the attacker can initially be located inside or outside the network, and can have previous knowledge of a credential – hypotheses about exposures which disclosure a credential if the attacker finds it during an attack; as a consequence, the attacker is able to penetrate non-vulnerable hosts via services protected by the credential – hypotheses about zero-day vulnerabilities, e.g., the network administrator learns that a vulnerability of a certain type is in use in the wild, as described in Section 3.2.2.2 on page 51, and s/he knows it potentially affects a server in the network, the question is which attacks can arise from this hypothesis – hypotheses about vulnerabilities in custom software components with similar objective as the previous item – hypotheses related to attackers strategies like the ones identified in Chapter 3, e.g. best cost-benefit from an attack or best-coverage of a network; hypothesizing about strategies allows the defender to anticipate the susceptibility of the modelled network to different types of attack. R5 The solution should provide automatic estimation of expected cost of an attack step. As discussed in the previous section, a cost metric is essential for representing the best cost-benefit strategy, used by the target-driven class of attackers, focus of this thesis. However, there are no large-scale metrics available which fulfils this need. Therefore, the solution should provide an alternative cost metric, automatically computed, that is objective, consistent and comparable, and allows automatic reasoning about the selection of attack steps among feasible alternatives. 72
4.3. SOLUTION DIRECTION
4.3 Solution Direction From the requirements of the solution listed in the previous section, we envision the following solution direction: Mobile Ambients with Optimization. This direction is supported by algorithms from the domain of Link Analysis Ranking. Mobile Ambients as modelling paradigm. Ambients are a place with a perimeter, or a closed box, where processes run [36]. An ambient can recursively contain other ambients, defining a nesting of ambients. The concept of Ambients is central to the so-called Mobile Ambients, introduced by Cardelli and Gordon [35]. Mobile Ambients is a process calculus (i.e. Ambient Calculus) which allows the modelling of all aspects of mobility, i.e. mobile computing (mobility of devices or system components) and mobile computation (mobility of agents, i.e. processes, across devices). We use the hierarchy of ambients to represent network topology, and mobility to model network and attack dynamics. Optimization as simulation paradigm. Combinatorial Optimization is used for finding good solutions for problems where exact solutions would be unfeasible or too demanding in terms of time or space required for computation [44]. A typical optimization process involves: (i) a formal representation of the solution which allows its automatic computation, i.e. the representation of an attack step in a variant of Mobile Ambients, (ii) a search engine which implements a heuristic method for expanding a solution according to a fitness function, i.e. the computation of attack steps that can reduce to compose multi-step attacks, and (iii) fitness functions which measure the quality of a solution, i.e. functions for the selection of best candidate attack steps, according to metrics. Link Analysis Ranking as support. Link Analysis Ranking is used for providing metrics for the optimization process. Basically it fulfills two purposes. First, to automatically calculate asset values useful for the assignment of targets that feed the search for possible attacks. Second, to automatically calculate a measure of cost for each attack step, useful for determining fitness functions. Google’s PageRank [27] and authority scores from HITS (Hypertext Induced Topic Search) [116] algorithms provide two views of connectivity-based asset values, while HITS hub scores provide connectivitybased cost metrics.
73
Part II
Proposed Solution
75
Background on Heuristic Search
search space
The field of Combinatorial Optimization in Mathematics aims at finding the best discrete element, or solution to a problem, from a set of alternatives. It is largely employed in Computer Science (e.g. in Artificial Intelligence) to find solutions to problems for which no exact optimal solution exists or to find good solutions when the exhaustive search for the optimal solution is prohibitive in terms of computational resources (e.g. computing time and/or space) [44]. The process of searching for a good, non-exact solution (called heuristic search), can be either uninformed or informed. Uninformed search is a blind and mechanical process which does not take into account any problem-specific information for the selection of alternatives. For example, it can consider always the first option, or all options. While informed search depends on an evaluation of possible options, taking into account context information. This evaluation follows an heuristic, i.e. an educated guess, based on a function or metrics used to eliminate options considered not promising. For example, it can consider the best or a set of n best options. A search can be a constructive method or an improving method. The former explores the search space building up the solution from an initial state, that does not represent a solution but is a “seed” from which the solution is constructed, to a final state, that represents a solution, as illustrated in Figure 4.1. At each iteration or cycle of the method, an element is incorporated to the solution. The latter explores the solution space from an initial solution, also illustrated in Figure 4.1. At each iteration or cycle of the method, the quality of a slightly changed solution is checked using an evaluation function. Optimization methods like Simulated Annealing and Genetic Algorithm [175] perform heuristic and improving search.
constructive methods
solution space improving methods initial solution
improved solution
Figure 4.1: Constructive and improving methods in heuristic search Evolutionary algorithms form a special class of heuristic search. They mimic the evolution of species (e.g. Genetic Algorithm) or the behavior of some species (e.g. Ant Colony Optimization) to improve a set of initial solutions. The term 77
fitness function comes from this class of search algorithms, where solutions are evaluated according to how fit they are, in analogy to species. This term may be extended for any evaluation function in optimization methods; we adopt this broader interpretation in this thesis.
Why using Heuristic Search Exhaustive search when used to build attack graphs with model checkers has demonstrated to be prohibitively expensive, as reported by early state enumerationbased approaches reviewed in Section 2.2.3.1 on page 28. This first generation of attack graphs have proven unfeasible for practical use, e.g., it can take 2 hours to generate an attack graph for a network with 5 hosts and 8 vulnerabilities using model checkers. The alternative found by researchers in this area was the exploit-based graph which explores dependencies among vulnerabilities and other security attributes in terms of pre- and postconditions3 , as described in Section 2.2.3.2 on page 29. This basically restricts the search to vulnerable hosts. Therefore, this second generation of attack graphs was able to overcome the scalability barrier of the first generation, making them more suitable for practical use. However, this approach is still limited because it cannot use metrics in the process of search for attacks and, as a consequence, cannot incorporate attacker strategies, like the best-cost benefit strategy used in this thesis. In addition, this approach cannot deal with attack dynamics, like credential theft and, as a consequence, misses attacks derived from such dynamics in well managed networks. From those and other gaps (analyzed in Section 4.1) we have set requirements for our solution in Chapter 4. We explore an alternative approach, since we take the perspective that finding attacks in a modelled network is an optimization problem. This way we can have a richer representation of the network (adapted from Mobile Ambients), e.g., with credentials, firewalls, and use context information in terms of metrics, without loosing control of scalability. Therefore, we take this perspective, i.e. constructive heuristic search, in both our preliminary solution ELAS (Evolutionary Learning of Attack Scenarios), described in Chapter 6, and in our solution MsAMS (Multistep Attack Modelling and Simulation), described in Chapter 7.
3 As seen in Chapter 2, there are attack graph approaches (e.g. [111]) that use a very precise set of pre- and postconditions and require manual analysis of vulnerabilities collected in customized vulnerability databases, and there compact representations of pre- and postconditions based on an access-to-effect paradigm (e.g. [105]), that use public vulnerability databases. Nevertheless, both streams are exploit-based attack graphs, what means that multi-step attacks they find are chains of vulnerabilities.
78
5
Gaining Insights about Vulnerabilities from the NVD 1
Vulnerabilities are central components of multi-step attacks in networks, as we have seen in related work reviewed in Chapter 2, and as further discussed in Chapter 3. Therefore, it becomes important to evaluate how to represent them in our proposed solution MsAMS, described in Chapter 7, in a way that corresponds to real vulnerabilities, stored in public databases. In this chapter we report the result of an empirical investigation of the National Vulnerability Database (NVD) motivated by an existing access-to-effect classification of vulnerabilities. Our empirical investigation shows that with the existing access-to-effect paradigm 65% of the vulnerabilities stored in the database can be classified. This means that 65% of known vulnerabilities (over 27000, by the time of this investigation) could be automatically classified and used to search for multi-step attacks, therefore, the search would miss attacks involving the remaining 35%. In this chapter we analyze the database and propose an improvement, called access-to-impact classification, that allowed us to classify 96% of known vulnerabilities, stored in the database. This makes it possible in principle to make almost the complete contents of the NVD available to an attack search tool, and therefore we will use the access-to-impact paradigm in the MsAMS approach.
5.1 Motivation for Empirical Investigation of NVD As we have seen in Sections 2.2.3 and 3.2.2, attack graph approaches use databases with information about vulnerabilities as their source of single attack steps. These single attack steps are then combined: the exploitation of one vulnerability allows the exploitation of others. This composition of vulnerabilities has traditionally been performed based on detailed pre- and postconditions of each attack step (e.g. [192, 167, 165, 111, 151, 119]). To illustrate this approach, let’s consider two examples found in the literature: 1 An
early version of this chapter has been published as a technical report [77].
79
CHAPTER 5. GAINING INSIGHTS ABOUT VULNERABILITIES FROM THE NVD (i) Example 1 is taken from Sheyner and Wing [192]. It shows the attributes of an IIS2 buffer overflow vulnerability. Example 1 IIS Buffer Overflow. This remote-to-root action immediately gives a remote user a root shell on the target machine. action IIS-buffer-overflow intruder preconditions plvl(S) >= user plvl(T) < root network preconditions w3svc_T R(S,T,80) intruder effects plvl(T):=root network effects not(w3svc_T)
is % user-level privileges on host S % no root-level privileges on host T % host T is running vulnerable IIS server % host T is reachable from S on port 80 % root-level privileges on host T % host T is not running IIS
(ii) Example 2 is taken from Jajodia et al. [111]. It shows the attributes of an exposure3 : a rpc (remote copy) program installed by default in some versions of Windows. Example 2 RCPDOWNLOAD. Binds rsh [remote shell] access to the ability to transfer programs (e.g. rootkits) from victim machine using the rcp program. preconditions 1. Execute access on attack machine 2. rcp program on attack machine 3. Attack machine has connectivity to victim’s rsh service postconditions Copies victim machine’s programs to attack machine
Those two examples show that vulnerabilities and exposures are modelled in such approaches using a number of detailed attributes, as if they were scripts of attack steps. Although very precise, this approach is dependent on human analysis of vulnerability databases, therefore, is error-prone, time consuming, and often not scalable (see [127] for an overview). But we need a scalable approach, because the number of known vulnerabilities is large (over 27000 by the time of the investigation) and fastly growing (see graphs in Chapter 1). Therefore, we do not follow this detailed pre-postcondition approach in our proposed solution MsAMS, although some of the preconditions listed are taken into account, such as reachability between hosts and services running. 2 Internet 3A
80
Information Services, a set of Web services for Microsoft servers. capability that can indirectly provide access to protected data, as defined in Chapter 2
5.1. MOTIVATION FOR EMPIRICAL INVESTIGATION OF NVD
Local Remote (or network)
Access (or locality) Exploit only from the the vulnerable machine itself Exploit remotely over the network
Effect Administrator Administrator- or Root-level access to vulnerable host (or admin) User User- or guest-level access to vulnerable host Other Confidentiality andor integrity loss, e.g. read files, corrupt limited files, learn about software versions running on a host DoS Target service or host disabled with no access to host Table 5.1: Classification of vulnerabilities based on access and effect from [126] An alternative approach, also used by the Attack Graph community, relies on simplified pre- and postconditions (e.g. [126, 128, 125]) to compose attack steps from vulnerabilities. This approach classifies vulnerabilities always in terms of two attributes: access (or locality) and effect. To illustrate this approach let’s consider the classification of vulnerabilities by Lippmann et al. [126] shown in Table 5.1. In this approach, access refers to the type of access an attacker needs to exploit a vulnerability, i.e. this is a simplified precondition of the vulnerability, and effect refers to the result an attacker obtains from the successful exploitation of a vulnerability, i.e. this is a simplified postcondition of the vulnerability. However, if we check the attributes of vulnerabilities as stored in the NVD, we notice that there are no attributes in the database which map directly to the classification presented in Table 5.1. In fact, Lippmann et al. [126] mention that they have to use a pattern classifier to populate their vulnerability model using free-form text from Nessus [149] and from the NVD. Based on these considerations we started our empirical analysis of the NVD with the following research questions: NVD RQ1 What is the percentage of vulnerabilities that can be classified according to the access-to-effect paradigm presented in Table 5.1? NVD RQ2 Is there a possible alternative classification scheme that allows the classification of a higher percentage of vulnerabilities than the access-toeffect paradigm presented in Table 5.1? NVD RQ3 Is the quality of the NVD on its own (regardless of Nessus) sufficient to classify vulnerabilities according to both classification schemes, i.e. the access-to-effect paradigm presented in Table 5.1 and the alternative scheme resulting from NVD RQ2? Previous work in this area also motivated two additional research questions to be investigated: 81
CHAPTER 5. GAINING INSIGHTS ABOUT VULNERABILITIES FROM THE NVD The statement “the administrator privilege category can be indicated by phrases including execute arbitrary code” [128, Page 11]. In practice, gaining admin privilege (admin effect, according to Table 5.1) on a host provides an attacker with the ability to execute arbitrary code. However, the opposite is not necessarily true, i.e. gaining the ability to execute arbitrary code does not imply in gaining privilege resulting in admin (e.g., an attacker may gain the ability to execute code at user level only). This triggers the following research question that may affect the classification of vulnerabilities we adopt in MsAMS: NVD RQ4 What is the percentage of vulnerabilities that results in runCode effect and also result in admin privilege gained by an attacker that exploits them? As discussed in Section 2.2.3.6, it is assumed by the Attack Graph community that credentials can be obtained as an (automatic) consequence of the successful exploitation of a vulnerability, i.e. obtaining a credential is treated as a vulnerability effect. We would like to know whether the set of vulnerabilities that explicitly results in an effect of the type “obtainCred” is relevant or not. If relevant, it is important to consider this type of vulnerability in the MsAMS approach, since we model credential theft. Note that we are talking about obtaining credentials as an effect of exploiting a vulnerability; a different case is, e.g., the existence of an easily-guessable credential that allows the compromise of a host, and represents a vulnerability per se, such as CVE-2008-4296 and CVE-2008-6588 mentioned in Chapter 3. This triggers the following research question: NVD RQ5 What is the percentage of vulnerabilities that results in obtainCred effect4 ? Before we set the stage for this analysis, we review the three NIST initiatives that are relevant for its scope.
5.2 NIST Initiatives towards Standardized and Measurable Information Security The NIST [152], sponsored by the U.S. Department of Homeland Security, has launched several initiatives towards standardizing terminology and format of information related to security management, i.e. related to vulnerabilities and configurations of Information Systems. The overall goal is to facilitate interoperability among security tools and practitioners so every one speaks the same language when talking about the same things. NITS tackles interoperability not only at the level of terminology and format but also at the level of reference data, and automation. Therefore, NIST has a set of initiatives to address those 4 Refer to Table 5.4 (page 87) for the interpretation of our effects obtainCred and runCode in terms of CVE attributes.
82
5.2. NIST INITIATIVES TOWARDS STANDARDIZED AND MEASURABLE INFORMATION SECURITY
CPE CVE
CCE
XCCDF OVAL Language CVSS
NVD OVAL Database NCP
SCAP components Common Platform Enumeration Naming scheme for IT systems, platforms and packages Common Vulnerabilities and Exposure Naming scheme for known vulnerabilities in COTS (CommercialOff-The-Shelf) and open source components Common Configuration Enumeration Naming scheme for known configuration issues related to catalogued common platforms (CPEs) Extensible Configuration Checklist Description Format XML schema for documentation of checklists and benchmark of settings related to CPEs Open Vulnerability and Assessment Language XML schema for assessing presence of CVEs (vulnerabilities) and CCEs (configuration issues) on a CPE Common Vulnerability Scoring System Method and calculator for measurement and scoring of CVEs SCAP content National Vulnerability Database Repository of CVEs OVAL Database Repository of OVAL queries National Checklist Program Repository of XCCDF checklists Table 5.2: Overview of the SCAP initiative from NIST
areas, currently assembled in what is called SCAP (Security Content Automation Protocol, http://scap.nist.gov/). SCAP consists of a set of six component initiatives, that are interconnected, and its content consists of three databases. An overview of the SCAP as a whole is given in Table 5.2, while the initiatives relevant for this thesis, i.e. CVE, NVD, and CVSS, are described next. Note that an understanding of the CVSS initiative is essential for the remainder of this chapter. CVE: Common Vulnerabilities and Exposure As already mentioned in Chapter 3, CVE is a naming scheme assigned to known vulnerabilities in COTS (Commercial-Off-The-Shelf) and open source components. It is managed by the Mitre Corporation (http://cve. mitre.org/) and is adopted in large scale by many CVE-compatible security products and services that, this way, avoid the problem of several identifiers for the same vulnerability. Vulnerabilities identified by the community are reported to Mitre and analyzed by a CVE Editorial Board which assigns them a permanent CVE identifier on the format: CVE-yyyy-xxxx, 83
CHAPTER 5. GAINING INSIGHTS ABOUT VULNERABILITIES FROM THE NVD where yyyy is the year when the vulnerability was discovered and xxxx is a sequential number. A CVE has several attributes and relates to other initiatives, e.g. a CVE contains CVSS attributes (refer to item below), relates to one or more CPEs, and belongs to a CWE (Common Weakness Enumeration)5 , a dictionary of software weakness types such as Cross-Site Scripting (CWE-79) or Authentication Issues (CWE-287); there is a hierarchy of such weaknesses. An example CVE presented in Chapter 3, and reproduced below is: CVE-2008-3257 description [53]: Stack-based buffer overflow in the Apache Connector (mod wl) in Oracle WebLogic Server (formerly BEA WebLogic Server) 10.3 and earlier allows remote attackers to execute arbitrary code via a long HTTP version string, as demonstrated by a string after ”POST /.jsp” in an HTTP request. CVEs are described in XML format and are stored in the NVD database. NVD: National Vulnerability Database The NVD is a comprehensive repository of CVEs freely available to the public at http://nvd.nist.gov/. It is in its second version and is currently in XML format. It collects CVEs since 1999. CVSS: Common Vulnerability Scoring System This is an initiative towards vulnerability (CVE) measurement and scoring. The CVSS calculator [56], maintained by FIRST (Forum of Incident Response and Security Teams) (http://www.first.org), was launched in 2004 and is currently on its second version. The CVSS is composed of three metrics groups: base, temporal and environmental [136] that together produces a CVSS score as a decimal number according to the quantitative scale [0.0,10.0]. Figure 5.1 illustrates the attributes of each of the metrics group. Relevant to this chapter is only the base metrics group, described next. The base metrics group quantifies the intrinsic characteristics of a vulnerability in terms of exploitability and impact, determined by a CVE Editorial Board. The following characteristics are relevant to determine how exploitable a vulnerability is: access required to exploit the vulnerability, access complexity involved in exploiting the vulnerability and authentication instances required to exploit the vulnerability. Relevant to determine the impact resulting from the exploitation of a vulnerability is the degree of impact the exploitation of a vulnerability potentially causes in respect to confidentiality, integrity and availability. Access required is evaluated in terms of local, adjacent network or network; access complexity in terms of high, medium or low; authentication instances 5 CWE
84
is an initiative from Mitre Corporation (http://cwe.mitre.org/).
5.3. DATA SET AND ANALYSIS APPROACH
Base Metric Group
Temporal Metric Group
Environmental Metric Group
Access Complexity
Confidentiality Impact
Exploitability
Collateral Damage Potential
Confidentiality Requirement
Access Vector
Integrity Impact
Remediation Level
Target Distribution
Integrity Requirement
Authentication
Availability Impact
Report Confidence
Availability Requirement
Figure 5.1: CVSS metrics (adapted from [136])
in terms of multiple, single or none. While the base impact attributes (i.e. confidentiality, integrity and availability) are all assessed in terms of degree of impact: none, partial or complete. More information about the CVSS attributes and the CVSS equation sets used to derive the CVSS score can be found in the CVSS guide and the online calculator [136, 56]. The NVD provides the base vector for each CVE published, i.e. it provides the assessment of the attributes that compose the base metrics group, as described. We use this vector in the investigation reported in this chapter, as summarized in Table 5.3.
5.3 Data Set and Analysis Approach The NVD database, downloaded on November 08, 2007, contained 27909 CVEs from 1999-2007. We skipped CVEs marked as “REJECT” and CVEs not analyzed, i.e. CVEs with just the field “description” filled6 , bringing the final number of CVEs used in this NVD investigation to 27273. The data collected from the NVD, i.e. an XML file containing CVEs, was converted to CSV (CommaSeparated Value) format using XML queries (XQueries) from MonetDB [23]. All required preprocessing of NVD data were performed directly over the XML by those queries. The analysis reported in this chapter consists of grouping CVEs according to attribute values related to impact, exploitability, privilege, type of vulnerability and information derived from CVEs plain-text descriptions, and finding relationships between those attributes, as described in the following7 . Table 5.3 contains the list of attributes used in the analysis that required no preprocessing; refer to the description of CVSS in Section 5.2 for a better understanding of those attributes. Column “our nomenclature” in Table 5.3 contains the terms we use to refer to each CVE attribute in this chapter. Column “CVE attribute” de6A
total of 407 CVEs were not analyzed. analysis we used Python scripts [168] and the Weka mining tool [221], and for the plots we used the package R [48]. 7 For
85
CHAPTER 5. GAINING INSIGHTS ABOUT VULNERABILITIES FROM THE NVD our nomenclature name cvss AC
CVE attributes CVE → name CVE → CVSS vector
cvss AV
CVE → CVSS vector
cvss Au
CVE → CVSS vector
cvss C
CVE → CVSS vector
cvss I
CVE → CVSS vector
cvss A
CVE → CVSS vector
description CVE identifier exploitability: access complexity; level of complexity encountered by an attacker to exploit the CVE exploitability: access vector; access needed for an attacker to exploit the CVE exploitability: authentication required; authentication needed for an attacker to exploit the CVE degree of impact on confidentiality (for the defender) caused by the successful exploitation of the CVE degree of impact on integrity (for the defender) caused by the successful exploitation of the CVE degree of impact on availability (for the defender) caused by the successful exploitation of the CVE
content of CVE attributes CVE-yyyy-xxxx possible values: L (low), M (medium) or H (high)
possible values: N (network), L (local) or A (adjacent network) possible values: N (none), S (single) or M (multiple) possible values: N (none), P (partial) or C (complete) possible values: P (partial) or plete) possible values: P (partial) or plete)
N (none), C (comN (none), C (com-
Table 5.3: CVE attributes, as stored in the NVD, that required no preprocessing (refer to the CVSS description in Section 5.2) scribes the XML tags from the original NVD XML database. Finally, columns “description” and “content” contain a brief description of each CVE attribute, and the values it can assume in the NVD, respectively. Table 5.4 contains the list of attributes used in the analysis that required preprocessing. Column “preprocessing” in Table 5.4 describes the contents of the attributes and the processing performed prior to our analysis. Note that the first item of this table, which we called privilege, although not a free-text field, requires preprocessing to transform the content of the XML tag sec prot into the format used in our investigation. The content of this tag complies with the CVE XML 1.2 Schema (http://nvd.nist.gov/schema/nvdcve.xsd) described in terms of xs:annotation tags, reproduced next. Security Protection tag with one attribute for each security protection type. Potential security protection types are: "admin" => gain administrative access "user" => gain user access "other" => other
Examples of prot sec as they appear in the NVD are: < sec prot user = ‘10 / > 86
5.3. DATA SET AND ANALYSIS APPROACH our nomenclature privilege
CVE attributes CVE → loss types → sec prot
description privilege acquired by an attacker via successful exploitation of the CVE ?? note that prot sec is not a free-text field, although it requires processing
runCode
CVE → desc → descript
possible effect (for an attacker) that results from the successful exploitation of the CVE: the ability to run code
obtainCred
CVE → desc → descript
possible effect (for an attacker) that results from the successful exploitation of the CVE: the ability to obtain credentials
gainAdmin
CVE → desc → descript
DoS
CVE → desc → descript
possible effect (for an attacker) that results from the successful exploitation of the CVE: ability to gain admin level of access possible effect (for an attacker) that results from the successful exploitation of the CVE: ability to cause a denial of service in the host
content & preprocessing of CVE attributes can contain a single privilege such as ’admin’, ’user’, ’other’, can be empty (i.e. have no privilege assigned), or can contain multiple privileges. In this case, an unique privilege was derived as follows: ’other,admin’ replaced by ’admin’; ’other,user’ replaced by ’user’; ’user,admin’ replaced by ’admin’; ’other,user,admin’ replaced by ’admin’ field processed to contain y or n: “y” if the CVE description contains the following key expressions: ’execute arbitrary code’ or ’execute arbitrary programs’ field processed to contain y or n: “y” if the description contains the following key expressions: ’intercept transmission’, ’intercept communication’, ’obtain plaintext’, ’obtain cleartext’, ’read network traffic’, ’unencrypted’ or ’sniff’ field processed to contain y or n: “y” if the description contains the following key expressions: ’gain root’ or ’gain access to root’ field processed to contain y or n: “y” if the description contains the following key expression: ’denial of service’
Table 5.4: CVE attributes, as stored in the NVD, that required preprocessing and < sec prot other = ‘10 admin = ‘10 / >. As mentioned in Section 5.2, Mitre manages CVEs. New CVEs can be submitted by the community to Mitre, which creates a so-called candidate CVE entry in the NVD and submits this entry to the CVE Editorial Board for analysis8 . We only used CVEs reviewed by the Board, and have checked the content of this field: no spelling mistakes such as “ohter” instead of “other” were found. As stated at the beginning of this section, we skipped CVEs in the full database that are currently under review. Unlike the first item, the last 4 items described on Table 5.4 are not present in the original NVD; they are completely processed attributes created in our CVS-format NVD by mining expressions contained in the free-text description of 8 For more information, _responsibilities
access
http://cve.mitre.org/cve/cna.html\#researcher\
87
CHAPTER 5. GAINING INSIGHTS ABOUT VULNERABILITIES FROM THE NVD each CVE. The expressions used were learnt from a manual inspection of CVE’s descriptions. From this inspection we observed that: (i) the expressions mined are used in affirmatives; when negative constructions are used they tend to be of the type: “does not validate...”, “does not handle...”, “does not support...”, “does not reset...”, followed by affirmative sentences describing how attackers can take advantage of the vulnerability described (ii) descriptions do not contain if-statement-like constructs (iii) some straightforward expressions, e.g., expressions as “gain privilege”, “gain administrator” or “gain administrative”, do not necessarily mean that the attacker gains privileged access to the Operating System. In fact, there are examples CVEs, such as CVE-2001-0382, CVE-2007-5700, CVE-20080174 and CVE-2008-1614, that contain the expression “gain privilege” in their description but related to cases where the attacker gains or increases privilege on an application level or obtains privileges of other users; that is why these expressions were not discarded for ’gainAdmin’ effect (iv) there are very mature expressions used in CVE descriptions such as the expressions used to determine the attributes runCode and DoS It is relevant to realize that the expressions used are not exhaustive and others could be incorporated in follow-up studies. Changes in the expressions mined from plain-text descriptions may affect conclusions 1, 4 and 5 to some extent, and may have affected the percentage of CVEs resulting in DoS effect in the effect view. However, all this represents small changes in percentages and does not invalidate the other analyses based on attributes not derived from CVE descriptions. Most important, it does not affect at all the access-to-impact view of CVEs adopted by our solution MsAMS, which is the main result of this chapter. If important for the results, statistical validation of the expressions mined would be necessary. The metrics and analysis provided in this chapter cannot be obtained from the NVD statistics webpage http://web.nvd.nist.gov/view/vuln/statistics, although it might look otherwise at first glance. For example, metrics either related to the privilege resulting from the exploitation of vulnerabilities or related to effects derived from CVEs’ descriptions cannot be obtained via the NVD statistics webpage. In addition, it does not provide means for the analysis and discovery of relations between attributes. We used the following approach to answer the research questions that motivate our empirical analysis of the NVD, presented at the beginning of the chapter. (i) Analysis of single CVE attributes, reported in Section 5.4. This analysis represents a baseline for the following investigation, and enabled us to answer NVD RQ5. 88
5.4. ANALYSIS OF SINGLE NVD ATTRIBUTES (ii) Analysis of relationships between attributes, reported in Section 5.5. This analysis enabled us to answer NVD RQ1 to NVD RQ4. Before reporting about our first stage of the NVD analysis, we introduce impact types that facilitate future reference, shown in the first column of Table 5.5 (page 89), where C refers to Confidentiality, I to Integrity and A to Availability, hereafter called CIA. The second column of this table shows the combinations of attribute values found during our investigation of the NVD. Type of impact (our nomenclature) Complete CIA Partial CIA No CIA Only-C Only-I Only-A C&I A&C A&I
Impact configurations as found in the NVD cvss C: cvss I: cvss A: Confidentiality Integrity Availability C C C P P P N N N C or P N N N C or P N N N C or P C or P C or P N C or P N C or P N C or P C or P
Table 5.5: Types of impact according to CIA configurations found in the NVD, where C stands for Complete impact, P for Partial, and N for None (refer to the description of CVSS, Section 5.2, for a better understanding of those attributes) In the next sections, for brevity, rather than talking about “common vulnerability or exposure the exploitation of which allows an attacker to acquire privilege P”, we simply talk about “CVE resulting in P”. For example, a CVE resulting in admin is a CVE of which the exploitation allows an attacker to gain admin privilege over the host containing the CVE. In the next section, we analyze the NVD attributes listed in Tables 5.3 and 5.4 in isolation.
5.4 Analysis of Single NVD Attributes As indicated in the previous section, the total number of CVEs used in this section is 27273, which is the total number of CVEs of our investigation database in CVS format. Table 5.6 (page 90) shows the distribution of CVEs in terms of access required for their exploitation. This table shows that the vast majority of CVEs can be exploited remotely, i.e. via network access to the host that contains the vulnerability. The distribution of privilege gained by exploiting a vulnerability or exposure is also interesting as almost 80% of the CVEs are not clearly classified (i.e. they result in privilege “other” or in no privilege). 89
CHAPTER 5. GAINING INSIGHTS ABOUT VULNERABILITIES FROM THE NVD exploitability network access local adjacent network low complexity medium high none authentisingle cation multiple privilege admin user other no privilege
#CVEs 22885 83.9% 4329 15.9% 59 0.2% 20762 76.1% 4824 17.7% 1687 6.2% 26480 97.1% 787 2.9% 6 0.02% #CVEs 3462 12.7% 2233 8.2% 7292 26.7% 14286 52.4%
Table 5.6: Distribution of CVEs by single attributes: exploitability of CVEs and resulting privilege from the exploitation of CVEs
It may cause confusion that the term effect, present in the vulnerability classification shown in Table 5.1 (page 81), seems to correspond to the term privilege, in the terminology adopted by NVD. However, effect has a larger scope than privilege. For example, admin, user and other are privileges gained by the attacker from the successful exploitation of a CVE; they are also effects resulting from gaining such privileges. However, other effects such as DoS, runCode, obtainCred are not privileges gained but rather abilities gained by an attacker as a result of the successful exploitation of a CVE. Table 5.6 also shows that 93.8% of CVEs involve “low” or “medium” levels of complexity, while 97.1% of CVEs require no authentication. This confirms the expectation that the need for authentication increases complexity of exploitation. Table 5.7 (page 91) shows percentages of CVEs in terms of level of impact. For example, 16.3% of all CVEs under investigation cause complete impact on confidentiality to the defender, if successfully exploited by an attacker. This means that a host containing such a CVE can have its confidentiality completely compromised. But what really strikes about this table is the similarity among the percentages related to impact: partial impact on C, I and A are around 55%, complete are around 15% and none are around 25%. This similarity will be confirmed in the next section where we analyze cross-attribute relations. Table 5.7 also shows some effects resulting from the exploitation of CVEs we would like to get insights about. First the table demonstrates that there are 406 CVEs with effect “gainAdmin” (remember that this attribute was processed from the description of CVEs, as opposed to the admin privilege shown in Table 5.6). But we have seen in Table 5.6 that there are 3462 CVEs the exploitation of which leads to privilege “admin”. We would like to determine if there is an inconsistency between these two pieces of information or not. Two cases are possible: (i) the 90
5.4. ANALYSIS OF SINGLE NVD ATTRIBUTES impact none confidentiality partial complete none integrity partial complete none availability partial complete processed effects yes gainAdmin no yes runCode no yes obtainCred no yes DoS no
#CVEs 8168 29.9% 14646 53.7% 4459 16.3% 7344 26.9% 15635 57.3% 4294 15.7% 7890 28.9% 14429 52.9% 4954 18.2% #CVEs 406 1.5% 26867 98.5% 3839 14.1% 23434 85.9% 131 0.5% 27142 99.5% 4933 18.1% 22340 81.9%
Table 5.7: Distribution of CVEs by single attributes: impact and attributes derived from CVEs descriptions set of CVEs with gainAdmin effect is a subset of the set of CVEs resulting in admin privilege. This would simply mean that the description of this subset of CVEs contain expressions that confirm their privilege classification; or (ii) the set of CVEs with gainAdmin is not a subset of admin. In the cross-attributes analysis of the next section we will see that the second possibility holds but can be resolved easily. Table 5.7 enables us to answer NVD RQ5 assuming that the expressions used to process the effect obtainCred from the CVEs description are representative and reasonably complete: Conclusion 1: Only 0.5% (per Table 5.7) of CVEs allow obtaining credentials, according to processed effect obtainCred derived from CVEs descriptions, answering NVD RQ5. Let’s now revisit Table 5.1 (page 81) with the percentages we have obtained so far from Tables 5.6 and 5.7: • Access (or locality) Local 15.9% Remote (or network) 83.9% • Effect Administrator (or admin) 12.7% 91
CHAPTER 5. GAINING INSIGHTS ABOUT VULNERABILITIES FROM THE NVD
impact only-C only-I only-A complete CIA unknown CIA configuration total
admin 0 0 0 3462 0 3462
user 0 0 0 0 2233 2233
privilege other no privilege 0 3232 0 3931 0 3965 0 787 7292 2371 7292 14286
Table 5.8: Distribution of CVEs in terms of privilege gained by their exploitation against type of impact caused by their exploitation User 8.2% Other 26.7% DoS 18.1% In terms of access, the vulnerability classification is totally representative, since local and network sets in the NVD are disjoint and, together, add up to 98% of CVEs. In terms of effects admin, user and other they also correspond to disjoint sets belonging to the same attribute in the NVD and represent together 47.6% of CVEs. However, the set of CVEs with effect DoS may overlap with those resulting in the privileges admin, user and other since it is processed from a different attribute, CVEs descriptions. Therefore, to evaluate how representative this vulnerability classification is, we have to study relationships among those attributes. We do so in the next section. Another aspect to consider is the fact that it is not clear at this point if the effect “other”, interpreted as causing confidentiality or integrity impact in the classification shown in Table 5.1 (page 81), corresponds to the privilege “other” of the NVD. We will be able to answer this later on in this chapter.
5.5 Analysis of Relationships between NVD Attributes The total set of 27273 CVEs retrieved from the NVD is now used for the analysis of multiple attributes. Table 5.8 shows the distribution of CVEs in terms of gained privilege against type of impact, according to the types defined in Table 5.5 (page 89). The distribution of CVEs shown in Table 5.8 leads us to the following remarks: (i) 100% of CVEs classified with privilege admin have complete impact on CIA9 . This relationship is to be expected and makes total sense since when an attacker gains root or administrative access to the Operating System of a host, she acquires the potential to cause impact on all three aspects of 9 Refer to Table 5.5 for the types of impact and their corresponding configuration in terms of NVD attributes
92
5.5. ANALYSIS OF RELATIONSHIPS BETWEEN NVD ATTRIBUTES
impact only-C only-I only-A complete CIA
admin 0 0 0 395
user 0 0 0 0
privilege other no privilege 0 1 0 2 0 1 0 1
Table 5.9: Distribution of CVEs with expressions in their descriptions that indicate gainAdmin effect resulting from their exploitation
admin: 3462
395
gainAdmin: 406
1
“no privilege” but complete impact CIA: 787
Figure 5.2: Understanding the reclassification of CVEs resulting in “admin”: Sets of admin-related CVEs CIA. For the same reason, it does not make sense to have CVEs that result in no privilege cause complete CIA impact, such as the small set of 787 CVEs shown in this table. Therefore, we consider this as an inconsistency in the database. We analyze this further below with the help of Table 5.9. (ii) So far, the set of CVEs resulting in no privilege can be split into five subsets. Four of these subsets contain specific impact configurations, i.e. only-C, only-I, only-A, or complete CIA. The fifth set could not be parsed with this preliminary analysis, therefore, is refer to as having an unknown impact. Conclusion 2: 100% of CVEs that result in the acquisition of privilege admin for the attacker that successfully exploits them, cause complete impact on C, I, A for the defender. If we consider Tables 5.7, 5.8 and 5.9, we realize that: there is an overlap of 395 CVEs between the sets resulting in admin and gainAdmin and an overlap of 1 CVE between the set resulting in gainAdmin and the set of CVEs that result in complete impact on CIA but are classified resulting in no privilege, as illustrated in Figure 5.2. Thus, a small set of 10 CVEs (from 406-395-1) represents outliers10 . Conclusion 3: We detected 797 CVEs in the NVD that were misclassified: they should have been classified as resulting in admin privilege. Therefore, we reclassified 797 CVEs11 in our CVS-format NVD, changing the 10 Refer
to [77] for details. 787 CVEs cause complete impact but are classified as resulting in no privi-
11 Reclassified:
93
CHAPTER 5. GAINING INSIGHTS ABOUT VULNERABILITIES FROM THE NVD
privilege
impact
reclass. admin user other no privilege
only-C only-I only-A unknown CIA configurations total
access required local adjacent network 2676 1574 9
network
total 4259
1857 6724 2725 3517 3387 1999
366 558 502 411 553 365
6 8 4 1 24 7
2229 7290 3231 3929 3964 2371
22885
4329
59
27273
Table 5.10: Privilege gained by the exploitation of CVEs and type of impact caused, against access required to exploit CVEs representation of the set of CVEs resulting in admin privilege from 12.7% (3462 CVEs out of 27273) to 15.6% (4259 CVEs out of 27273). This reflects on the representation of the vulnerability classification presented in Table 5.1 (page 81), related to NVD RQ1. So far in this section we have performed cross analysis of the NVD in terms of the relationship between resulting privilege for an attacker (from the successful exploitation of CVEs) and resulting impact for the defender (from the successful exploitation of CVEs). We now proceed by adding one dimension to this analysis: access (i.e. locality) required for an attacker, for successful exploitation of CVEs; results are reported in Table 5.10. The following conclusions can be drawn from this table: (i) 23.7% of CVEs can be classified under the following access-to-effect patterns: – network-to-admin (9.8%) – network-to-user (6.8%) – local-to-admin (5.8%) – local-to-user (1.3%) However, it is still unclear for the the majority of CVEs (76.3%), including those resulting in privilege “other” and those resulting in no privilege what privilege and impact they produce. (ii) no conclusions can be drawn for the access “adjacent network”, since it covers several sets of privilege and impact. However, it is interesting to lege, and 10 CVEs cause complete impact and contain indication of gainAdmin effect in their descriptions but are not classified as resulting in admin privilege.
94
5.5. ANALYSIS OF RELATIONSHIPS BETWEEN NVD ATTRIBUTES observe that 40.7% of these are related to CVEs that cause only-A impact. Further analysis of this issue is out of the scope of this chapter; refer to [77] for further details. We look next at all classes of CVEs identified so far (including our reclassification of a number of them as resulting in admin privilege) from the perspective of runCode and DoS, processed effect gathered from CVEs descriptions, as defined in Table 5.4 (page 87). The total of CVEs which causes DoS effect in Table 5.11 matches the total presented in Table 5.7 (page 91). However, there is a difference of 1 CVE between these two tables in respect to CVEs that result in runCode effect. It refers to the outlier CVE-2007-4060 which does not match any of the classes identified (summarized in Table 5.5, page 89), since it causes partial impact on confidentiality and integrity but complete impact on availability. From the table we find that the sets of DoS and runCode overlap by 9.8% (859 out of 4933+3838). This overlap could be explained by the fact that the ability to run code is a way to perform automated DoS attacks. privilege
impact
reclass. admin user other
complete CIA
no privilege
partial CIA partial CIA partial CIA only-C only-I only-A A&I A&C C&I no CIA total
effect runCode 1296
overlap
DoS 359 332 295 113 6 9 3695 58 63 1 2 4933
1292 834 198 3 49 112 32 4 17 1 3838
278 218 38 0 1 98 16 3 0 1 859
206
Table 5.11: Distribution of CVEs in terms of effects DoS and runCode (derived from CVEs description) resulting from their exploitation From Table 5.10 and 5.11, we observe that: (i) 93.2% (3695 out of 3965) of CVEs that cause only-A impact for the defender result in DoS effect; this was to be expected, of course, and this evidence of correlation just confirmed it (ii) 7.3% (359 out of 4933) of CVEs causing DoS effect result in admin privilege (iii) 33.7% (1296 out of 3838) of CVEs causing runCode effect result in admin privilege 95
CHAPTER 5. GAINING INSIGHTS ABOUT VULNERABILITIES FROM THE NVD (iv) in Table 5.7, we have seen that 18.1% of CVEs have expressions in their descriptions indicative of effect DoS gained by an attacker who exploits them. However, we have discussed this percentage at the end of Section 5.4, and have been left with a big question mark about whether this set of CVEs overlapped with the sets of CVEs with privileges admin, user and other. Table 5.11 allow us to see that 80% (4933-359-332-285 out of 4933) of the CVEs with effect DoS (derived from expressions in their descriptions) do not overlap with the privileges mentioned. Considering CVEs with DoS effect in relation to the total of CVEs (3947 out of 27273), we realize that the disjoint set of CVEs that result in effect DoS when exploited represents 14.5% of CVEs.
Conclusion 4: 93% of CVEs that cause only-A impact for the defender result in DoS effect for the attacker that exploits them. Conclusion 5: The exploitation of 7.3% of CVEs that result in runCode effect also result in admin privilege gained by attackers that exploit them, answering NVD RQ4. A natural next step is to narrow down the investigation to understand which CIA configurations there are in the set of CVEs resulting in privilege “other”, “user” and CVEs resulting in no privilege (curiosity triggered by Table 5.8, page 92). Weka [221] visualization facilities provided insights for this next step, as illustrated in Figure 5.3. Figure 5.3 shows: (i) CVEs resulting in no privilege, represented in the first column, have varied impact on confidentiality since this column contains 3 segments corresponding to the percentage of complete (C), none (N), and partial (P) impact on confidentiality; (ii) CVEs resulting in privilege “other” (second column) and “user” (third column) have only partial (P) impact on confidentiality12 . The same pattern is observed when we plot CVEs resulting in user, other and resulting in no privilege in terms of integrity and availability. Table 5.12 confirms the above remarks, and shows the complete set of CIA impact configurations present in the set of CVEs resulting in no privilege. Therefore, if we analyze both Tables 5.8 (page 92) and 5.12 (page 98) together we see that, at the beginning, we could identify some relations between specific privileges and a few configurations of impact for CVEs but there was a large slice of CVEs whose relations between those two attributes were not clear. Furthermore, we did not know which privileges existed among CVEs that caused partial impact on CIA. At the end, as shown in Table 5.12, we could completely establish the relationship between attributes privilege and impact, therefore, being able to almost completely cluster the CVEs (apart from 3 outliers). 12 Attribute
96
cvss C in Table 5.5, page 89, set to ’P’, the same for attributes cvss I and cvss A.
0.6 0.0
C
0.2
0.4
N
Impact on Confidentiality
0.8
P
1.0
5.5. ANALYSIS OF RELATIONSHIPS BETWEEN NVD ATTRIBUTES
other
user
Privilege
Figure 5.3: Understanding isolated CVEs with partial CIA impact: Privilege against impact on C (Confidentiality)
Conclusion 6: 100% of CVEs that result in the acquisition of privileges user or other, for an attacker that successfully exploits them, cause partial impact on C, I, A for the defender. In Section 5.4, we found curious that impact configurations seemed to match when analyzing C, I, A attributes in isolation with Table 5.7 (page 91). In fact, Table 5.12 shows 3 configurations of CVEs where this happens; if we recall from Table 5.5, complete CIA means complete impact for confidentiality, integrity and availability, the same way partial CIA means partial impact also for C, I, A, and no CIA means none impact again for C, I, A. Therefore, 55.6% of CVEs have impact where C, I, A have the same value. At this point we can revisit Table 5.1 (page 81) with updated percentages from the analysis of relationships among CVEs attributes in the NVD, i.e. from our reclassification of admin privilege, and from our analysis of overlap between the set of CVEs with DoS effect and the sets of CVEs with privilege admin, user and other. • Access (or locality) Local 15.9% 97
CHAPTER 5. GAINING INSIGHTS ABOUT VULNERABILITIES FROM THE NVD
impact complete CIA partial CIA no CIA only-C only-I only-A A&I A&C C&I total
admin 4259 0 0 0 0 0 0 0 0 4259
user 0 2229 0 0 0 0 0 0 0 2229
privilege other no privilege 0 0 7290 1340 0 59 0 3232 0 3931 0 3965 0 213 0 88 0 668 7290 13492
total 4259 10859 59 3232 3931 3965 213 88 668 27270
Table 5.12: Complete clustering of CVEs based on impact and privilege resulting from their exploitation Remote (or network) 83.9% • Effect Administrator (or admin) 15.6% User 8.2% Other 26.7% DoS 14.5% Another unanswered question from Section 5.4 was related to the interpretation given to privilege other in NVD and the effect other from the classification of vulnerabilities we considered as baseline for our investigation; do they match? The effect other refers to confidentiality and integrity loss; refer to Table 5.1. According to the impact configurations we found in the NVD, this corresponds to only-C, only-I or impact C & I, according to Table 5.5 (page 89). However, from our analysis we learnt that CVEs resulting in other privilege always cause partial CIA impact (partial CIA on Table 5.5), therefore, the semantics of the other effect do not match with those of the other privilege.
5.6 Evaluation: from Access-to-Effect toward Access-to-Impact From the analysis of CVEs, reported in Sections 5.4 and 5.5, we can answer the research questions which guided our investigation of the NVD. NVD RQ1 What is the percentage of vulnerabilities that can be classified according to the access-to-effect paradigm presented in Table 5.1? This paradigm of classification involves access required by an attacker to exploit a vulnerability and effect resulting from its exploitation for the 98
5.6. EVALUATION: FROM ACCESS-TO-EFFECT TOWARD ACCESS-TO-IMPACT user (8.2%) other (26.7%)
admin (15.6%)
DoS (14.5%)
Figure 5.4: Representation of CVEs in effect view from [126]
attacker. In terms of access required the classification is almost 100% representative. Therefore, there is no reason to investigate this further. In terms of effect, our analysis of CVEs showed the percentages illustrated in Figure 5.4. As the figure shows, the total representation of the effect view is 65% from a total of 27273 CVEs. NVD RQ2 Is there a possible alternative classification scheme that allows the classification of a higher percentage of vulnerabilities than the access-toeffect paradigm presented in Table 5.1? Our investigation revealed an alternative classification of CVEs that is more representative in the NVD and shifts the effect view to an impact view. It takes the approach of impact resulting from the successful exploitation of a CVE for the defender, rather than the effect view also resulting from its exploitation but for an attacker. Therefore: – the effect of an attacker acquiring privilege admin (representing the administrator- or root-level access to a vulnerable host) is viewed as the complete impact on C, I and A it potentially represents (per Conclusion 2) – the effect of an attacker acquiring the privilege of user (representing user- or guest-level access to vulnerable a host) is viewed as the partial impact on C, I and A it potentially represents (per Conclusion 6) – the effect other is in fact viewed as part of the class of CVEs resulting in partial CIA impact (also per Conclusion 6) – the DoS effect is viewed as the only-A impact (per Conclusion 4) 99
CHAPTER 5. GAINING INSIGHTS ABOUT VULNERABILITIES FROM THE NVD
partial CIA (40.0%)
complete CIA (15.6%)
only−A (14.5%)
only−C (11.8%)
only−I (14.4%)
Figure 5.5: Representation of CVEs in impact view derived from NVD investigation
In addition, other impacts not visible in the effect view, but relevant in terms of representation of CVEs in the NVD, appear in the impact view. It is interesting to observe that the effect admin and the impact complete CIA correspond to each other and are used interchangeably in the remainder of the thesis; the same happening between the effect user and the impact partial CIA. As the pie char in Figure 5.5 shows, the total representation of the impact view is 96% from a total of 27273 CVEs. NVD RQ3 Is the quality of the NVD on its own (regardless of Nessus) sufficient to classify vulnerabilities according to both classification schemes, i.e. the access-to-effect paradigm presented in Table 5.1 and the alternative scheme resulting from NVD RQ2? In our investigation we found a few outliers and detected an inconsistency in the classification of privilege resulting in admin that we fixed in our CVS-format NVD before proceeding with our analysis. This inconsistency accounted for 2.9% of misclassified CVEs (see Conclusion 3). Therefore, we consider the quality of the NVD appropriate for automatically classifying CVEs according to both, effect and impact, views. Note that one can always argue that the expressions we mined from CVEs descriptions, i.e. gainAdmin, runCode, obtainCred and DoS effects listed in Table 5.4, are not complete or are not representative of the effects we intended to evaluate. However, judging from our manual pre-inspection of CVEs, we believe that, although other expressions could be incorporated in follow-up studies, the expressions we mined are representative of the effects we intended to evaluate. We realize that this manual preliminary 100
5.7. CLASSIFICATION OF VULNERABILITIES BY IMPACT ON DEFENDER inspection would not be enough, and statistic methods would be needed, if results obtained were highly influenced by these expressions, but this is not the case. Changes in the expressions mined may affect Conclusions 1, 4 and 5 to some extent, and may have affected the percentage of CVEs resulting in DoS effect in the effect view. Still, all this represents small changes in percentages and does not at all invalidate the other analysis based on attributes not derived from CVE descriptions such as the impact view of CVEs, our main result. NVD RQ4 What is the percentage of vulnerabilities that results in runCode effect and also result in admin privilege gained by an attacker that exploits them? Our investigation revealed that only 7.3% of CVEs that result in runCode effect also result in admin privilege gained by attackers that exploit them (per Conclusion 5). Therefore, we find it questionable to consider that expressions of the type “execute arbitrary code” in CVEs descriptions indicate a resulting admin privilege. This finding has no implications in the MsAMS solution. NVD RQ5 What is the percentage of vulnerabilities that results in obtainCred effect? We found an insignificant percentage of vulnerabilities that explicitly results in obtaining credentials as an effect of their exploitation, considering the expressions mined from the CVEs descriptions (per Conclusion 1). Therefore, this finding has no implications either for the MsAMS solution that adopts the access-to-impact paradigm, summarized next.
5.7 Classification of Vulnerabilities by Impact on Defender We carry forward from this analysis a vulnerability classification that takes the perspective of impact on defender instead of effect on attacker, i.e. from accessto-effect to access-to-impact. The different classes of impact are interpreted as follows. 1. complete-CIA: vulnerabilities in this class result in complete C I A impact on a host; it means that the successful exploitation of a vulnerability of this type allows an attacker to acquire privileged and unrestricted access to data and resources (e.g. programs) of the host. Therefore, the attacker can read and write OS data (e.g. modify configurations) and user-level data, or can execute privileged OS programs (e.g. installation commands) and user-level programs. 2. partial-CIA: vulnerabilities in this class result in partial C I A impact on a host; it means that the successful exploitation of a vulnerability of this 101
CHAPTER 5. GAINING INSIGHTS ABOUT VULNERABILITIES FROM THE NVD type allows an attacker to acquire non-privileged and restricted access to data and resources (e.g. programs) of the host. Therefore, the attacker can read and write user-level data, or can execute user-level non-privileged programs. 3. only-C: vulnerabilities in this class result in impact restricted to the confidentiality of data contained in a host; it means that the successful exploitation of a vulnerability of this type allows an attacker to acquire the ability to read data, but not to write. Therefore, the attacker gains restricted access to data and no ability to execute programs. 4. only-I: vulnerabilities in this class result in impact restricted to the integrity of data contained in a host; it means that the successful exploitation of a vulnerability of this type allows an attacker to acquire the ability to read and write data. Therefore, the attacker gains unrestricted access to data and no ability to execute programs. 5. only-A: vulnerabilities in this class result in impact restricted to the availability of the host; it means that the successful exploitation of a vulnerability of this type allows an attacker to make this host unavailable.
102
6
Finding Network Attacks as an Optimization Problem1
This chapter presents a preliminary solution to the problem of finding multi-steps that attackers could take advantage of to compromise targets deep in a network. It adopts the first design decision we make: to frame the problem of finding multistep attacks in a network as an optimization problem. This perspective requires us to develop: 1. A formal notation to represent a multi-step attack, regarded as a solution, in the field of Combinatorial Optimization. 2. Formal operations to evolve a solution, i.e., to compose attack steps in multi-step attacks. In this chapter, called edition operations. 3. A fitness function, i.e., an objective expressed mathematically which drives the searching process. For example, a function which represents generically a class of attackers’ objective. 4. A stopping criterion to decide when a solution is considered complete; in our case we consider that a multi-step attack is complete when targets are reached. 5. Starting point(s) from which each solution is built, considering a forward search. In our case, these are network nodes under suspicion or a probable location of an attacker, such as the Internet. 6. A search engine that incorporates, to one or more current solutions, the best candidate solutions (composed of an attack step or a set of attack steps), according to the fitness function. This preliminary solution also frames a design decision that is consequence of R2 (representation of attack and network dynamics): the formal notation used to 1 Early versions of this chapter have been published at IAS’07 [70], and as a technical report [71].
103
CHAPTER 6. FINDING NETWORK ATTACKS AS AN OPTIMIZATION PROBLEM represent multi-step attacks should be able to express concurrency, i.e., sequence and parallel compositions of attack steps. This is required because, as we have seen in Section 3.3.1 on page 56, there are attacks that typically involve sequences of attack steps, such as the ones related to the best-cost-benefit strategy, and there are attacks that typically involve parallel attack steps, such as the ones related to the best-coverage-of-the-network strategy (e.g., botnets). Furthermore, there are attacks that involve synchronism of attack steps, such as Denial of Services (DoS) and Distributed DoS (DDoS); they involve both strategies but require synchronism in the launch stage of the attack (refer to Section 3.3.3.2 on page 60). Note that in this preliminary solution we not use the best-coverage strategy, instead we use what we call added value to emulate the infection phase. The preliminary solution described in this chapter does not focus on the requirements we set in Chapter 4 but rather on the parallelism and synchronization aspects of attacks like DoS and DDoS. In fact, the network is represented in a very simple way, i.e., only vulnerable hosts (workstations or servers) and their connectivity are represented, but we do not represent other entities like services or the vulnerabilities themselves; and we do not represent hierarchy of the networks such as nesting of assets or firewalls. However, although network topology is not explicitly represented, it is reflected in the connectivity between hosts. Therefore, we experiment with the optimization and solution representation aspects, and propose the ELAS approach.
6.1 ELAS: Evolutionary Learning of Attack Scenarios In this chapter, we present ELAS (Evolutionary Learning of Attack Scenarios), an approach (comprehending an algorithm and a solution representation) that allows finding, i.e., learning, attack scenarios from a graph representing the network. Central to this approach is a novel evolutionary algorithm which relies on the analogy of the evolution of species that allows a population to grow until its individuals start to compete for resources and unfit individuals die. The algorithm works with a system of pools in which promising individuals (i.e., candidate solutions) can improve in complexity while still in reproduction phase. A system of credits avoids search space explosion despite a large number of candidate solutions is allowed to mature. Most important, the algorithm potentially applies to other optimization problems, like the Travel Salesman Problem, as well, provided an appropriate representation of the solution, and a fitness function. ELAS takes the perspective of concurrent systems that “these systems [composed of processes] can be readily decomposed into subsystems [i.e., sub-processes] which operate concurrently and interact with each other” [96]. We use an approach inspired by Hoare’s Communicating Sequential Processes (CSP) [95, 96] with a syntax that resembles the occam programming language [106] to represent a solution (i.e., a multi-step attack, called simply attack in the remaining 104
6.2. OUR EVOLUTIONARY APPROACH of this chapter) composed of single-steps. Therefore, an atomic construct Atm, analogous to a process, represents a step from one host to another and is an arc in the network graph. There are three types of compositions possible in attacks: parallel, sequential and choice. The searching space defined by the graph is explored by means of edition operations which create new generations of multi-step attacks from existing ones. The output attack scenarios returned by ELAS can be used by network administrators to gain awareness of the structural susceptibility of the network to potential multi-step attacks that reach valuable targets, where those potential attacks exist due to the connectivity in the network only. The scenarios returned are expressive enough for representing parallelism, synchronization, and sequencing, found in attacks.
6.2 Our Evolutionary Approach We use a system of pools and credits to simulate the evolutionary process of species, where species are allowed to grow until their individuals start to compete for resources to survive. Our approach has the following characteristics which represent a benefit over traditional heuristic search optimization methods, such as Genetic Algorithm, Simulated Annealing and Ant Colony Optimization [175]: (i) the size of the solution population is flexible and depends on the number of credits which are consumed in the reproduction process (ii) a solution (i.e., a potential multi-step attack) is not discharged after it has reproduced, increasing the chances of producing future good quality offsprings (i.e., to become a real multi-step attack (iii) individual potential multi-step attacks (i.e., solutions) have second chances of survival, if they have proved themselves worthy, i.e., multi-step attacks receive recharges of credits if they have value and, therefore, have reached a target Thus, the algorithm uses three pools, named Speculation Pool (SP), Attack Pool (AP) and Dying Pool (DP). Figure 6.1 shows the life-cycle of a potential multi-step attack based on these pools. After a potential attack is created, it receives credits and is allowed to mature in the SP. Each time a potential attack is edited, its amount of credit either decreases, if the generated offspring has fitness (Definition 14) worse than its father, or remains unchanged, in the opposite case. This decrease is proportional to the complexity of generation of the offspring, involving the update of the offspring head set and tail set (refer to Definition 6). The potential attack remains in the SP until its credits have finished. When this happens, there are two possibilities. Either the potential attack has reached a target (i.e., becoming a real attack with value different than zero), and in this case it is moved to the AP, or it has not reached a target, 105
CHAPTER 6. FINDING NETWORK ATTACKS AS AN OPTIMIZATION PROBLEM
solution is created
SP: Speculation Pool AP: Attack Pool DP: Dying Pool
+credit -credit solution generates offsprings
solution consumes credit
credit ≥ 0
SP
credit < 0 solution has value > 0 +credit yes
no
yes
-credit solution consumes credit
solution generates offsprings
credit ≥ 0
credit < 0 solution for output
AP
solution is close to a target node
no
DP
solution is deleted
Figure 6.1: Life-cycle of a solution (a potential multi-step attack)
and in this case it is moved to the DP. In the AP, the (real) attack is allowed more credit to improve its complexity (i.e., to incorporate more attack steps). When its AP credits finish, the attack is sent to output. In the DP, the potential attack is checked to see whether it is within a distance (according to a threshold parameter) to a target. In affirmative case, its SP credits are restored and it is sent back to the SP. In negative case, the attack is deleted. A potential attack is only allowed to return once to SP from DP.
6.2.1
Cost and Value Metrics
Before we proceed with our solution representation, in Section 6.2.2, we discuss the notions of cost and values adopted by ELAS. In our modelling, the cost represents the security level, i.e., the difficulty that an attacker encounters to bypass message-passing channels between pairs of network nodes. These channels implement protocols like FTP, SMTP, SSH, VPN, etc. Thus, these costs are limited to a set of arc types (protocols) used by the organization. The best way to assign these costs seems to be to compare the protocols in terms of encryption algorithms and authentication methods. In fact, this relative view for the quantification of 106
6.2. OUR EVOLUTIONARY APPROACH costs has been used elsewhere, as already mentioned in Section 3.4 on page 61. Chinchani et al. [38] use cost metrics as a relative quantity defining the amount of deterrence offered by one security measure over another. Howard et al. [103, page 12] also take a relative expert approach to assign weights to channel types. Furthermore, methods from Requirements Engineering, such as the 100-Dollar Test [18], can also facilitate this quantification of costs. Value represents financially-based asset value, as perceived by legitimate stakeholders, in respect to the impact of loosing or damaging a host, as discussed in Section 3.4. Such values are associated with each host represented as a node in the network graph, as we will see in the next section. However, beyond value, ELAS incorporates a notion of added value. Intuitively, it is easy to imagine that the impact of a multi-step attack increases as the number of high value hosts compromised by the attack increases. For example, if a Web server (WS) has asset value 10, and a File Server (FS) has also asset value 10, the impact of having both compromised at once is higher for defenders than the impact of having each compromised in isolation, e.g., within days or months. This can be represented using the following tuples: (10,WS), (10,FS), (100,WS,FS), where 100 is the added value of having WS and FS compromised at once. Now, let’s consider the case of (D)DoS attacks (discussed in Section 3.3.3.2). Their launch phase requires that a host (with high value) receives requests at a rate that exceeds the target’s capacity of response. The notion of added value also applies to emulate this case, via the tuples: (10,WS) means the WS has value 10 when answering requests from another host, but (1000,WS,WS,WS) has value 1000 when its capacity of request handling is exceeded (symbolically represented by answering requests from 3 other hosts). Now that we have introduced the notions of cost and value assumed in ELAS, we carry on introducing how a solution (i.e., a potential multi-step attack) is represented.
6.2.2
Solution Representation
A solution for the evolutionary algorithm is a composition of atomic attack steps, where each atomic attack step is the traversal of one direct network link in the network. Definition 3 (A network graph.) A network graph is a tuple: G = (N, A, I, α, β), where N is a nonempty set of nodes, representing hosts, and A ⊆ N × N is a nonempty and irreflexive set of arcs, representing communication channels (and thus possible atomic attack steps), I ⊆ N is a nonempty set of nodes under suspicion as the initial location of an attacker, α : A → N is a function that assigns cost to arcs (i.e., cost that an attacker encounters to traverse an arc), and β : 2N → N (where 2N is the set of all sub-sets of N ) a function that assigns 107
CHAPTER 6. FINDING NETWORK ATTACKS AS AN OPTIMIZATION PROBLEM value to sets of nodes (i.e., value associated with a host). We call this β function Added Value. Definition 4 (Arc Head and Arc Tail.) Let (a, b) ∈ A be an arc over the network graph G = (N, A, I, α, β). The arc head of (a, b) is a and the arc tail is b. Definition 5 (Potential Multi-step Attacks.) Let G = (N, A, I, α, β) be a network graph. The set of all potential multi-step attacks MAG over G is defined as follows: 1. For every (a, b) ∈ A, there is an atomic term Atm(a, b) in MAG , 2. For every P1 , P2 ∈ MAG , there are terms Π[P1 , P2 ] in MAG , for Π ∈ {Seq,Par,Alt}. These terms need to comply with Defintions 7, 8 and 9. 3. Any potential multi-step attack P ∈ MAG is formed by (possibly multiple applications of ) rules 1 and/or 2. A term Seq[P1 , Seq[P2 , P3 ]] or a term Seq[Seq[P1 , P2 ], P3 ] is abbreviated: Seq[P1 , P2 , P3 ]. Likewise, a term Par[P1 , Par[P2 , P3 ]] or a term Par[Par[P1 , P2 ], P3 ] is abbreviated: Par[P1 , P2 , P3 ]. And a term Alt[P1 , Par[P2 , P3 ]] or a term Alt[Alt[P1 , P2 ], P3 ] is abbreviated: Alt[P1 , P2 , P3 ]. Example 3 The following is an example of a potential multi-step attack: Par[Seq[Atm(n61,ms2),Atm(ms2,n62)],Seq[Atm(n61,ms2),Atm(ms2,n63)]]
Definition 6 (Head Set and Tail Set of a Potential Multi-step Attack.) Let G = (N, A, I, α, β) be a network graph and let P ∈ MAG be a potential multistep attack in G. 1. If P is of the form Atm(a, b), then Headset(P ) = {a} and Tailset(P ) = {b}. 2. If P is of the form Seq(P1 , P2 ) for arbitrary P1 , P2 ∈ MAG , then Headset(P ) = (Headset(P1 ) ∪ Headset(P2 )) − Tailset(P1 )2 and Tailset(P ) = (Tailset(P1 ) ∪ Tailset(P2 )) − Headset(P2 ). 3. If P is of the form Π(P1 , P2 ) for Π ∈ {Par, Alt} and arbitrary P1 , P2 ∈ MAG , then Headset(P ) = Headset(P1 ) ∪ Headset(P2 ) and Tailset(P ) = Tailset(P1 ) ∪ Tailset(P2 ). Example 4 The Headset and Tailset of the potential multi-step attack presented in Example 3 is: Headset = {n61} and T ailset = {n62, n63} 2 Minus
108
represents set difference.
6.2. OUR EVOLUTIONARY APPROACH We define next the syntax and informal semantics of the sequential, parallel and choice compositions as used by ELAS. Definition 7 (Sequential composition.) Two potential multi-step attacks P1 , P2 ∈ MAG can be composed in sequence, denoted Seq[P1 , P2 ], when: Tailset(P1 ) ⊆ Headset(P2 ). The informal semantics of this composition is: P1 happens and, when completed, P2 follows. Definition 8 (Parallel composition.) Any pair of potential multi-step attacks P1 , P2 ∈ MAG can be composed in parallel, denoted Par[P1 , P2 ]. The informal semantics of this composition is: P1 and P2 start simultaneously. Definition 9 (Choice composition.) Any pair of potential multi-step attacks P1 , P2 ∈ MAG can be composed in parallel, denoted Alt[P1 , P2 ]. The informal semantics of this composition is: P1 or P2 , but not both, happens non-deterministically. Definition 10 (Value of a Potential Multi-step Attack.) Let G = (N, A, I, α, β) be a network graph, let P ∈ MAG be a potential multi-step attack in G, and let β be the function that assigns added value to Tailset(P ). The value of P is defined as follows: • V alue(P ) is given by β, if Tailset(P ) has added value or • V alue(P ) = 0, if Tailset(P ) has no added value Definition 11 (Target.) Let G = (N, A, I, α, β) be a network graph and let P ∈ MAG be a potential multi-step attack in G. Target is a set T , where T ⊆ T ailset(P ) that has added value given by function β greater than a given threshold δ. Definition 12 (Attack.) Let G = (N, A, I, α, β) be a network graph and let P ∈ MAG be a potential multistep attack in G. P is considered as an attack when Headset(P ) ⊆ I and T ⊆ Tailset(P ) (see Definition 11). Definition 13 (Cost of a Potential Multi-step Attack.) Let G = (N, A, I, α, β) be a network graph, let P ∈ MAG be a potential multi-step attack in G, and let alpha be the function that assigns cost to arcs (a, b) ∈ A. The cost of P is defined as follows: |Atm|P
Cost(P ) =
X
Cost(Atm(a, b)i ),
i=1
where |Atm|P is the number of atomic constructs in P. 109
CHAPTER 6. FINDING NETWORK ATTACKS AS AN OPTIMIZATION PROBLEM Definition 14 (Fitness of a Potential Multi-step Attack.) Let G = (N, A, I, α, β) be a network graph, let P ∈ MAG be a potential multi-step attack in G. The fitness of P is defined as follows: F itness(P ) = V alue(P ) − Cost(P )
6.2.3
Edition Operations
Edition operations are operations executed by the evolutionary algorithm to evolve a candidate solution (a father solution) into new candidate solution (offspring solutions). Our algorithm selects edition operations based on a probabilistic distribution function, among the following six possible operations. Editions always generate new offsprings P 0, i.e., the original potential multistep attack P remains as it is. 1. New atomic: This edition operation involves no previous solution, it creates a new solution consisting of an atomic construct, according to three different options: The first option is: the created Atm(a, b) has node a ∈ I (see Definition 3). In this case, the solution will grow towards nodes with added value (forward search). The second option is: the created Atm(a, b) has node b with added value. In this case, the solution will grow towards a node ∈ I (backward search). The third option is: the created Atm(a, b) has node a 6∈ I and node b with no added value. In this case, the solution will grow both towards a node ∈ I and towards a nodes with added value (both forward and backward search). 2. Atomic extension: This edition operation involves two steps, and one solution P . Step 1: Selection of a solution P to be extended. This selection happens according to one of the following criteria: (i) smallest cost, (ii) highest value, (iii) highest fitness, or (iv) random. Which criterion the algorithm will use is determined via input parameter. Step 2: Selection of an arc (a, b) ∈ A to be added as an atomic construct to solution P . Among all the arcs (a, b) ∈ A, and depending on the type of solution (i.e., if it grows forwards, backwards or both), an arc that can be composed with Headset(P ) or Tailset(P ) is selected following the four criteria described in Step 1. The result is either Seq[P, Atm(a, b)] or Seq[Atm(a, b), P ] 110
6.2. OUR EVOLUTIONARY APPROACH 3. Seq composition: This edition operation involves a pair of solutions P1 and P2 . Assuming that P1 is selected first, as described in Step 1 of edition “Atomic extension”. Then a list of candidates C for P2 is generated using the following criterion: the Tailset(P1 ) ⊆ Headset(P2 ). Next, one Pi ∈ C is selected randomly from this list of candidates. Finally, the sequential composition Seq[P1 , P2 ] is generated with selected P1 and P2 . 4. Par composition: This edition operation involves a pair of solutions: P1 and P2 . In this case, both solutions are selected as described in Step 1 of edition “Atomic extension”. The only restriction imposed in this case is: if both V (P1 ) > 0 and V (P2 ) > 0 (see Definition 10), then Tailset(P1 ) ∩ Tailset(P2 ) = ∅. A parallel composition Par[P1 , P2 ] is generated with the selected P1 and P2 . 5. New Par: This edition operation creates a solution P1 which is the “Par composition” of several arcs (a, b) ∈ A with tail ∈ T . This selection can be either: (i) random, by (ii) best value (i.e., the highest value is selected), or by (iii) preference for best value (i.e., the higher values have more chance to be selected). Which criterion the algorithm will use is determined via input parameter. 6. Par join: This edition operation extends an existing solution P1 with a new solution P2 . A solution P2 with Headset(P2 ) equal to Tailset(P1 ) is created, if P1 grows forwards. The sequential composition Seq[P1 , P2 ] is generated in this case. Alternatively, a solution P2 with Tailset(P2 ) equal to Headset(P1 ) is created, if P1 grows backwards (or both forwards and backwards). The sequential composition Seq[P2 , P1 ] is generated in this case. All the edition operations enumerated above apply to solutions in SP. However, only the “Atomic extension” edition operation also applies to solutions in AP.
6.2.4
The Evolutionary Algorithm
The evolutionary algorithm consists of two main phases: the reproduction phase and the retirement phase. In the former, edition operations occur creating new generations of solutions. In the latter, solutions are selected for deletion, for output or for a new stage of reproduction. An algorithm iteration, called cycle, also has credits (provided as parameter) which decreases each time a solution is edited. A cycle can generate several possible solutions as output (from the AP). Figure 6.2 presents the main algorithm, where cycle credits sums credits consumed in the reproduction phase and MAX credits is a parameter. Figure 6.3 111
CHAPTER 6. FINDING NETWORK ATTACKS AS AN OPTIMIZATION PROBLEM presents the algorithm for the reproduction phase and Figure 6.4 presents the algorithm for the retirement phase. SP = {}, AP = {}, DP = {} cycle_credits = MAX_credits FOR c cycles WHILE cycle_credits > 0 reproduction phase retirement phase cycle_credits = MAX_credits
Figure 6.2: Main algorithm
WHILE SP has credits and cycle_credits > 0 select edition operation select solution to edit perform edition update credit solution decrease credit SP decrease cycle_credits WHILE AP has credits and cycle_credits > 0 select solution to edit select arc from G to be extended perform edition: atomic extension update credit solution decrease credit AP decrease cycle_credits
Figure 6.3: Reproduction phase algorithm
Proposition 1 The complexity of the evolutionary algorithm (Figure 6.2) is O(cm + n2 ), where c is the number of cycles, m is the maximum of credits a cycle can have, and n is the number of nodes in the graph. Proof. The running time of the algorithm is the sum of the time for setting up the input graph which takes O(n2 ) and the time for pool editions. Since there are c cycles of pool editions and each cycle spends at most m credits, where m is M AX credits as mentioned in Figure 6.2, then the time for pool editions takes O(m), independent of the credits of pools SP and AT and of the credits of individual solutions. 112
6.3. MOTIVATING EXAMPLE: DENIAL OF SERVICES BY E-MAIL WORM FOR each solution in SP without credits IF value of solution > 0 restore credit solution move solution to AP ELSE move solution to DP FOR each solution in AP without credits output solution FOR each solution in DP IF tailset of solution is close to target based threshold restore credit solution move solution to SP ELSE delete solution
Figure 6.4: Retirement phase algorithm
6.3 Motivating Example: Denial of Services by Email Worm This example of a Denial of Services (DoS) attack by an e-mail worm was collected and adapted from Chinchani et al. [39, Section 4.2]. Figure 6.5 shows a graph representation of the attack in four stages. In the first stage, an insider (node i denoting the insider computer) sends an e-mail to a coworker (node n52) containing an attachment, for example requesting review of an attached document. When the coworker opens the attachment, her computer gets contaminated, causing the original e-mail (worm) to be replicated and sent to e-mails contained in her address book. Thus, the e-mail worm from node n52 contaminates node n61 connected to a different mail server inside the Local Area Network (LAN), in stage 2. The same process happens on stage 3, where node n61 contaminates nodes n62 and n63. Stages 1-3 represent a DoS infection-phase similar to the one mentioned in Section 3.3.3.2 on page 60, however, instead of propagation via botnet (with centralized control of bots), here we have propagation via an address book worm. In stage 4, we see the DoS taking place with nodes n61, n62 and n63 flooding the mail server’s capacity (e.g. bandwidth) (node ms2) with e-mails arriving within a short period of time, i.e., synchronized e-mails.
6.3.1
Representation of the DoS Attack
Figure 6.6 shows the DoS attack example represented in ELAS. The DoS on the target happens because Atm(n61, ms2), Atm(n62, ms2) and Atm(n63, ms2) are triggered together due to the semantics of the parallel composition. Thus, this attack involves one point of synchronization in its last stage. 113
CHAPTER 6. FINDING NETWORK ATTACKS AS AN OPTIMIZATION PROBLEM 1st stage: insider sends e-mail with worm mail server
2nd stage: worm reproduces mail server
mail server
ms2
mail server
ms2
ms1
ms1
n63
n63 n61
n64 n65
n62
n61
n53 i
n64
insider
n52
n54 n65
3rd stage: worm reproduces mail server
insider
n62
n52
n54
4th stage: contaminated nodes cause DoS mail server
mail server
ms2
n53 i
mail server
ms2
ms1
ms1
n63
n63 n61
n64 n65
n62
n61
n53 n64
i
insider
n52
n53 i
n54 n65
n62
insider
n52
n54
point of synchronization
Figure 6.5: Denial of Services by E-mail Worm
This point is represented in the specification by the last P ar inside a Seq. It means that P ar[Atm(n61, ms2), Atm(n62, ms2), Atm(n63, ms2)] will only start after the previous Par has completed, and that Atm(n61, ms2), Atm(n62, ms2), and Atm(n63, ms2) will start simultaneously. attack = Seq[ Seq[Atm(i,ms1),Atm(ms1,n52)], Seq[Atm(n52,ms1),Atm(ms1,ms2),Atm(ms2,n61)], Par[Seq[Atm(n61,ms2),Atm(ms2,n62)],Seq[Atm(n61,ms2),Atm(ms2,n63)]], Par[Atm(n61,ms2),Atm(n62,ms2),Atm(n63,ms2)] ]
(stage (stage (stage (stage
Figure 6.6: Representation of the multi-step attack shown in Figure 6.5
6.3.2
Running ELAS to Find the DoS Attack
We consider a default network topology, adapted from Suehring [204] and illustrated in Figure 6.7, to construct a network graph to be used as input to ELAS. The network topology represents an organizational network that has a router which interfaces internal and external traffic, and is connected to four firewalls. Firewalls 1 and 2 interface with LANs 1 and 2 respectively, and firewalls 3 and 4 interface with servers 1 and 2 respectively. 114
1) 2) 3) 4)
6.3. MOTIVATING EXAMPLE: DENIAL OF SERVICES BY E-MAIL WORM
INTERNET communication channel backbone
router LAN1 pc mac linux printer LAN2 pc mac linux printer
SERVERS1
firewall1
firewall2
mail server1 web server1
SERVERS2
firewall3
firewall4
mail server2 web server2
Figure 6.7: Default network topology adapted from Suehring [204]
We have implemented the algorithm in Haskell and performed a number of tests. We found that the algorithm is able to generate DoS scenarios with ELAS similar to the one shown in Figure 6.6, using the following input. • An input network graph with up to 2000 nodes: we used a graph with 3 LANs (LAN1, LAN2 and LAN3). Nodes in LAN1 (nodes starting with 1) are connected to mail server represented by node 91, nodes in LAN2 (nodes starting with 2) are connected to mail server 92 and nodes in LAN3 (nodes starting with 3) are connected to mail server 933 . • The cost of each type of communication channel: this cost represents the difficulty the attacker will have to traverse the channel, thus it represents its level of protection implemented by a protocol. For example, a SSH connection is more secure than a SMTP connection and, consequently, the cost associated with a SSH connection should be higher than the cost associated with a SMTP connection. In this case, the cost of the SMTP connection for the example is set to 10. • The initial set: our initial set is node 12 in LAN1. • The added value of targets: our target is node 93. To simulate three attacking nodes (representing the limit of simultaneous connections that mail server 93 can handle) to node 93, we set the added value to (1000, 93, 93, 93). The algorithm found DoS-like attacks with cycles ranging from 1000 for a network with 50 or 100 nodes, to 5000 for networks of up 2000 nodes. When 3 We use name convention as a way to group logically hosts in subnets since, as mentioned at the beginning of the chapter, ELAS uses a simple representation of the network.
115
CHAPTER 6. FINDING NETWORK ATTACKS AS AN OPTIMIZATION PROBLEM using a 2000 nodes network, more complex DoS scenarios have been reproduced within a maximum of 30 minutes in a Pentium 4 machine (2.8 GHz) with 512MB RAM, running Linux Ubuntu. These networks were all randomly generated and nodes were distributed among one to five LANs. Figure 6.8 shows a sample output generated by ELAS in 1000 cycles using a network of 20 nodes. In this case, the attacking node 12 contaminates node 21, located in another LAN. Node 21 has node 39 in its address book, thus, the worm is propagated from node 39 to nodes 311, 312 and 313, yet in another LAN. These last nodes mount the DoS attack on the mail server, node 93. The final attributes of the output multi-step attack that represents the DoS attack were: (i) head set = [12], (ii) tail set = [93], (iii) cost = 130 (13 arcs of 10), (iv) value = 1000, and (v) fitness = 870. attack = Seq[Seq[Atm(12,91),Atm(91,92],Atm(92,21)], (stage Seq[Atm(21,92),Atm(92,93),Atm(93,39),Atm(39,93)],(stage Par[Atm(93,311),Atm(93,312),Atm(93,313)], (stage Par[Atm(311,93),Atm(312,93),Atm(313,93)]] (stage
1) 2) 3) 4)
Figure 6.8: ELAS Output: multi-step attack
6.4 Summary In terms of applicability, we have presented ELAS (Evolutionary Learning of Attack Scenarios), an evolutionary-based algorithm that learns attack specifications representing attack scenarios from a network graph. We took the approach of validating the algorithm by modelling a known attack that is especially hard to represent because it requires synchronization. Thus, we used a Denial of Services by Email Worm attack as a motivating example. The algorithm was able to learn this type of attack from networks up to 2000 nodes. We believe that this type of tool can be valuable for administrators to acknowledge potential attack scenarios towards valuable assets. In terms of the algorithm itself, we have presented an evolutionary-based approach that represents an improvement compared to traditional local search optimization heuristics. In our approach, the search space is explored by many alternative solutions at the same time, like it happens with Genetic Algorithm for example, but the parent solutions remain active in the system of pools. Thus, a same parent solution has several opportunities to improve by generating more than one offspring, turning it potentially powerful in exploring the search space. In the ELAS approach, cost, value and added value are assumed given and are dependent on expert judgment. Apart from being a manual process, subjective and prone to inconsistencies since they are stakeholder-specific, the notion of added value allows uncovering the structural susceptibility of a network to (D)DoS attacks. However, this added-value approach do not scale well, and a much better 116
6.4. SUMMARY approach would be to use combination of strategies to achieve it, as described in Chapter 3. MsAMS, the solution described in the next chapter, can potentially work with different strategies although in this thesis we just explored the best cost-benefit strategy. Nevertheless, MsAMS has a big advantage (among many others) compared to ELAS since it uses automatically calculated costs and values, and allows a richer representation of the network.
117
7
The MsAMS Solution: Multi-step Attack Modelling and Simulation1
Attack graphs are an important support for the assessment and subsequent improvement of network security. They reveal possible paths an attacker can take to break through security perimeters and traverse a network to reach valuable assets deep inside the network. Despite significant progress made in this area, we identified some gaps that motivates our solution requirements, described in Section 4.2 on page 70, and summarized next. R1 The solution should permit full representation of the network topology. R2 The solution should permit the representation of attack dynamics and network dynamics, e.g., involved with the acquisition of credentials. R3 The solution should allow for reasonable automatic estimation of asset values, useful for assignment of potential targets. R4 The solution should allow the investigation of hypotheses, via what-if scenarios. R5 The solution should provide automatic estimation of expected cost of an attack step. As seen in the previous chapter, we take the approach that finding network attacks is an optimization problem. Additionally, we also realize that there are different types of multi-step attacks, as seen in Chapter 3, and they may involve not only sequence of steps but also parallel steps or even synchronization of attack steps. As a consequence, we need to use formalisms not only able to represent single attack steps which can be composed into multi-step attacks, but also able to represent concurrency. Although the formalism used in ELAS (Evolutionary Learning of Attack Scenarios) allows the automatic manipulation of attack steps by heuristic methods, and allows for various types of single step compositions, 1 Early versions of this chapter have been published at SAC’09 [73], ARES’09 [76], and as a technical report [72].
119
CHAPTER 7. THE MSAMS SOLUTION: MULTI-STEP ATTACK MODELLING AND SIMULATION it has drawbacks. The ELAS formalism does neither provide means to express nesting or hierarchy of entities, nor provides meanings for expressing mobility. Furthermore, it is very limited in the entities that can be used to represent a network. Besides, in the ELAS approach, asset values to determine targets and a measure of cost for attack steps are considered given. Therefore, ELAS does not meet the solution requirements we pursue and that are listed above. In this chapter we describe an improved approach to find multi-step attacks in a modelled network. We formalize attack steps based on concepts of Mobile Ambients, incorporated in our proof-of-concept MsAMS (Multi-step Attack Modelling and Simulation) tool. In summary, the main components of our solution are Mobile Ambients (MA) and Combinatorial Optimization applied to the domain of multi-step network attacks. The former is used (i) to model a network, (ii) to model attackers, and (iii) to allow composition of attack steps. The latter is used to search, actually composing attack steps, allowed by the modelled network. Additionally, and in support to these two aspects, we use algorithms from the domain of Link Analysis Ranking2 to rank ambients, providing metrics used in the search process, and to determine targets. More specifically, in this chapter, we introduce the syntax of MsAMS and its informal semantics through a series of definitions and examples. Furthermore, we introduce the method followed by the MsAMS approach, and details reflected in its proof-of-concept tool. Appendix A formalizes the reduction rules and rules of structural congruence used by MsAMS.
7.1 Proposed Solution As seen above, we address the requirements described in Section 4.2 with MsAMS, an approach for modelling and simulation of network attacks, the design of which draws heavily on Cardelli and Gordon’s work on Mobile Ambients (MA) [35, 33], some of its variants i.e. Safe Ambients [124] and Boxed Ambients [29] and some of its applications i.e. formal biology [34, 176]. Specifically, we address R1 , R2 and R4 by applying the concept of Mobile Ambients and Combinatorial Optimization techniques to the domain of network attacks, and R3 and R5 with Link Analysis Ranking algorithms, namely Google’s PageRank [27] and Kleinberg’s HITS (Hypertext Induced Topic Search) [116]. We have chosen Ambients because they allow the representation of a network as a graph of nested nodes. They also allow the representation of a variety of resources, such as firewalls, hosts, services, vulnerabilities, attackers, and credentials. This way, we are able to fully represent the topology of a network since hierarchy and grouping are intrinsic to Mobile Ambients. Ambients have capabilities which allow them to move. Furthermore, ambients can interact with other ambients depending on their capabilities. These two features, and additional capabilities specific to the domain of multi-step attacks, allow the representation of 2 This field of research deals with the ranking of search results using the link structure of web pages.
120
7.1. PROPOSED SOLUTION attack dynamics.
Finally, and in support to these two basic ingredients (Mobile Ambients and Optimization techniques), we replace the notion of financially-based asset value (refer to Section 3.4 on page 61), manually computed, by the notion of connectivity-based asset value, automatically computed by the algorithm HITS. This allows the network administrator to have an absolute and comparable view of asset value, where higher values indicate potential targets for attackers. PageRank provides another view of asset values that may support the administrator in determining targets as well. Additionally, HITS provides metrics used as a measure of cost of an attack step useful for the selection among alternatives. Recall that, because the gain from an attack and the cost of an attack as perceived by attackers is not available for defenders, we assume that asset value of targets and cost of an attack step, as perceived by defenders, is an approximation that allows defenders to gain awareness about the risk of attacks (as discussed in Section 3.4 on page 61). Defenders in this case are represented by the stakeholder “network administrator” that has full knowledge about the network, i.e. its topology, and authentication methods used. The ultimate goal of the administrator is to improve security of the network and to do that she can take advantage of the output of the MsAMS approach (via its proof-of-concept tool), i.e. possible attacks and the scores it produces.
7.1.1
Comparison between ELAS and MsAMS
The following table compares the approach presented in the previous chapter, i.e. ELAS, the approach presented in Chapter 6, and the one presented in this chapter, i.e. MsAMS. The comparison takes into account the six essential elements found in any optimization problems, listed at the beginning of Chapter 6.
121
CHAPTER 7. THE MSAMS SOLUTION: MULTI-STEP ATTACK MODELLING AND SIMULATION ELAS • solution representation inspired by Hoare’s Communicating Sequential Processes [96]; an atomic solution is an arc • edition operations (described in Section 6.2.3) to evolve an initial atomic solution into a multi-step attack; editions evolve a solution in terms of attack scenarios • fitness function based on asset value (added value of a solution tail set) and cost to traverse arcs (cost based on security level of protocols), both assumed given • stopping criterion based on added value of a solution tail set, above a threshold • starting nodes are given probable locations of attackers • search performed by an evolutionary algorithm based on pools of solutions; can perform forward and backward; search evolves a population of solutions
MsAMS • solution representation inspired by Cardelli and Gordon’s Mobile Ambients [35]; an atomic solution is an ambient action • reduction rules involving ambientattacker actions and ambients’ actions from the network; reductions necessarily evolve a solution stepby-step • fitness function based on scores returned by HITS algorithm calculated for each ambient; asset value used to determine targets based on the connectivity of the network (Link Analysis Ranking algorithms) • stopping criterion based on targets selected from scores returned by Link Analysis Ranking algorithms • starting point is the location of the ambient-attacker • search performed by an algorithm adapted from the original idea of pools; can perform forward, backward and credential search; search evolves one solution at a time
7.2 Running Example As the basis for introducing core concepts and the method followed by MsAMS, we use the network illustrated in Figure 7.1 adapted from Ingols et al. [105], and used as example by other Attack Graph researchers (e.g. [180]).
A
B
C
D
Allow C > E Allow D > E
E
F
Figure 7.1: An example network, adapted from Ingols et al. [105] In this example network the attacker is initially located in host A and wants to reach either host E or F which are protected by a firewall. The firewall only allows traffic from host C or D to host E. Additionally, all hosts have a remote-to122
7.3. MODELLING A NETWORK admin vulnerability in the single service they provide. As seen in Chapter 5, such vulnerabilities are remotely exploitable and their successful exploitation allow an attacker to gain full access to the data and resources of the host, potentially causing a complete impact on its confidentiality (C), integrity (I) and availability (A).
7.3 Modelling a Network The term modelling is overloaded and may have different meanings depending on the purpose and domain it relates to. In the field of engineering, a distinction is made between to-build and as-built models. To-build models involve technical drawings, such as structural design and architectural plans, of something one would like to build. The builder then executes the building process from scratch guided by these drawings. As-built models, in contrast, usually involve 3D CAD (Computer-Aided Design) models [92] of something one would like to adapt, restore, or assess [117]. Instead of representing an artifact as it should be built, it represents the artifact as it actually is which, most of the times, does not match exactly with the way it has been designed. In the field of Computer Science (CS), prescriptive models, i.e. to-build models, have received most of the attention of the research community [31]. For example, they are the focus of “Formal Methods”, such as Petri Nets [215], CSP [95], CCS [140]3 and many others, including Mobile Ambients [35]. They aim specially at the design, and analysis of systems or protocols not yet deployed. On the contrary, descriptive models, i.e. as-built models of existing systems, remain a research challenge in CS, as pointed by Calder [31]. However, complex and evolving systems are becoming more and more common. As-built models have to be as close as possible to actual systems in production to be useful. This way, results from analysis and reasoning on the model have higher chance to be valid and accurate on the systems they reflect in reality. Networks are overly complex, and the live analysis of their behavior in terms of the many facets of security, can overload the network itself. A live assessment of a network against possible multi-step attacks, e.g., typically requires data collectors spread over network segments or individual hosts and a central data analyzer, such as it happens with commercial product Skybox [197] (refer to Chapter 2). A less disruptive option is to use an as-built model of the network and perform analysis offline; this is the approach we take in MsAMS.
7.4 Overview of MsAMS MsAMS uses an as-built model of the network to simulate the dynamics of possible attacks allowed by the network modelled, i.e. by the specified network ambients and their capabilities. Therefore, MsAMS produces, as output, a specification 3 CSP:
Communicating Sequential Processes; CCS: Calculus of Communicating Systems.
123
CHAPTER 7. THE MSAMS SOLUTION: MULTI-STEP ATTACK MODELLING AND SIMULATION for an ambient-attacker that represents a multi-step attack. It is important to keep in mind that MsAMS supports the defender, i.e. the network administrator who assumes that the real attacker has a strategy (e.g. best cost-benefit from the attack) which allows him to anticipate attacks performed by a simulated attacker (an ambient-attacker). In this thesis, it is assumed that the network administrator models the network by gathering information from the various sources, listed below. However, it is possible to import these input to specify the model automatically; this will remain as future work. 1. the network configuration, including filtering rules from firewalls, and services running in each host, which can be obtained from firewall rule sets and security scanners like NMAP [154] 2. vulnerabilities in COTS present in the network, which can be obtained automatically from vulnerability scanning tools e.g. Nessus [149] 3. vulnerabilities attributes, in the format access-to-impact, which can be obtained from vulnerability databases such as the National Vulnerability Database (NVD) [161], as seen in Chapter 5 4. authentication methods (e.g. Kerberos [200]) used by network services and credentials involved in an abstract level; this information is useful to assess potential attacks that involve credential theft
7.5 Method followed by MsAMS The method followed by MsAMS is illustrated in Figure 7.2, and is composed of three visible stages (highlighted in the figure): (i) modelling of the network, (ii) ranking, and (iii) simulation of ambient-attackers, and one internal stage that feeds the stages of ranking and simulation. In the stage “Modelling of the network” a model of the network as Ambients is produced using the input mentioned in previous section. The specification of the model uses an adapted MA-like notation and allows representing ambients nesting, i.e their locality, and capabilities of ambients. This stage is described in Section 7.6. The stage “Processing of Virtual Links” uses the model of the network, output from the previous stage, and computes links between pair of ambients. This stage is described in Section 7.8, and the links generated feed the next two stages. The stage “Ranking of Network Ambients” uses the complete set of links from the previous stage arranged in a matrix, and computes ranks. These ranks are useful for determining potential targets and for providing metrics which guide the next stage. Ranking is explained in Section 7.9. 124
7.6. MODELLING WITH MSAMS Network Configuration
Vulnerabilities and attributes
Authentication methods (Credentials)
Modelling of the Network 1 Network Model as Ambients
Network Model as Ambients Subset of Links
2 Complete set of Links
Simulation of Ambient−Attackers Target 4 Multi−step Attacks
Processing of Virtual Links
and Metrics for Search
Ambient−attacker Initial Location
Ranking of Network Ambients 3 Connectivity−based Asset Values
Cost Metrics
Figure 7.2: Method followed by the MsAMS approach, reflected in its proof-ofconcept tool The stage “Simulation of Ambient-Attackers” uses a subset of links produced by the processing of virtual links stage (stage 2)4 , a target and metrics from the previous stage (stage 3), and the network model from the modelling stage (stage 1), to simulate attacks which allow an ambient-attacker to reach a target from an initial location. This stage is described in Section 7.7. We proceed describing the first and last stages, i.e. Modelling and Simulation in the next two sections before describing the other stages related to links and ranking.
7.6 Modelling with MsAMS MsAMS uses concepts and a notation inspired on ambient calculus [35]. Central to MA is the concept of Ambient which can be viewed as a place with a perimeter, or a closed box, explicitly enabling the distinction of what is inside from what is outside it. Ambients can be nested and are places where computation happens, i.e. processes run. Also central to MA is the notion of movement which allows ambients to enter other ambients, i.e. allows the interaction between ambients. To represent MsAMS conceptual models, we have developed a variant of the MA original syntax that is less concise and, therefore, in our opinion, more readable. Moreover, the original syntax has been adapted to the domain of multi-step 4 We will see later on in this chapter that the complete set of links are derived from Accept and In ambients actions, and the subset of links are only the Accept links.
125
CHAPTER 7. THE MSAMS SOLUTION: MULTI-STEP ATTACK MODELLING AND SIMULATION network attacks. Hence, new operators were introduced to facilitate modelling in this domain, in a similar way as Regev et al. [176] adapted MA to the domain of formal biology. We present its syntax and informal semantics (i.e. intended meaning of this variant in terms of attacks) in this chapter, and its reduction rules and rules of structural congruence in Appendix A, where we also discuss some basic differences between our variant of MA and Cardelli and Gordon’s ambient calculus. In MsAMS, a network is represented as an Ambient which contains other Ambients, e.g., hosts, subnets and firewalls, which recursively may contain other Ambients. Therefore, a subnet is an ambient that contains several other ambients representing hosts. A firewall is an ambient that protects ambients contained inside it by filtering interaction between outside and inside ambients. A host is an ambient that contains e.g. services, Operating Systems5 , and vulnerabilities. This nesting of ambients in the running example is illustrated in Figures 7.3(a) and 7.3(b). Figure 7.3(a) shows ambient net, containing five ambients A ,B, C, D and F W , which represent hosts A to D and firewall F W , respectively. The firewall is an ambient containing hosts E and F . Figure 7.3(b) provides a zoom view of host A, which contains three ambients representing a service sv A, a vulnerability v A, and the host Operating System OS A. Since all the other hosts are identical to host A in this example, their content is similar to the one represented in this figure. net A
FW
sv_A A
B
C
D
E
(a) The example network
F
v_A OS_A
(b) Zoom in host A
Figure 7.3: Modelling the example network as Ambients So far we have seen that a network is a nesting of ambients, and that ambients can represent networks, hosts, firewalls, services, vulnerabilities, and OS6 . Now we introduce some concepts and syntax that will allow us to specify, i.e. to model, a network in the notation used by MsAMS. We also introduce the concept of Locality Tree, the structure that actually represents the hierarchy of a network, as illustrated in Figures 7.3(a) and 7.3(b). An ambient has a name, and may contain processes running inside it. Each process can itself be an ambient (i.e. a sub-ambient), an action-rule which provides capabilities to the ambient, can be inactive, or a replicate. This is reflected 5 We view Operating System as an abstraction of the kernel and services of Operating Systems like Windows and Linux; via an OS one can access the data and resources of a host. 6 Operating System
126
7.6. MODELLING WITH MSAMS in the following syntax definitions. Definition 15 (An Ambient.) An ambient is a term x[Px ], where x is the name that uniquely identifies the ambient, and Px is a possibly empty composition of parallel processes7 ; the composition of two parallel processes P and Q being denoted P |Q. Definition 16 (A Process.) A process is one of: • an ambient • an inactive process8 , denoted 0 • Replicate(x), where x is a process (see Definition 27) • an action rule Definition 17 (An Action Rule.) An action rule is either: • sequential composition of an action A and an action rule R, denoted A.R (see Definition 30) • an action Note that in MsAMS, parallel composition is more restricted compared to the original Mobile Ambients [35]: parallel composition only appears within an ambient, not for arbitrary processes. This is sufficient in the domain of network attacks. Definition 18 (An Action.) An action is one of: • Enter n (synchronized entry in ambient n) • Accept n (synchronized accept from ambient n) • AllowIn n m (allowed interaction from ambient n to ambient m) • DenyUp n (denied interaction from ambient n) • Out n (synchronized issue of requests to ambient n) • In n (synchronized answer of requests from ambient n) • AcquireCred (synchronized acquisition of credential) • ReleaseCred c (synchronized release of credential represented by ambient c) The actions Enter and Accept are useful to represent synchronous movement, AllowIn and DenyUp are useful to represent filtering, Out and In are useful to represent synchronous communication, and AcquireCred and ReleaseCred are useful to represent synchronous acquisition of credentials. These actions are defined more precisely along this section and are defined formally in terms of reduction rules in Appendix A. Now, we assume the background of Graph Theory, as presented in [19], and from there we borrow the concepts of rooted tree (which we call simply tree), node, parent of a node, and children of a node. 7 An ambient with no processes running inside it is denoted x[λ]; for convenience simplified to x[ ]. 8 an inactive process is a process composed of no other ambients and no action-rules
127
CHAPTER 7. THE MSAMS SOLUTION: MULTI-STEP ATTACK MODELLING AND SIMULATION Definition 19 (A Place Graph.) A Place Graph associated with a set of ambients is a forest of labelled rooted trees, whose nodes are labelled by ambient names, and x is the parent of y if and only if x is the name of an ambient x[Px ] and y is an ambient in Px . The concept of Place Graph is borrowed from Milner’s pure bigraphs [141]. In this thesis, however, we deal only with networks whose place graphs have only one tree. As such we simplify the concept of Place Graph to the concept of Locality Tree. Definition 20 (A Locality Tree.) The Locality Tree associated with a network is identified with the only tree in its Place Graph. Definition 21 (Concept of Ancestor.) Given a model of a network n, x is an ancestor of y in n if and only if x is either parent of y or x is the parent of z and z is an ancestor of y in the locality tree associated with n. Definition 22 (Concept of Inside and Outside.) An ambient y is inside an ambient x if, and only if, x is an ancestor of y. Otherwise, y is outside x. The locality tree for the running example network viewed as ambients (Figure 7.3) is illustrated in Figure 7.4. With some concepts and MsAMS syntax in mind, we start the specification of the running example network. Example 5 The network of the running example is represented by the following ambient term9 : net[A|B|C|D|FW]
The ambient which represents the network is called net and it contains five processes running in parallel inside it: A, B, C, D and F W . Each of these processes is an ambient (sub-ambient of net), and represents either a host or a firewall. The processes contained on each of these sub-ambients are specified in separate lines because it would become unreadable to specify them all at once. However, a prerequisite for their specification is the action AllowIn, introduced next. Definition 23 (Action AllowIn.) An ambient x[P x], where P x contains an action AllowIn n y, allows interactions, i.e., movement, communication, or acquisition of credentials from any ambient (n0 inside) n10 to any ambient (y0 inside) y. These interactions are only allowed if, and only if, ambient y is inside x and ambient n is outside x. 9 In MsAMS, ambient names can contain letters a-z (either in upper or lower case), digits 0-9, and characters and $. However, an ambient name cannot start with a digit. Terms Enter, Accept, AllowIn, DenyUp, Out, In, AcquireCred, ReleaseCred and Replicate (either in upper or lower case, or mixed) are reserved and cannot be used as ambient names. 10 We have chosen to simplify “n or any other ambient n0 inside n” by “(n0 inside) n” to facilitate readability. We keep this simplified format for the remaining definitions of actions.
128
sv_a
v_a
os_b
os_a
sv_b
a
v_b
b
sv_c
c
net
os_c
sv_d
d
sv_e
v_c
os_d
os_e
v_d
e
v_e
fw
sv_f
f
os_f
v_f
7.6. MODELLING WITH MSAMS
129
Figure 7.4: The running example locality tree
CHAPTER 7. THE MSAMS SOLUTION: MULTI-STEP ATTACK MODELLING AND SIMULATION Example 6 Hosts A, B, C and D from Example 5 are defined in ambient terms as follows: A[sv_A|v_A|OS_A|AllowIn B[sv_B|v_B|OS_B|AllowIn C[sv_C|v_C|OS_C|AllowIn D[sv_D|v_D|OS_D|AllowIn
net net net net
v_A] v_B] v_C] v_D]
The ambient which represents host A contains four processes running in parallel in it: three of them are ambients (sub-ambients of A) namely sv A, v A, and OS A, and one is an action AllowIn net v A. This action defines a capability that ambient A has. In this case, it is if host A had a kind of “hole” on its perimeter letting ambients from within the ambient net to access, i.e. exploit, vulnerability v A. Recap that, as defined in Chapter 2, vulnerabilities allow direct access to protected data, i.e. they represent opportunities for attackers to enter a host despite protections it may have. Example 6 shows that hosts B to D also have “holes” giving access to vulnerabilities. In MsMAS semantics, it is assumed that, on the one hand, all interactions from ambients outside to ambients inside an ambient are by default denied, that is why AllowIn is required to determine what is allowed inside an ambient. On the other hand, all interactions from ambients inside to ambients outside an ambient are by default allowed; we use another action (DenyU p) to block it, when appropriated. Definition 24 (Action DenyUp.) An ambient x[P x], where P x contains an action DenyU p y, denies interactions from (y0 inside) y to any ambient outside x. These interactions are denied if, and only if, ambient y is inside x. The actions AllowIn and DenyU p are used to model firewall rules. In the running example, however, only the former action is used as shown in Example 7. Example 7 The firewall FW and hosts E and F of the running example are specified in the following ambient terms: FW[E|F|AllowIn sv_C E|AllowIn sv_D E] E[sv_E|v_E|OS_E|AllowIn net v_E] F[sv_F|v_F|OS_F|AllowIn net v_F]
This example shows that the ambient F W has four processes running in it: two ambients representing hosts E and F (similar to hosts A-D in Example 6), and two actions AllowIn. These actions restrict interactions originated from ambients outside F W to ambient inside it, allowing only interaction coming either from the services in C (sv C) or D (sv D) to host E. Therefore, without the firewall F W , hosts E and F would be accessible to the whole network, i.e. from any ambient located inside the ambient net. Service is regarded in a broad sense in MsAMS. Thus, not only services provided by server software listening on a network, such as HTTP services, file 130
7.6. MODELLING WITH MSAMS services or mail services, but also client applications, such as browsers or login interfaces, are also considered services. We have seen in Example 6 and 7 that hosts A-F contain vulnerabilities that are remotely exploitable. To specify access required to exploit them we use action Accept, defined next. Definition 25 (Action Accept.) An ambient x[P x], where P x contains an action Accept y and ambient y is outside x, accepts that (y0 inside) y enters x. The action Accept introduces the concept of movement. In MsAMS, movement (and communication) like in Safe Ambients [124], Boxed Ambients [29] and in BioAmbient [176], is synchronous. It means that a movement only happens if both parties (ambients) agree on it. Let’s illustrate this movement concept with an example. One can issue a Secure Shell (SSH) request but the connection will only be established if the SSH server running on the other end accepts this entry request. When this happens, it works as if this someone has actually moved from the ambient where the entry request has been issued to the ambient which accepted the request. Similarly, a connection is not established by just having an “accept request” ready, if there are no entry requests been issued. For movement, Enter and Accept must synchronize. As we have seen in the Web server example in Section 3.2 on page 47, the same happens when an attacker gains remote access to a host inside a network via a remotely accessible vulnerability; it works as if the attacker actually moved into the network. Figure 7.5(a) illustrates exactly this. In terms of ambients, if an ambient-attacker, inside ambient n (e.g. n represents the internet), issues an Enter y (where y is e.g. a host), it will only move if (i) all barriers on the way to reach y allow it, and if ambient y accepts (i.e. agrees) with the movement. The situation after-movement is illustrated in Figure 7.5(b), and is obtained via a reduction rule11 . The details of such movement reduction is presented in Appendix A, more specifically in Section A.2.1. An ambient moves as a whole, therefore, it carries all the processes running inside it, and can later perform further actions according to its capabilities after the move is complete. For completeness, we define action Enter next. Definition 26 (Action Enter.) An ambient x[P x], where P x contains an action Enter y and ambient y is outside x, has the capability to enter y. Example 8 The vulnerabilities present in the hosts of the running example are specified in the following ambient rules: v_A[Accept v_B[Accept v_C[Accept v_D[Accept v_E[Accept v_F[Accept 11 A
net] net] net] net] net] net]
reduction rule P → Q describes the evolution of process P into a new process Q [35].
131
CHAPTER 7. THE MSAMS SOLUTION: MULTI-STEP ATTACK MODELLING AND SIMULATION
z[AllowIn n y]
t[]
t[Enter y] (t is inside n)
z[AllowIn n y]
y[Accept n]
(a) Before-movement of ambient attacker
y[]
(b) After-movement of ambient attacker
Figure 7.5: Illustration of synchronous, inter-ambient movement These vulnerabilities are exploitable remotely, i.e. from any ambient within net. Since in the running example the attacker launching pad is host A, there is no need to represent the Internet containing the network net. Therefore, the concept of remote in this case extends to the network net itself. Note that in fact, although vulnerabilities v E and v F can be exploited from hosts A-D, as shown in the example, the firewall restricts this possibility to hosts C and D. As seen in Chapter 5, we model vulnerabilities not only in terms of the access required for their exploitation, but also in terms of their resulting impact. Since all vulnerabilities in the running example are of the type remote-to-admin (refer to the description of the running example in Section 7.2), they result potentially in complete impact on the confidentiality, integrity and availability (C I A) of the hosts containing them. It means that an attacker can enter the OS of these hosts acquiring access to the host data and resources. Example 9 The service and OS of each host allows the representation of complete impact on C I A in ambient terms as: sv_A[Accept v_A] OS_A[Accept sv_A] ... specification of sv and OS for hosts B, C, D, and E sv_F[Accept v_F] OS_F[Accept sv_F]
These rules mean that through the exploitation of v A (e.g. an ambient attacker located in net can enter in v A since v A[Accept net]), the ambient OS can be entered, i.e. it is possible for the attacker to gain full access to OS A via the vulnerable service sv A. This is possible since the vulnerable service accepts the vulnerability sv A[Accept v A] and the OS accepts the vulnerable service OS A[Accept sv A]. The fact that an attacker can enter the OS is an abstract representation of potential complete impact on the host C I A. Since all vulnerabilities are of the same type, v B to v F are modelled the same way as v A. The remaining actions In, Out, AcquireCred and ReleaseCred are defined in Sections 7.8 and 7.10.2, respectively. 132
7.6. MODELLING WITH MSAMS Up to now, we modelled the network of the running example in terms of nesting and capabilities of each ambient involved. However, we omitted two details. First, the complete specification of the running example contains the process Replicate to represent iteration, defined as follows. Definition 27 (Replication Process.) The replication process produces one replica of a process Px , and is denoted Replicate(Px ), structurally congruent to Px |Replicate(Px ). The replicate is used, in this thesis, to guarantee that process Px is not consumed after reduced, i.e. after it is executed. For example, after a vulnerability is exploited it can, in principle, be exploited again. Refer to Section A.3 in Appendix A for the equivalent congruence rule that apply to Replicate. Second, the outermost ambient of a network is indicated with the reserved term network, as defined next. Definition 28 (A Complete Network Specification.) A complete network specification is a network root definition followed by a sequence of ambient specifications. A network root definition is expressed using the syntax: network rootName, where rootName is the name of an ambient that is the root of the network and network is a reserved term. A sequence of ambient specifications is an ambient specification or an ambient specification followed by a sequence of ambient specifications, where an ambient specification is an ambient definition compliant with Definition 15. The following constraints apply to a complete network specification: • any ambient in the network specification is inside the ambient that is the root of the network • each ambient name occurring in the network specification has an unique ambient specification • an ambient can be a process of only one ambient in the network specification Example 10 The complete specification of the running example in ambient terms is: network net net[A|B|C|D|FW] FW[E|F|AllowIn sv_C E|AllowIn sv_D E] A[sv_A|v_A|OS_A|AllowIn net v_A] v_A[Replicate(Accept net)] sv_A[Replicate(Accept v_A)] OS_A[Replicate(Accept sv_A)] ... specification of hosts B, C, D, and E
133
CHAPTER 7. THE MSAMS SOLUTION: MULTI-STEP ATTACK MODELLING AND SIMULATION F[sv_F|v_F|OS_F|AllowIn net v_F] v_F[Replicate(Accept net)] sv_F[Replicate(Accept v_F)] OS_F[Replicate(Accept sv_F)]
The specification of hosts B-E have been omitted on the example because, as we have seen along this section, they are similar to the specification of hosts A and F .
7.7 Simulation of Attackers So far, we have fully specified the running example network, but we have not specified any attacker. In fact, an attacker is also represented as an Ambient, called ambient-attacker, and its specification is the output the defender, i.e. the network administrator, is looking for. The specification of an ambient-attacker is a process that shows a possible multi-step attack. This process is obtained via simulation, in the sense that, given the information available to the defender, i.e. the network model, the calculated scores, a supposed initial location for the ambient-attacker and a potential target, it uses a real-attacker strategy to search for steps which compose a multi-step attack, output of MsAMS. Therefore, an ambient-attacker has a particularity: its process is initially unknown (the opposite to what happens with the network ambients) and it has to be computed; its final process is an attack trace. Definition 29 (An Attack Trace.) An attack trace is a composition of processes Patt of an ambient-attacker att that allows att to move via successive reductions from its initial location in ambient y, inside ambient x (root of the network, Definition 28), to a target location represented by ambient z, also inside x. Process Patt becomes fully known when the target is reached. What the search basically does is to find, according to the current location of ambient-attacker, which alternative steps, also called candidate steps, better fit a real-attacker strategy. For now we assume that there is always one best alternative to be chosen, we come back to this aspect later in this section. In the ambient calculus and also in the variant we use, to take a step is to reduce two action terms, and so the search process consists of testing which action pairs can reduce successfully, and selecting the most promising pair of all pairs that can reduce successfully. The search engine considers options for moving an ambient (the attacker) from one location to another, starting in a given source and ending in the target. As such, to find a next ambient the ambient-attacker could move to, the search engine considers, based on its current location, the following aspects: 1. which actions the ambient-attacker could really perform, according to the network locality tree and the actions Accept and AllowIn on the network; possible kind of actions for an ambient-attacker are Enter and AcquireCred (this latter is introduced in Section 7.10.2) 134
7.7. SIMULATION OF ATTACKERS 2. which pair of actions can reduce successfully. Note that reductions do not actually need to be performed, it is enough to verify if they are possible, according to the reduction rules described in Appendix A 3. which steps represent the best cost-benefit for the ambient-attacker by means of HITS hub scores We now explain the search process described above using the running example as illustration. When the running example was introduced in Section 7.2, it was given that the attacker was supposedly located initially in host A. Therefore, we assume for the effect of simulation that the ambient-attacker is actually initially located in service sv A. This fact is reflected in the specification of this service12 and as such sv A is actually seen as: sv_A[att|Replicate(Accept v_A)]
In the end of the search, we will see that att is defined as: att[Enter v D.Enter sv D.Enter v E.Enter sv E]; this can be explained as follows. The possible actions that ambient-attacker att can potentially perform are either invest further in host A or find other vulnerabilities accessible from host A. What determines possible actions is the existence of links (see Definition 33) between ambientes derived from ambients capabilities. Assume for now that there is a link sv A → OS A and a link between sv A and the vulnerabilities; the processing of links will be described later in Section 7.8. Hence, the following actions are possible from sv A: (i) Enter OS A (ii) Enter v B (iii) Enter v C (iv) Enter v D (v) Enter v E (vi) Enter v F (vii) Enter v A Possibilities (v) and (vi) cannot reduce successfully because the firewall F W blocks the path between host A and host E and F (refer to Definition 43 on Appendix A; in this case there is no “pathTo” from sv A to v E and v F ). Furthermore, possibility (vii) is discarded because it would represent a cycle v A → sv A → v A. The reader can find more on this aspect in Section 7.11. Thus, the feasible candidate steps are (i)-(iv), as we will see next. 12 Refer
to the specification of sv A in Example 10.
135
CHAPTER 7. THE MSAMS SOLUTION: MULTI-STEP ATTACK MODELLING AND SIMULATION net
A
B
C
FW
D
E v_A
sv_A
F
OS_A
v_E
sv_E
OS_E
Figure 7.6: The arrows indicate possible directions the ambient-attacker can take from its initial location in sv A As an illustration, let’s consider the possibility (i) and see the successful reduction sv A|OS A next. sv_A[att[Enter OS_A]|Replicate(Accept v_A)]| OS_A[Replicate(Accept sv_A)]
According to the structural congruence that applies to the replication process (Definition 27), the above specification of ambient OS A is structurally congruent to the following specification of ambient OS A. sv_A[att[Enter OS_A]|Replicate(Accept v_A)]| OS_A[Accept sv_A|Replicate(Accept sv_A)]
In sv A, there is a Replicate in Accept v A to represent that even when reduced, this service remains vulnerable, i.e. accepting interactions with ambients coming from v A; an ambient entering v A means that the vulnerability is exploited. This only stops when the vulnerability is removed, e.g., via patching. The replicate in OS A has similar intent, and without it, the process Accept sv A would disappear with a successful reduction, as shown next. The reduction between Enter OS A and Accept sv A results in: sv_A[Replicate(Accept v_A)]| OS_A[att|Replicate(Accept sv_A)]
As stated in the previous section, reductions do not actually happen since it is enough that the search engine checks if they are feasible. Therefore, we have seen how the possible action (i) Enter OS A is really confirmed as a candidate step. Next, we illustrate why the action (iv) can also be considered as candidate step by examining the successful reduction between sv A|v D. sv_A[att[Enter v_D]|Replicate(Accept v_A)] v_D[Replicate(Accept net)]
136
7.7. SIMULATION OF ATTACKERS Per the structural congruence that applies to replication (Definition 27), the above ambientes in fact are: sv_A[att[Enter v_D]|Replicate(Accept v_A)] v_D[Accept net|Replicate(Accept net)]
The reduction between Enter v D and Accept net is possible because if the vulnerability accepts net, it accepts any ambient contained within net. The reduction results in: sv_A[Replicate(Accept v_A)] v_D[att|Replicate(Accept net)]
In a similar way actions (ii) Enter v B, (iii) Enter v C are analyzed, and these are confirmed as candidate steps for the ambient-attacker att. However, even when feasible it may be advantageous for the ambient-attacker to take a certain step rather than another, because of its strategy. Therefore, the search engine checks whether the target has been reached. If not, it selects the candidates with the highest hub scores among all the candidates; refer to Section 7.9 for an explanation about how hub scores are calculated using HITS algorithm, and to Section 7.11 for an explanation about the search itself. The search engine uses hub scores returned by HITS to select the most promising actions. Eventually, it also uses HITS authority scores depending on the fitness function selected, as mentioned further ahead in this section. PageRank scores and HITS authority scores are useful to provide insights about possible targets. The one using the MsAMS tool, a network administrator, has to select (i.e. to name) a target to execute the search, as we have seen in the previous section, and to do that scores calculated either by PageRank and by HITS can be of value to show, e.g., unexpected targets. Therefore, for the running example, the options for target are sv E or sv F (both with HITS authority score 0.06617166, see Table 7.2). In fact, these targets allow entering OS E and OS F which have authority score slightly lower (0.06523421), and could be regarded at first glance as more natural targets. However, the way to reach the OS is via the service in hosts E and F , therefore, it is understandable that the primary target are the services. We consider sv E as the target unless otherwise stated. In this case, the search shall continue since none of the candidate steps, i.e. actions (i)-(iv) above, reach the target sv E. In terms of hubs, OS A has score 0.010745351 and all vulnerabilities v B, v C and v D have score 0.18099977. Therefore, exploiting vulnerabilities in other hosts is more advantageous for the ambient-attacker than investing on further compromise of host A. Among the vulnerabilities themselves there is apparently no real difference (i.e. they are equally feasible and represent the same cost-benefit for the ambient-attacker). However, by looking one step ahead, it becomes evident that vulnerabilities v C and v D are more promising than v B because they permit crossing the firewall, where it is more likely that targets are located. HITS scores make this look-ahead feasible, because of a mutual relationship between hubs and authorities (see Section 7.9.3). Nevertheless, there is still 137
CHAPTER 7. THE MSAMS SOLUTION: MULTI-STEP ATTACK MODELLING AND SIMULATION net
A
B
sv_A
OS_A
C
FW
D
E v_A
v_E
sv_E
F
OS_E
TARGET
Figure 7.7: The arrows indicate possible directions an attacker can take from host D until the target sv E is reached
a draw between v C and v D, hence the choice among them is non-deterministic. The search, as explained in Section 7.11, can either select the next candidate for a move based on the hubbiest-node fitness function or based on the look-ahead fitness function. Let’s suppose that the candidate step chosen is Enter sv D (remember that each selection must be allowed by reduction and that each selection is recorded in a trace). In this case, it opens up new opportunities to the ambient-attacker since from hosts C or D it is possible to traverse the firewall and reach host E where the target sv E is, as illustrated in Figure 7.7. By repeating the computation above, the following trace representing the process which allows the ambient-ambient att initially located in ambient sv A to reach the target, ambient sv E. Enter v_D.Enter sv_D.Enter v_E.Enter sv_E
This process shows the possible attack ADE for the ambient-attacker att; it represents, in this case, a sequential composition of actions. The search could return only this possible attack, representing the best-cost benefit attack, or all possible attacks, i.e. several possible processes for the ambient-attacker att. Definition 30 (Sequential Composition.) A sequential composition of actions A and B, denoted A.B, establishes that A is executed first and then, when completed, B is executed13 . Note that internally the MsAMS implementation uses a hierarchical naming convention, a DNS-like (Domain Name System) approach to name ambients. However, in the Internet the namespace follows a descending hierarchy of administrative domains (separated by dot) from right-to-left, e.g. in is.ewi.utwente.nl 13 In
138
MA, this composite is called path [33].
7.8. PROCESSING VIRTUAL LINKS nl is a top-level domain, and is is a low-level domain. In the expanded name of an ambient, we have the opposite, i.e. a descending order of hierarchy from left-to-right (separated by $), e.g. $net$FW$E$v E. Therefore, this expanded naming scheme indicates if a firewall is traversed, which allows us to relate the output path to the actual network path. Another interesting point of this naming convention is the reuse of ambient specification, discussed in Chapter 8. Now that we have an overview about how MsAMS works and about its output, the next sections aim to fill the gaps left as assumptions in this section.
7.8 Processing Virtual Links Virtual links define the connectivity of the network in terms of possible movement and communication. In the previous section we have seen that the possible actions (i.e. steps) the ambient-attacker can take from its current location are determined by the existence of links between ambients. For example, ambient OS A is specified as OS A[Accept sv A] meaning that it accepts the service sv A and any of its subambients. If an ambient-attacker enters sv A it potentially can enter OS A by issuing an Enter OS A. Thus, there is in fact a link sv A → OS A. The same way, there is a link between sv A → v B because v B is a remotely exploitable vulnerability and, therefore, accepts the network v B[Accept net]. However, there is no link between s A and v E because the firewall does not allow it, as we will see below. For now, it is important to understand that not only the action Accept establishes links but also the action In, defined next. The reason being that both increase the importance (i.e. authority) of an ambient, as we discuss in Section 7.9.1. Definition 31 (Action In.) An ambient x[P x], where P x contains an action In y and ambient y is outside x, is able to answer requests issued by (y0 inside) y. For completeness, we introduce the counterpart of action In, i.e. action Out. Definition 32 (Action Out.) An ambient x[P x], where P x contains an action Out y and ambient y is outside x, is able to issue requests to y. A reduction between actions In and Out allows communication between ambients. The details of such reduction is presented in Section A.2.2 on Appendix A. A virtual link is defined as follows. Definition 33 (Concept of Link.) There is a link from ambient x[P x] to ambient y[P y] if and only if P y contains an action Accept z or In z, such that ambient x is inside ambient z, and pathTo(z,y) is True (Definition 43 in Appendix A). 139
CHAPTER 7. THE MSAMS SOLUTION: MULTI-STEP ATTACK MODELLING AND SIMULATION Intuitively, a pathTo letting ambient x into ambient y is a path that would allow x to exit from ambient z to the Least Common Ancestor of x and y (defined next) and let it enter through successive firewalls into y. Definition 34 (Concept of Least Common Ancestor.) The Least Common Ancestor of ambients x and y, denoted lca(x, y), is an ambient z such that: • z is ancestor of both x and y, and • for any other ambient z0, such that z0 is ancestor of both x and y, then z0 is ancestor of z Example 11 Considering the running example locality tree illustrated in Figure 7.4, we have the following lca: lca(sv E, F ) ⇒ F W lca(v A, OS A) ⇒ A lca(sv B, net) ⇒ net As already mentioned, a link from ambient x to ambient y is created if x can actually move into y or communicate with y. Let’s take as an example the firewall F W . Although v E accepts net, meaning that potentially any ambient located inside net can reach v E, the firewall restricts this possibility to ambients coming from hosts C or D. Hence, we have in fact two virtual links sv C → v E and sv D → v E. The computation of links is performed according to the simplified pseudocode procedure, presented in Figure 7.8, and the output of this computation is: (i) A set of links derived from actions Accept and In, used to generate an adjacency matrix of network links L where Lij is one, if there is a link from ambient i to ambient j, where j ∈ [1, n] and n is the number of ambients modelled, and zero, otherwise. This n × n matrix is sparse since not every ambient links to every other ambient. More about these links is discussed in Section 7.9.1. (ii) A table of Accept links derived only from action Accept. This table is used to search for attacks as explained in Section 7.11. We assume that, in terms of search, entering ambients made feasible by Accept actions represent an attack step while answering requests made feasible by In actions do not represent an attack step.
7.9 Computing Ranks using the Matrix of Network Links As mentioned before, we borrow from Link Analysis Ranking, more specifically from HITS (Hypertext Induced Topic Search) algorithm [116] and PageRank [27], 140
7.9. COMPUTING RANKS USING THE MATRIX OF NETWORK LINKS computeLinks(ambients) FOR all pairs of ambients x,y: L[x,y] = 0 FOR each ambient y[Py]: FOR each (Accept x) or (In x) in Py: FOR each z[Pz] inside x: IF there is a pathTo from z to y L[z,y] = 1
Figure 7.8: Simplified pseudocode of the computation of links algorithm; refer to Appendix A for definition of pathTo (Definition 43, in Appendix A) for two tasks which support the simulation of attacks, already discussed in Section 7.7: 1. To assign asset value automatically to all ambients represented in the network, based on network connectivity rather than on financial value, providing an absolute and comparable view of asset value. Those values support the network administrator using the MsAMS tool in the process of selecting a target 2. To assign a cost measure automatically to all ambients represented in the network, also based on network connectivity rather than on financial value, providing an absolute and comparable view of cost for attack steps. Such a measure of cost allows the incorporation of rationality to the ambientattacker which simulates a strategy of a real-attacker; in the case of costbenefit strategy, preference can be given for alternative attack steps either that represent lower cost (i.e. the hubbiest ambients among alternatives) or that represent lower cost looking at one step ahead (i.e. the authoritiest ambients among one-step-ahead alternatives). More details about HITS and PageRank can be found in Sections 7.9.3 and 7.9.2, respectively.
7.9.1
Notions of Inlink, Outlink & Importance in Ambients
In the World-Wide-Web domain, the structure of webpages represents a graph where each node is a webpage, and a direct arc between webpages 1 and 2 means that webpage 1 contains a hyperlink to webpage 2, as illustrated in Figure 7.9. In this figure, webpage 2 has 2 inlinks and 3 outlinks. Borrowed from social network analysis [190], the underlying assumptions of Link Analysis Ranking algorithms, such as PageRank and HITS, are related to the notion of importance or authority: 1. The more citations, i.e. inlinks, a webpage has, the more important (authoritative) it becomes. 141
CHAPTER 7. THE MSAMS SOLUTION: MULTI-STEP ATTACK MODELLING AND SIMULATION
4 1 2
5
3 6
Figure 7.9: Webpages hyperlink structure represented on a graph
2. A citation from an important webpage, i.e. with a high rank, has more weight than a citation from a non-important webpage, i.e. with a lower rank. It means that ranks propagate authority from one webpage to another. Note that inlinks and outlinks are regarded differently by HITS and PageRank, as we will see in the next sections. As a consequence, the list of resulting top authority webpages they produce are different. For example, the search “automobile makers” with HITS, using search engine Ask.com, results in the actual car manufacturers websites (e.g. Honda, Ford, Toyota) as authorities, while the same search with Google.com lists Automotive Makers in the Yahoo! Directory webpage, Wikipedia automotive industry page, and Automobile Manufacturers Index by IndexOfTheWeb.com as the top most authoritative webpages14 . How inlinks (and outlinks) affect PageRank and HITS scores is not a trivial problem, and has motivated many studies (e.g. [13, 216]). The notions of inlink, outlink and importance are also present in the domain of network attacks. As we have seen in Section 7.8, actions Accept and In determine network virtual links: • An ambient m specified as m[In n] answers requests from any ambient inside n. Therefore, there is an inlink from n to m, i.e., m has an inlink from n and n has an outlink to m. In fact, there is an inlink from any ambient x inside n to m. The more ambients are served by m, the more it becomes important. • An ambient m specified as m[Accept n] allows ambients x inside n (or n as a whole) to move to m potentially having access to its content. Similar to the previous case, there is an inlink from any ambient x inside n to m. The more ambients can move to m, the more it gains importance. Actually, although In and Accept contribute to the importance of an ambient, the latter is much more dangerous than the former from the point of view of attacks. 14 These
142
searches were performed in May 2009.
7.9. COMPUTING RANKS USING THE MATRIX OF NETWORK LINKS sv_C v_F
sv_D
sv_E
OS_E
v_D
v_E
sv_E OS_F
v_C
sv_F
v_B v_F
v_A
Figure 7.10: Inlinks and outlinks for v E from the running example ambient
For the purpose of illustration, we show in Figure 7.10 inlinks and outlinks for ambient sv F of the running example, specified in Section 7.6. They have been processed according to the procedure described in Section 7.8. Recall that v E[Accept net], therefore, in this case we only have inlinks and outlinks derived from the action Accept. Therefore, the figure shows inlinks allowed from firewall F W , i.e. sv C → v E and sv D → v E, and inlinks from within the firewall, i.e. sv E → v E, OS E → v E, OS F → v E, sv F → v E and v F → v E. The same way, the figure also shows outlinks to ambients inside the firewall. i.e. v E → v F and v E → sv E, and outlinks to ambients located outside the firewall, i.e. v E → v A, v E → v B, v E → v C, and v E → v D. It is important to keep in mind that HITS scores are the ones used in the process of searching for attacks. PageRank scores are used to provide a different perspective on authorities which might be useful for the network administrator in the process of selecting a target, required for simulation of attacks, as seen in Section 7.7.
7.9.2
Ranking Scheme from PageRank
PageRank is a ranking algorithm developed by Brin and Page [27]. It is the basis of Google search engine, the best known search engine nowadays. As already mentioned in Section 7.9.1, we use HITS as our main source of scores to search for attacks, and to select targets based on its authority scores as a measure of asset value. PageRank scores provide a different perspective of authorities (we have seen that different ranking algorithms provide different results) for the ambients modelled, which might give the network administrator interesting insights about possible targets. PageRank is a measure of importance of webpages which allows comparing and, therefore, ranking them in decreasing order. As we have seen by the first underlying assumption of Link Analysis Ranking algorithms, mentioned in the previous section, the PageRank value π of a webpage depends on the π of its inlinks. If we consider the small webgraph from Figure 7.9, the π of webpage P2 143
CHAPTER 7. THE MSAMS SOLUTION: MULTI-STEP ATTACK MODELLING AND SIMULATION is given by:
π(P2 ) =
π(P1 ) π(P3 ) + , where |OU TPj | is the number of outlinks of Pj |OU TP1 | |OU TP3 |
The formula complies with the second underlying assumption mentioned above since π(P1 ) is directly proportional to π(P2 ) and π(P3 ). Therefore, webpages P1 and P3 propagate importance to webpage P2 , and P2 depends not only on the number of its inlinks but also on their importance. It also shows that each term π(Pj ) |OU TPj | is affected by the number of outlinks of webpage Pj . Hence, the more outlinks a webpage has, the more diluted is the amount of importance that it propagates to each webpage it points to. The formula also shows for Figure 7.9 that π(P5 ) depends on π(P2 ) which depends on π(P1 ) which depends on the π of its inlinks and so on, turning this formula unfeasible to be resolved. To overcome this problem, Brin and Page proposed to calculate π in iterations. Basically, initially all webpages have π equal to n1 , where n is the total number of webpages indexed by Google, and each iteration k + 1 depends on the values obtained on the previous iteration k, as shown in the following formula [120]: πk+1 (Pi ) =
X Pj ∈INPi
πk (Pj ) , |OU TPj |
� � �7.1 �
where INPi is the set of inlinks of Pi and |OU TPj | is the number of outlinks of Pj After a number of iterations, the π for all webpages converge and become stable. It is important to notice that even for a matrix with billions of nodes, the PageRank algorithm tends to converge in less than a hundred iterations [120]. The summation Equation 7.1 is resolved efficiently via power method [120, Chapter 4]. Brin and Page made adjustments to the matrix used to compute a vector of π from a matrix akin to the matrix of network links L (described in Section 7.8) to a matrix G described next. Therefore, similar to a webpage, the π of an ambient Ambi is proportional to the sum of π values of its inlinking ambients Ambj . The ~π is obtained through Equation 7.2. � � ~π (k+1)T = ~π (k)T G, where G = αH + (α~a + (1 − α)~e)1/ne~T �7.2 � Thus, matrix G is computed by means of the sparse matrix |n| × |n| of links 1 if there is a link from ambient i to ambient j and zero, H where Hij is |Amb i| otherwise. Note that matrix H has the same structure as matrix L (as seen above), but non-zero values are different; in L non-zero elements are ones, while 1 in H non-zero elements are |Amb . The parameter α ∈ [0, 1] is the damping i| factor, which conveys the idea of random walk. The damping factor α for an ambient-based graph still represents this notion but it is constrained by ambients 144
7.9. COMPUTING RANKS USING THE MATRIX OF NETWORK LINKS capabilities. Thus, the attacker follows the flow of forward links with priority α and can jump to a random, but still feasible, ambient with priority 1 − α. Vector ~a contains one if ambient i is a dangling node, i.e. if it contains no outlinks, 1 equal and zero otherwise. It corrects dangling ambients (nodes) by giving |n| probability that any ambient is selected from them. Vector ~e is a column vector of ones, e~T is the transpose of vector e, n is the number of ambients while π T is a row vector containing the PageRank scores, after convergence. The PageRank vector for the running example (Section 7.6) is obtained after 12 iterations (α = 0.85), and is shown in Table 7.1. The highest scores returned by PageRank in this case are the vulnerabilities in hosts A-D (0.11489447). Roughly inlinks , however this analysis is not trivial because of they have the better rate outlinks the propagation of importance mentioned above. Therefore, PageRanks showed disappointing in providing insights about targets for the running example, instead they showed top priority vulnerabilities to patch with the highest scores, an also interesting insight for the network administrator. This will also be observed in examples in Chapter 8.
7.9.3
Ranking Scheme from HITS
Hyperlink Induced Topic Search (HITS) is a ranking algorithm developed by Kleinberg [116]. It is the basis of Teoma search engine (by IBM), now incorporated to Ask.com (www.ask.com) search engine. Although HITS also complies with both underlying assumptions of Link Analysis Ranking algorithms mentioned in Section 7.9.1, it treats outlinks differently. Instead of diluting authority, outlinks produce a completely separate score. As already mentioned in Section 7.9, HITS produces two types of score: authority and hub. Webpages with high authority score are important webpages determined by their number of inlinks, and webpages with high hub score are webpages that contain hyperlink to authorities, i.e. determined by their number of outlinks. Therefore, here again there is a kind of propagation reinforcing a mutual relationship between authorities and hubs, i.e. “good” hubs point to “good” authorities, and “good” authorities are pointed by “good” hubs, as illustrated in Figure 7.11. It is exactly this feature of HITS that is appealing for finding attacks as an optimization problem because, in principle, giving preference to the hubbiest ambients in the neighborhood will represent a better cost-benefit to attackers since these ambients will lead to the highest authorities. The word topic in Hyperlink Induced Topic Search (HITS) indicates another difference between PageRank and HITS. While the former only produces π values relative to the entire universe of webpages indexed, the latter can produce scores relative to a specific topic. Therefore, HITS is called query-dependent since from a set of hints (i.e. keywords) provided by a user, HITS selects a sub-graph in their neighborhood and produces scores, i.e. search results, relative to it. Authority ~xk and hub ~y k scores are calculated with Equations 7.3 and 7.4, respectively, where IN is the set of inlinks of ambient Ambi , OU T is the set of outlinks of Ambi , and k is the iteration counter. 145
CHAPTER 7. THE MSAMS SOLUTION: MULTI-STEP ATTACK MODELLING AND SIMULATION ambient net A sv A vA OS A B sv B vB OS B C sv C vC OS C D sv D vD OS D FW E sv E vE OS E F sv F vF OS F
pagerank value 0.018867925 0.018867925 0.03610209 0.11489447 0.023200173 0.018867925 0.03610209 0.11489447 0.023200173 0.018867925 0.03610209 0.11489447 0.022478132 0.018867925 0.03610209 0.11489447 0.022478132 0.018867925 0.018867925 0.022579204 0.03711272 0.02080329 0.018867925 0.021922804 0.030548707 0.020747026
Table 7.1: Scores produced by PageRank for the running example (α = 0.85)
X
~xk (Ambi ) =
~y (k−1) (Ambj )
Ambj ∈INAmbi
~y k (Ambi ) =
X Ambj ∈OU TAmbi
~xk (Ambj )
� � �7.3 � � � �7.4 �
The summation Equations 7.3 and 7.4 are resolved efficiently by means of power method [120, Chapter 11] applied to the matrix resulting from the multiplication of matrix L and its transpose LT : LT L (called authority matrix) or LLT (called hub matrix). In this thesis we use the independent query HITS introduced in [120]. Authority scores are obtained resolving Equation 7.5 and hub scores are obtained resolving Equation 7.6, where L is the matrix of zeros and 146
7.9. COMPUTING RANKS USING THE MATRIX OF NETWORK LINKS
A
H H: Hub A: Authority
Figure 7.11: Mutual relationship between authorities and hubs in HITS (adapted from [120, Figure 3.3]) ones containing the virtual links between every pair of ambients Ambi and Ambj , as described in Section 7.8. ~xk = ξLT L~xk−1 +
(1 − ξ) en
� � �7.5 �
� � (1 − ξ) �7.6 � en In Equations 7.5 and 7.6, ξ ∈ [0, 1] is a parameter equivalent to the damping factor in PageRank (i.e. a probability to not follow direct links), e is a column vector of ones, and n is the number of nodes in the graph. Note that ~x0 and ~y 0 are initialized with n1 . The standard query-dependent HITS authority vector is obtained by the equation ~xk = LT L~xk−1 and the hub vector by the equation ~y k = LLT ~y k−1 . The scores produced by HITS for the running example are shown in Table 7.2. The scores converged after 9 iterations with ξ = 0.85. This table shows that the hubbiest ambients are the vulnerabilities in hosts A-D (0.18099977), representing the lower cost alternatives for the ambient-attacker. Interesting to see that the highest hubs from HITS match with the highest PageRank scores for this example. These vulnerabilities allow access to the authoritiest ambients which are the services, specially sv E and sv F (0.06617166), therefore, they represent targets. These results illustrate the underlying assumption of HITS that “good hubs point to good authorities”, since vulnerabilities (high hubs) point to services (high authorities). In Table 7.2 we observe that the authority scores of ambient net and ambients A-F appear as zero. In fact, those values are extremely low, so low that the precision of output used by the HITS implementation in MsAMS tool was not enough to make them visible. Those values are low because virtual links do not point directly to hosts since they do not contain Accept or In actions, but rather point to assets in the host, e.g., to services. In reality also host boxes per se are not assets, however, the services they provide, and the data they contain might be. ~y k = ξLLT ~y k−1 +
147
CHAPTER 7. THE MSAMS SOLUTION: MULTI-STEP ATTACK MODELLING AND SIMULATION ambient net A sv A vA OS A B sv B vB OS B C sv C vC OS C D sv D vD OS D FW E sv E vE OS E F sv F vF OS F
authority score 0.0 0.0 0.055106666 0.04133 0.054325968 0.0 0.055106666 0.04133 0.054325968 0.0 0.06153637 0.04133 0.054325968 0.0 0.06153637 0.04133 0.054325968 0.0 0.0 0.06617166 0.059741955 0.06523421 0.0 0.06617166 0.06153637 0.06523421
hub score 3.6234493e-4 3.6234493e-4 0.008150898 0.18099977 0.010745351 3.6234493e-4 0.008150898 0.18099977 0.010745351 3.6234493e-4 0.008150898 0.18099977 0.011959211 3.6234493e-4 0.008150898 0.18099977 0.011959211 3.6234493e-4 3.6234493e-4 0.011621917 0.084683895 0.012835776 3.6234493e-4 0.011959211 0.061152868 0.012835776
Table 7.2: Authority and hub scores produced by HITS for the running example (ξ = 0.85)
7.10 Further Modelling In this section, the modelling of vulnerabilities, services and protocols is further discussed in Section 7.10.1. Besides, the modelling of credentials and the dynamics involved in their acquisition is introduced in Section 7.10.2.
7.10.1
Modelling Vulnerabilities, Services and Protocols
7.10.1.1
Vulnerabilities
As seen in Chapter 5, we model a vulnerability in terms of access required for its exploitation and impact that potentially results from its successful exploitation. 148
7.10. FURTHER MODELLING In the modelling of the running example, in Section 7.6, we have discussed the modelling of vulnerabilities which require remote access and result in complete impact on the C I A15 of the vulnerable host16 . It is important to keep in mind that we use the abstraction of entering a vulnerability ambient to represent the exploitation of a vulnerability in reality. In this section, we present the modelling of different types of vulnerabilities based on the access-to-impact paradigm. We assume in this thesis that a list of vulnerabilities present in the services running on each host17 of the network is available to the network administrator because this list can be obtained from vulnerability scanning tools such as Nessus [149]. Example 12 A vulnerability v which requires remote access to be exploited is specified in ambient terms as follows, where net is the root of the network. v[Accept net]
Example 13 A vulnerability v which requires local access to be exploited is specified in ambient terms as follows, where x is an ambient representing a host. v[Accept x]
In the running example we represented complete impact of the vulnerabilities using the following modelling construct: Example 14 A vulnerability remotely exploitable which results in complete impact on the host C I A has been modelled for the running example (see Example 10) in ambient terms as follows. h[v|s|OS|AllowIn net v] v[Accept net] s[Accept v] OS[Accept s]
This modelling indicates that the service s is vulnerable because it accepts the vulnerability v and any ambient inside v. Hence, by entering v, an ambientattacker can ultimately enter the OS acquiring privileged and unrestricted access to data and resources (e.g. programs) of the host. In this section we show the comparative modelling of 4 types of vulnerabilities which we encountered in our analysis of the NVD, reported in Chapter 5. To do so, we revisit our modelling of complete C I A impact shown in the example above and used to model the vulnerabilities of the running example. From the NVD analysis we derived the following impact-based classification of vulnerabilities (refer to Chapter 5) that can result from their successful exploitation. 15 confidentiality,
integrity and availability type of vulnerability is also called remote-to-admin. 17 Recall from Section 7.6 that we have a broad view of services which includes not only server software listening on a network but also client applications, such as browsers or login interfaces. 16 This
149
CHAPTER 7. THE MSAMS SOLUTION: MULTI-STEP ATTACK MODELLING AND SIMULATION 1. complete-CIA: vulnerabilities in this class result in complete C I A impact on a host; it means that the successful exploitation of a vulnerability of this type allows an attacker to acquire privileged and unrestricted access to data and resources (e.g. programs) of the host. Therefore, the attacker can read and write OS data (e.g. modify configurations) and user-level data, or can execute privileged OS programs (e.g. installation commands) and user-level programs. 2. partial-CIA: vulnerabilities in this class result in partial C I A impact on a host; it means that the successful exploitation of a vulnerability of this type allows an attacker to acquire non-privileged and restricted access to data and resources (e.g. programs) of the host. Therefore, the attacker can read and write user-level data, or can execute user-level non-privileged programs. 3. only-C: vulnerabilities in this class result in impact restricted to the confidentiality of data contained in a host; it means that the successful exploitation of a vulnerability of this type allows an attacker to acquire the ability to read data, but not to write. Therefore, the attacker gains restricted access to data and no ability to execute programs. 4. only-I: vulnerabilities in this class result in impact restricted to the integrity of data contained in a host; it means that the successful exploitation of a vulnerability of this type allows an attacker to acquire the ability to read and write data. Therefore, the attacker gains unrestricted access to data and no ability to execute programs. 5. only-A: vulnerabilities in this class result in impact restricted to the availability of the host; it means that the successful exploitation of a vulnerability of this type allows an attacker to make this host unavailable.
To make the difference between vulnerability types 1-4 instead of simply using ambient OS, as in the running example, we use two ambients: DT representing generically data (OS data and user-level data) and P R representing generically the ability to execute programs (OS programs and user-level programs). The distinction between restricted and unrestricted is made using actions Accept and In, respectively. Table 7.3 provides an overview of these types of vulnerability against their modelling. Vulnerability Type complete-CIA partial-CIA only-C only-I
Data DT restricted unrestricted X X X X
Programs PR restricted unrestricted X X
Table 7.3: Schematic overview of types of vulnerabilities against modelling abstraction
Example 15 A vulnerability remotely exploitable which results in complete impact on the host C I A is modelled in ambient terms as follows. 150
7.10. FURTHER MODELLING h[v|s|DT|PR|AllowIn net v] v[Accept net] s[Accept v] DT[Accept s] PR[Accept s]
In this example the vulnerable service s provides unrestricted access to data and execution of programs represented by the Accept s. Example 16 A vulnerability remotely exploitable which results in partial impact on the host C I A is modelled in ambient terms as follows. h[v|s|DT|PR|AllowIn net v] v[Accept net] s[Accept v] DT[In s] PR[In s]
In this example the vulnerable service s provides restricted access to data and execution of programs represented by In s. Example 17 A vulnerability remotely exploitable which results in impact on the host confidentiality is modelled in ambient terms as follows. h[v|s|DT|PR|AllowIn net v] v[Accept net] s[Accept v] DT[In s] PR[]
In this example the vulnerable service s provides restricted access to data and no execution of programs represented by DT [In s] and P R[ ]18 , respectively. Example 18 A vulnerability remotely exploitable which results in impact on the host integrity is modelled in ambient terms as follows. h[v|s|DT|PR|AllowIn net v] v[Accept net] s[Accept v] DT[Accept s] PR[]
In this example the vulnerable service s provides unrestricted access to data and no execution of programs represented by DT [Accept s]. Note that either with restricted or unrestricted access to data and programs encapsulated by a host OS, we assume that the attacker can proceed with an attack, i.e. it is not required that an ambient-attacker reaches (enters) the host OS before it can move to another host. The reason is that entering the vulnerable 18 It
means that ambient P R has no processes running inside it (according to Definition 15).
151
CHAPTER 7. THE MSAMS SOLUTION: MULTI-STEP ATTACK MODELLING AND SIMULATION service s can be enough to allow the attacker e.g. to acquire a credential, as we will see in Section 7.10.2. We only make the distinction among the above mentioned different types of vulnerabilities using ambients DT and P R when necessary, otherwise we use ambient OS. The last type of vulnerabilities listed earlier which result in only-A (only availability) impact cannot be modelled by the current version of MsAMS. It would require changes such as the introduction of action “open” or dynamics of the network itself. However, the open action, e.g., has security implications discussed in Section 7.13.1. Therefore, this will remain as future work discussed in Chapter 10. 7.10.1.2
Services and Protocols
In contrast with the vulnerable services presented for the running example, let’s now consider a host h with a non-vulnerable service s. Example 19 A non-vulnerable service is typically modelled in ambient terms as follows. h[s|DT|PR|AllowIn net s] s[In net] DT[In s] PR[In s] or simply h[s|OS|AllowIn net s] s[In net] OS[In s]
Two other entities, mentioned in requirement R1 (Chapter 4), are TCP/UDP ports and protocols. Let’s consider an example Web server W S. It provides http service (http s) listening on port TCP/80. This service answers requests that comply with the HTTP protocol, and the WS Operating System answers requests coming from the service. Example 20 Web server WS is modelled in ambient terms as follows. WS[http_s|HTTP|OS|AllowIn internet HTTP] HTTP[Accept internet] http_s[In HTTP] OS[In http_s]
This example specification shows the normal behavior of a WS with action AllowIn representing, in this case, the TCP/80 port. This port allows access to ambient http s through the ambient HTTP; it means that the service only recognizes requests coming from HTTP ambient. Let’s now assume that the WS is vulnerable, i.e. it contains vulnerability CVE-2008-3257 as described in Chapter 3. In fact, the http service is vulnerable 152
7.10. FURTHER MODELLING and accepts specially crafted HTTP requests coming from the Internet that may give root access to data and resources encapsulated by the OS for a remote attacker. Example 21 A Web server WS with a vulnerable http service may be modelled as follows. WS[http_s|HTTP|OS|v|AllowIn internet HTTP] HTTP[Accept internet] v[Accept HTTP] http_s[Accept v] OS[Accept http_s]
This example specification shows service http s as vulnerable since it accepts vulnerability v. A specially crafted HTTP request, entry point to the host via port TCP/80, may allow an ambient-attacker to enter vulnerability v representing its exploitation and, via the service, to enter the OS. This is represented by the fact that the OS ambient not only answers requests from the service but also accepts entry from ambient http s or from ambients within http s. This level of details, however, obfuscates the fact that vulnerability v represents an “open door” to the host since it is remotely accessible, similar to vulnerabilities in the running example and in some examples in Section 7.10.1.1. Furthermore, it increases the number of ambients without adding any real benefit to the model. Therefore, although it is possible to represent protocols as shown, it is our choice not to do so in the remaining models presented in this thesis. The examples presented in this section can be viewed as building blocks that may guide the network administrator when modelling a network.
7.10.2
Modelling Credentials
In the modelling of the running example (Section 7.6), we have seen that all hosts contained vulnerable services not protected by credentials19 . In fact, these services could even be protected by credentials because a vulnerability, as defined in Chapter 2, circumvents protections such as credentials. Therefore, in both cases (service protected or not by credentials), there is no real need to represent credentials explicitly because what counts in the end is the fact that services are vulnerable. Figure 7.12 illustrates this distinction between services vulnerable or non-vulnerable and protected or not-protected, and shows the focus of the Attack Graph community which typically uncovers attacks represented by chains of vulnerabilities, although some approaches (mentioned in Section 2.2.3.6 on page 36) consider the case where to exploit a vulnerability a credential is required. We assume that credentials may be require to access services, and not to exploit vulnerabilities. 19 A credential is anything used for authentication such as a password, a private session key, a passphrase, etc.
153
CHAPTER 7. THE MSAMS SOLUTION: MULTI-STEP ATTACK MODELLING AND SIMULATION
vulnerable
non vulnerable
protected by credential
not protected by credential
compromise via vulnerability in service
compromise via credential theft or via vulnerability in credential
Attack Graph
SERVICE
no compromise
Figure 7.12: Compromise according to service
Figure 7.12 also illustrates at the bottom left corner the case of non-vulnerable and protected by credentials services. In this case, compromise can happen either via credential theft or via a vulnerability of the credential itself, such as a vulnerability in the SHA (Secure Hash Algorithm) used to encrypt the credential. Credential theft occurs when the credential required by a service is stolen from elsewhere, and used to impersonate a legitimate user of that service. A typical authentication used by services to verify users identity involves two parties: the client/user (wants to use the service) and the server/service itself. For example, a user located in host h1 who wants to use a SSH (Secure Shell) service to access another host h2 is required to provide a password to do so. If this password is acquired by an attacker by any means (e.g. via social engineering, password guessing, password cracking) she can use it to authenticate to the non-vulnerable host h2 via SSH. In MsAMS, we are able to model the elements necessary to represent authentication, and consequently find attacks involving credential theft. These basic elements are: 1. credentials themselves 2. services protected by credentials: they require a specific credential and accept requests coming from a specific location; e.g. to access the file service of the university, a user needs to be located inside the university network and present a credential (e.g. username and password) 3. mechanism to release credentials: this is a capability of some ambients with either legitimate purpose, such as the case of a kerberos, or illegitimate purpose, such as an exposure. An exposure represents an abstraction of several methods that result in the disclosure of credentials, e.g. disclosing credentials saved locally by authentication agents, stealing, guessing, 154
7.10. FURTHER MODELLING and replacing or inserting methods, social engineering, etc, mentioned in Section 3.2.1 on page 47 4. mechanism to acquire credentials: this is a capability that allows legitimate users or attackers to acquire a credential released from other ambients 5. mechanism to show knowledge of credentials: it is via this capability that non-vulnerable services protected by credential can be reached In MsAMS, a credential is an ambient as well, and there are two actions ReleaseCred and AcquireCred, defined as follows, that provide ambients with the capabilities to release and acquire credentials. Definition 35 (Action AcquireCred.) An ambient x[P x], where P x contains an action AcquireCred is able to acquire non-deterministically a credential when it enters into another ambient that releases credentials, i.e. an ambient with a ReleaseCred action. Definition 36 (Action ReleaseCred.) An ambient x[P x], where P x contains an action ReleaseCred c and ambient c is inside x, is able to release credential c to an ambient with an AcquireCred capability that enters in x. The result of the match between AcquireCred and ReleaseCred is regulated by a reduction rule described in Section A.2.3 on Appendix A. Example 22 Authentication can be represented as follows, where host h1 contains a vulnerable service s1 (remotely exploitable) and an exposure exp which releases credential pw2; and host h2 contains a non-vulnerable service s2 protected by pw2. h1[exp|pw1|v|s1|AllowIn net pw1|AllowIn net v] pw1[Accept net] v[Accept net] s1[Accept pw1|Accept v] exp[Accept s1|ReleaseCred pw2] h2[pw2|s2|AllowIn net pw2] pw2[Accept net] s2[Accept pw2]
Host h1 can be entered either with an Enter pw1 or with an Enter v. In the former case, the attacker trace would be: Enter pw1.Enter s1.Enter exp.AcquireCred and as a result the attacker would gain capability Enter pw2. In the latter case, the attacker trace would be: Enter v.Enter s1.Enter exp.AcquireCred and the result would be the same, i.e. the ambient-attacker acquires the capability to enter pw2. When arriving at host h2, the attacker has to show credential pw2. 155
CHAPTER 7. THE MSAMS SOLUTION: MULTI-STEP ATTACK MODELLING AND SIMULATION If the attacker has it already, i.e. has an Enter pw2 acquired somewhere, e.g. via host h1 as shown, then the trace after h2 becomes: Enter pw1.Enter s1.Enter exp.AcquireCred.Enter pw2.Enter s2 If not, the attacker (mimicking a real-life attacker) will try to find pw2 in the ambients she can reach in the network. An ambient representing a credential is distinguished from any other ambient by means of input. This distinction is really important at simulation time. As described in Section 7.7, the ambient-attacker “gains” enter actions which are possible from its current location. However, the attacker can never “gain” an enter action to a credential ambient because this capability needs to be acquired. Let’s see the dynamics of the example 22 scenario in terms of reduction rules: • Ambient-attacker att arrives at host h2 and cannot enter it because it lacks an Enter pw2, and pw2 is an ambient which represents a credential. Therefore, ambient-attacker has to acquire credential pw2. • To acquire credential pw2 ambient attacker has to initiate a new search for an ambient which releases pw2; more about this new search in Section 7.11. • Ambient-attacker arrives at host h1 and has no capability to Enter pw1 (remember the search engine knows that pw1 represents a credential). However, h1 can also be entered via vulnerability v, and therefore the following reductions are possible: att[Enter v] reduces with att[Enter s1] reduces with att[Enter exp] reduces with att[AcquireCred] reduces with resulting in att[Replicate(Enter
v[Accept net] s[Accept v] exp[Accept s1] exp[ReleaseCred pw2] pw2)]
The trace of search for credential pw2: Enter v.Enter s1.Enter exp.AcquireCred • After the ambient-attacker acquired the capability to enter pw2, the initial search can be resumed. The following reductions are possible at this point: att[Enter pw2] att[Enter s2]
reduces with reduces with
pw2[Accept net] s2[Accept pw2]
Trace of resumed initial search where target is s2: Enter pw2.Enter s2 A modified version of the running example, presented in Section 7.2, is shown in Example 23. Now, host C is used to administer host E, therefore, only the specification of those two hosts are different compared to the original running example. Hosts C and E contain services protected by credentials, i.e. passwords pw C and pw E respectively; pw C can be used to either access service sv C and to access service sv E (e.g. suppose that sv E is a SSH). However, 156
7.10. FURTHER MODELLING while host C remains vulnerable since it contains vulnerability v C, host E is no longer vulnerable. It means that access to sv E is only possible via pw C or via pw E. Although sv C requires password pw C, it also accepts vulnerability v C, meaning that the exploitation of this vulnerability allows access to this service without credentials. As a consequence, it potentially allows access to OS C and to the exposure exp which releases password pw C. As explained above, entering this exposure allows an ambient-attacker to acquire pw C, giving it further possibilities to enter in sv E. Example 23 The modified running example with credentials is specified in ambient terms as: network net net[A|B|C|D|FW] FW[E|F|AllowIn sv_C E|AllowIn sv_D E] A[sv_A|OS_A|v_A|AllowIn net v_A] v_A[Accept net] sv_A[Accept v_A] OS_A[Accept sv_A] B[sv_B|OS_B|v_B|AllowIn net v_B] v_B[Accept net] sv_B[Accept v_B] OS_B[Accept sv_B] C[sv_C|OS_C|v_C|pw_C|exp|AllowIn net pw_C|AllowIn net v_C] pw_C[Accept net] v_C[Accept net] sv_C[Accept pw_C|Accept v_C] OS_C[Accept sv_C] exp[Accept sv_C|ReleaseKey pw_C] D[sv_D|OS_D|v_D|AllowIn net v_D] v_D[Accept net] sv_D[Accept v_D] OS_D[Accept sv_D] E[sv_E|OS_E|pw_E|AllowIn net pw_E|AllowIn net sv_E] pw_E[Accept net] sv_E[Accept pw_E|Accept pw_C] OS_E[Accept sv_E] F[sv_F|OS_F|v_F|AllowIn net v_F] v_F[Accept net] sv_F[Accept v_F] OS_F[Accept sv_F]
The trace of the search for credential pw C is: 157
CHAPTER 7. THE MSAMS SOLUTION: MULTI-STEP ATTACK MODELLING AND SIMULATION Enter v_C.Enter sv_C.Enter exp.AcquireCred
The trace produced by Example 23, considering the target as sv E and the initial location of the ambient-attacker as sv A is: Enter pw_C.Enter sv_E
In the next section this type of search involving credential is further explained.
7.11 Search for Attacks This section describes the types of search available in MsAMS and some aspects involved in the search process such as avoiding cycles, backtracking, and the fitness functions that can be used for the selection of the best candidate ambients to move to. Definition 37 (Concept of Search Run.) A search run defines a search pool; it requires the following input. • The network specification (refer to Section 7.6) • A table with Accept links (refer to Section 7.8) • The scores produced by HITS (refer to Section 7.9.3) • A list of ambients that represent credentials (refer to Section 7.10.2) • Initial capabilities of the ambient-attacker (refer to Section 7.7) • A maximum number of cycles Definition 38 (Concept of Search Pool.) A search pool contains a set of one or more search tasks ti , i.e. pool = {t0 , t1 , ...}. Definition 39 (Concept of Search Task.) A search task ti defines a stack of goals, i.e. ti = {g0 , g1 , ...}; it uses the following input. • A source ambient representing the initial location of the ambient-attacker • A target ambient representing a final location for the ambient-attacker • A search type (Definition 42) • A fitness function (Definition 41) We give next an example of search task and of search pool, before introducing the concept of goals. Example 24 An example search task for the running example is: 158
7.11. SEARCH FOR ATTACKS task(source=sv_A, target=sv_E, type=forward-search, fitness=look-ahead)
Example 25 An example search pool for the running example is: task(source=sv_A, task(source=sv_A, task(source=sv_A, task(source=sv_A,
target=sv_E, target=sv_E, target=sv_E, target=OS_E,
type=forward-search, fitness=hubbiest-node) type=forward-search, fitness=look-ahead) type=backward-search, fitness=look-ahead) type=forward-search, fitness=look-ahead)
Definition 40 (Concept of Search Goal.) A goal g is a tuple p = (V, C, M ), where V is a set of visited ambients V = {v0 , v1 , ..., vn }, C is the set of neighbors C = {c0 , c1 , ...} of vn which defines candidate moves (i.e. vn can successfully reduce with ci and ci is not stamped), and M is a set of ambients stamped by vn (the concept of stamp is explained below). We use a concept of stamp to mark ambients. The last ambient visited in a goal (Definition 40) stamps the unmarked candidates with its own stamp plus 1. Figure 7.13 shows the progress of the search task from Example 24 for the running example with stamped ambients. Example 26 illustrates the stack of paths for this task. 3 1
OS_D
OS_A
1
v_A
1
v_B 0
1
sv_A
v_C
v_B
2
1
1
sv_D
v_C
1
v_D
v_D
1
v_B
1
4
sv_E
1
v_A
1
TARGET
1
v_A 3
1
v_E
v_A
v_B
1
v_C 1
v_C
1
v_D 4
v_F
Figure 7.13: Tree showing a successful search task (according to search task in Example 24) for the running example with stamped ambients
Example 26 Evolution of the stack of goals for the search task from Example 24, 159
CHAPTER 7. THE MSAMS SOLUTION: MULTI-STEP ATTACK MODELLING AND SIMULATION illustrated in Figure 7.13 (considering forward-search, see Definition 42). Goal g0 = (V
= {sv A},
C
= {OS A, v B, v C, v D, v A},
M
= {OS A, v B, v C, v D, v A})
Stack of goals = {g0 } Goal g1 = (V C
=
= {sv D, v A, v B, v C, v D}, = {sv D})
M Stack of goals = Goal g2 = (V
{sv A, v D},
=
{g0 , g1 } {sv A, v D, sv D},
C
= {OS D, v A, v B, v C, v D, v E},
M
= {OS D, v E})
Stack of goals = {g0 , g1 , g2 } Goal g3 = (V
=
{sv A, v D, sv D, v E},
C
= {sv E, v A, v B, v C, v D, v F },
M
= {sv E, v F })
Stack of goals = {g0 , g1 , g2 , g3 } This scheme of stamps avoids cycles since the stamp cannot decrease when a candidate ambient is selected. In combination with a fitness function (see below) the best candidates are selected. Definition 41 (Fitness Functions.) The following fitness functions can be selected for a search task: • hubbiest-node The candidates with best hub scores are selected from the set C. • look-ahead The candidates with best authority scores considering one step ahead in the search (i.e. the next goal) are selected from the set C. where: C is the set of candidates moves from the current visited ambient (refer to Definition 40). When the set of candidates C is empty, the search task performs a backtrack. It involves: unstack goal gn and roll-back the stamps of ambients contained in set M for goal gn . The top goal in stack becomes goal gn−1 . A search run follows the pseudocode algorithm presented in Figure 7.14. Search tasks in a pool are executed in a round-robin scheduling fashion. It means that one move in each task is performed before the next move, in a circular 160
7.11. SEARCH FOR ATTACKS search(pool,maxCycles) REPEAT maxCycles IF pool is empty % all tasks failed in finding attack return fail ELSE task = round-robin selection from pool task’ = taskExpand(task) CASE success task’ % task found attack return task’ CASE fail task’ % task did not find attack remove task from pool CASE wait task’ % a credential is needed to proceed with task let k = credential that task’ is waiting for insert task’ in queue for k CASE task’ found credential k % task found the credential it was looking for move tasks from queue for k give each task the capability ’Replicate(Enter k)’ ELSE % on-going search remove task from pool insert task’ into pool
Figure 7.14: Simplified pseudocode of the search algorithm
way. The task returned when an attack is found (case success task’ in Figure 7.14) has associated with it the stack of goals. The set V of the goal on the top of the stack produces the trace of the ambient-attacker according to Definition 29, when a target is reached. The taskExpand method is instantiated according to the type of search (see Definition 42) of the task it receives. Definition 42 (Types of Search.) A search type can be: • forward-search This search uses the table of Accept links derived from actions Accept, as mentioned in Section 7.8. Therefore, the forward search selects candidate ambients from the set of outlinks of the ambient where the ambient-attacker is currently located, starting from the source ambient (i.e. initial location of ambient-attacker). • backward-search 161
CHAPTER 7. THE MSAMS SOLUTION: MULTI-STEP ATTACK MODELLING AND SIMULATION This search also uses the table of Accept links derived from actions Accept, as mentioned in Section 7.8. However, the backward search selects candidate ambients from the set of inlinks of the ambient where the ambient-attacker is currently located, starting from the selected target. Figure 7.15 illustrates forward and backward searches. • credential-search This search has a credential as target, and it can either be initiated manually or automatically. In the former case a task is created as shown in Example 24. The latter case happens when another task encounters an ambient which requires a credential not available for the ambient-attacker. In fact, this search is a backward search where the target is the ambient that releases the credential. Figures 7.16a to 7.16c illustrate this case (explained below). forward−search
backward−search
OS_D OS_A v_A SOURCE
v_B v_B
sv_A v_C
sv_D v_C
sv_E
v_A v_D
TARGET
v_D v_A
v_B v_E
v_A
v_B
v_C v_C v_D v_F
Figure 7.15: Illustration of forward-search and backward-search Figure 7.16a shows a forward-search with source as ambient A and target as ambient B. However, when the ambient-attacker gets to ambient X it cannot progress further because a credential is needed and it has not such capability (i.e. an enter for this credential). Therefore, another search task is initiated to see if a real attacker could get hold of such credential from the initial location A. This new task0 is a backward-search with source as ambient A and target as the ambient which releases this credential (as part of the processing of links described in Section 7.8, MsAMS tool makes a map of credentials which are released in the network specification), as shown in Figure 7.16b. It is important to keep in mind that the network administrator wants to know if the initial search returns an attack from A to B. Hence, if task0 returns success, the initial search task can be 162
7.11. SEARCH FOR ATTACKS
SOURCE A TARGET B X requires credential
task(source=A, target=B, type=forward−search, fitness=look−ahead)
Figure 7.16a: Ambient-attacker encounters an ambient which requires a credential it does not have TARGET releases credential
SOURCE A
B X
task’(source=A, target=ambient which releases pw, type=backward−search, fitness=look−ahead)
Figure 7.16b: Ambient-attacker looks for credential needed
SOURCE A TARGET B X
task(source=A, target=B, type=forward−search, fitness=look−ahead)
Figure 7.16c: Initial search task resumed 163
CHAPTER 7. THE MSAMS SOLUTION: MULTI-STEP ATTACK MODELLING AND SIMULATION taskExpand(task) goal = top of the stack of goals candidates = set C of nodes not yet visited from goal IF candidates is empty backtrack: remove goal from stack ELSE nextAmbient = selectBestCandidate(candidates) goal’ = create new goal with nextAmbient push goal’ onto stack of goals
Figure 7.17: Simplified pseudocode of the taskExpand method used by the search algorithm (Figure 7.14) selectBestCandidate(candidates) IF target is in candidates return target ELSE CASE fitness function = hubbiest-node return candidate with best hub among candidates CASE fitness funtion = look-ahead compute candidates’ from candidates return candidate with best authority among candidates’
Figure 7.18: Simplified pseudocode of the selectBestCandidate method used by taskExpand (Figure 7.17)
resumed, as illustrated in Figure 7.16c. Each task maintains a stack of goals. In a forward search, e.g., the bottom of the stack contains the source of the attack and the top of the stack contains the current location of the ambient-attacker. The task expand method explores a search tree in a depth-first manner. Its simplified pseudocode is presented in Figure 7.17. The simplified pseudocode of the selectBestCandidate method used by taskExpand (Figure 7.17) is presented in Figure 7.18
7.12 Summary We have seen in this chapter the method used by MsAMS. This section provides a summary parallel between aspects of a real network and how they are modelled using MsAMS. 164
7.12. SUMMARY
7.12.1
Network topology
Reality • several entities play a role in networks, the most important for the area of attack graphs and to represent either vulnerable as well as nonvulnerable hosts are firewalls, subnets (LANs and VLANs), hosts, network services, TCP & UDP ports and protocols, vulnerabilities, vulnerability attributes, attackers, and credentials (listed in R1 on Chapter 4) appear in networks • entities may contain other entities, e.g. a network contains firewalls, hosts and subnets; a host contains services, vulnerabilities and so on • a firewall is a network device, implemented via hardware or software, designed to intercept computer traffic between security domains • a firewall filters traffic from one security domain to another, permitting or denying inbound and outbound access between them
7.12.2
MsAMS • all of these entities can be represented as ambients
• ambients may contain or may not other ambients, recursively; the network Locality Tree represents this nesting • a firewall is also an ambient as well as the environments it interfaces
• a firewall filters the interaction between ambients outside and inside its protection; by default interactions from outside to inside is denied and action AllowIn can be used to explicitly specify what is allowed in, and by default interactions from inside to outside is allowed and action DenyUp is used to explicitly specify what is not allowed out
Fully connected subnets
Reality • a subnet (e.g. LAN, VLAN) is a logical group of hosts; hosts within a subnet are fully connected since there is no filtering between them
MsAMS • a subnet is an ambient containing other ambients representing hosts; connectivity among hosts is not visually represented, connectivity is computed as part of the processing of virtual links 165
CHAPTER 7. THE MSAMS SOLUTION: MULTI-STEP ATTACK MODELLING AND SIMULATION
7.12.3
Reachability
Reality • a host x is potentially reachable from a host y if there are no firewalls between them or if the existing firewalls allow it; however, host x can have another layer of filtering implemented by its personal firewall rule set
7.12.4
Access Control
Reality • access control is performed by means of authentication and authorization; the former checks whether a subject (e.g. legitimate users) is authentic upon the presentation of a credential, i.e. something the user has, knows or is (e.g. password, session key, passphrase), while the latter provides access for an authenticated subject to resources of the network
7.12.5
MsAMS • authentication and authorization are modelled using ambients and actions, therefore, if an ambient-attacker is able to enter an ambient representing a credential c by means of a Enter c (refer to Section 7.10.2) then it can authenticate; the authentication occurs when the ambient-attacker actually enters the credential ambient, giving it access to any ambient which has an Accept c
Attackers and Legitimate Users
Reality • the way legitimate and illegitimate users (i.e. attackers) use a network is not particularly different in a broad sense, e.g. they issue requests, they use resources, they manipulate data; however the resources they use and the purpose they have may certainly differ
166
MsAMS • nesting of ambients and ambients’ actions provide as many levels of filtering as needed, establishing the reachability among ambients
MsAMS • attackers and legitimate users can be represented as ambients the same way. At modelling time, legitimate use of the network may be taken into account, influencing the ranks produced by the Link Analysis Ranking algorithms. However, at simulation time, the search engine, as it is built, only works with attackers because the current choice among alternative steps is tailored to optimize the cost-benefit from an attack, and legitimate users do not share this objective
7.13. RELATED WORK
7.12.6
Attackers’ Target & Asset Values
Reality • as discussed in Section 3.4 on page 61, any asset with high asset value for the organization is a potential target for attackers; asset values are financially-based and manually computed
• a target can be of many types, e.g. information, software, physical, services, human, logical and intangibles (reviewed in Section 2.1 on page 15)
MsAMS • targets are established by authority or importance, and connectivitybased asset values are automatically computed; we provide scores from PageRank and authority scores from HITS which can be used to support the selection of targets and hub scores from HITS to simulate attackers searching for attacks • a target can be of the types represented in MsAMS models, i.e. it can be in principle hosts, firewalls, services, subnets, credentials, vulnerabilities, data and resources encapsulated by OS
7.13 Related Work MsAMS is related to three research domains, namely Mobile Ambients, Combinatorial Optimization and Link Analysis Ranking The second domain applied to attack graphs has been reviewed in Section 2.2.3.4 on page 34. The other two are reviewed next.
7.13.1
Mobile Ambients
Since Cardelli and Gordon first introduced Mobile Ambients (MA) in 1998 [35], defining the ambient calculus, several researchers have proposed extensions and improvements building on it. The MA authors themselves expanded the calculus introducing types [36] associated, e.g., with variables and capabilities to avoid some kinds of faults (e.g. the syntactic anomaly described in [33, page 17]) which may have security implications. Two relevant calculi derived from the ambient calculus are the (typed) Mobile Safe Ambients (SA) proposed by Levi and Sangiorgi [124], and the (typed) Boxed Ambients (BA) proposed by Bugliesi et al. [29]. The authors of SA identified interferences in the ambient calculus that could result in damaged or corrupted processes resulting from reductions20 . Additionally, ambients in MA can exercise capabilities, such as an in to enter other ambients, without their control. To address unrestricted movements they define counterpart capabilities (in, out, and open) establishing that movement only happens upon agreement of both parties involved. On a computer network this is 20 Some
of these interferences are reviewed on Section A.2.1 of Appendix A
167
CHAPTER 7. THE MSAMS SOLUTION: MULTI-STEP ATTACK MODELLING AND SIMULATION actually what happens and ambients can impose permissions that protect themselves, e.g., against arbitrary entries. This is the case of a firewall which filters the access to the hosts it protects, or a personal firewall which filters access to a host. Therefore, like in SA, MsAMS also provides counterpart capabilities. However, in SA, a movement occurs if the source ambient has a capability of the form in < destination ambient >21 , and the destination ambient has a capability of the form in < destination ambient > as well. This approach would be very strange for the network domain because it makes no sense for an ambient, e.g. a service or a host, to protect against itself. In MsAMS, capabilities Enter and Accept do not require a shared ambient, refer to Appendix A for details. An extension of SA which is related to MsAMS, is the Safe Ambients with Passwords (SAP) [138]. Their authors extend SA introducing the concept of password attached to ambients. Therefore, an ambient has not only a name but has also a password associated with it. Movements may occur if an ambient, e.g., capable of entering a second ambient with a password is allowed in by the second given this password, and by means of labelling transitions, their calculus requires the specification of residual processes which remain in the first ambient. MsAMS adopts a simpler, but nevertheless powerful, approach to passwords (called in this thesis credentials) to represent authentication. Passwords are also ambients, therefore, on the one hand, an ambient able to enter a password is viewed as an ambient which knows it. On the other hand, a third ambient protected by a password makes it explicit by accepting the password ambient. The authors of BA had the specific purpose of expressing Mandatory Access Control (MAC) policies. BA drops the open capability from MA to avoid security problems identified in [29]. Therefore, an ambient is viewed as a closed box. It also expands the original ambient calculus with capabilities for synchronous communication between parent and child ambients. Although MsAMS does not use BA capabilities specifically, it also does not provide open capability and its model of communication is also synchronous and only inter-ambients (refer to Appendix A for details about reduction rules used by MsAMS). Other MA-based developments on security include the modified (typed) ambient calculus proposed recently by Compagnoni et al.[43] to deal with Role-Based Access Control. They incorporate aspects from BA and from SA, as done in MsAMS, and introduce the types role and user associated with ambients which allow security checks. MA has mainly been used for the specification of complex systems, or some of their parts, where mobility plays an important role and/or for their verification against some properties, such as security properties. For example, control flow analysis22 with MA has allowed the validation of protocols, such as firewalls [150], and the detection of information leakage [26]. A firewall is viewed as an ambient protected by passwords (k,k’, and k”) that can only be crossed (i.e. be entered) by computing ambients which know these passwords. Hence, Cardelli and Gordon [35] specify a firewall (w) and an agent, explained in details by Niel21 Capability
in is called Enter in MsAMS. analysis checks “for each ambient: (i) which ambients may be immediately contained within it, and (ii) which transitions may it perform” [150]. 22 this
168
7.13. RELATED WORK son et al. [150], where they prove that an agent which knows the passwords, therefore specified as k 0 [open k.k 00 [Q]], can really cross the firewall, specified as w[k[out w.in k 0 .in w]|openk 0 .open k 00 .P ]. This is done via calculus manipulation where the program F irewall|Agent reduces after 7 steps to w[P |Q], meaning that, in the end, the agent process Q ends up inside the firewall w, the intended behavior. Nielson et al. [150] developed a system to check, given the specification of a firewall, if agents who know the necessary passwords can actually enter it, while agents who do not know the necessary passwords cannot. Braghin et al. [26] use the original MA with a labelling scheme to classify ambients into high and low security levels or boundary ambients. They then use a tool [25] to analyze if a high level security data/ambient moves only along boundaries between high level security sites/ambients. Therefore, in these approaches the specification of all the ambients involved, their processes and capabilities, are fully known. MAbased MsAMS is not designed to verify any properties, instead it is designed to simulate the specification of an ambient which represents an attacker reacting (via reduction rules) with a specified network. The specification of the attacker is the resulting trace, as we have seen in Section 7.7, and represents steps the attacker may follow to reach targets. MsAMS uses simulation to infer possible capabilities of an attacker moving along a modelled network, according to capabilities and reductions described in Appendix A. Regev et al. [176] also use simulation with their modified MAbased calculus, called BioAmbients, to specify complex biomolecular systems. However, they fully specify a system to verify, via simulations (where in each iteration a reduction occurs), if the system operational behavior, as described in their BioAmbients model, matches with its expected behavior, as described in the literature. For example, they want to study molecular functioning (i.e. neurons, nuclei, hormones and interactions among them) involved with weight control [176, Section 5]. Therefore, in principle, they are modelling a complex molecular functioning which is hard to fully understand and abstract; they are representing a to-build model. However, when we want to model a network we want to represent it as implemented in reality. Hence, if a firewall deployed contains inconsistencies, these have to be present in the model as well; we want to represent a as-built model of the network, and hopefully gain knowledge with it, as discussed in Section 7.3.
7.13.2
Link Analysis Ranking
Link Analysis Ranking algorithms are used by World Wide Web search engines to sort search results, i.e. to rank webpages. Probably the best known of these algorithms is the PageRank algorithm [27], used by Google. However, there are many others, such as the HITS (Hypertext Induced Topic Search) algorithm developed in IBM by Kleinberg [116]. For the best of our knowledge, the HITS algorithm has not yet been applied to the domain of attack graphs or network security. Nevertheless, as mentioned in Section 2.2.3.3 on page 31, Google’s algorithm has recently been used on this domain [135, 180] as a way to prioritize 169
CHAPTER 7. THE MSAMS SOLUTION: MULTI-STEP ATTACK MODELLING AND SIMULATION sub-graphs and overcome problems of size and complexity which make human analysis and visualization of attack graphs difficult. The final objective of these approaches is to emphasize areas of the graph where the security practitioners should concentrate their attention on. Mehta et al. [135] use the PageRank algorithm for prioritizing attack states (equivalent to attack steps) of an Attack Graph, generated by a Model Checker. For each node a rank is calculated, denoting the probability of an attacker reaching it. They use the algorithm to rank states of the graph, and a high rank in states which violate a security policy (i.e. goal states) means the network is insecure. Therefore, their PageRank scores are more a measure of likelihood of an attacker to be in a determined state in respect to the network initial state, while PageRank scores in MsAMS relates more to potential impact, from the perspective of defenders, based on the connectivity of the network. In our case, the higher the number of virtual incoming links to a node (and the authorities of these incoming nodes), the higher its authority and, consequently, its potential to be a target. Sawilla and Ou [180] use the PageRank algorithm with the purpose of assigning AssetRank to a dependency Attack Graph. Their ranks are based on the importance an asset represents for a potential attacker in respect to a specific attacker goal. In MsAMS, PageRank scores reflect the importance an asset represents for defenders. Therefore, a high rank node in MsAMS identifies a potential target because if compromised it will affect potentially all nodes which depend on it or other nodes with also high ranks since authority flows from one node to another. A high AssetRank identifies configurations and vulnerabilities that enable an attacker to reach a goal. The authors modified the original PageRank and, instead of considering that all outlinks from a node i have equal probabil1 of being selected, they use two additional metrics when calculating ity |outlinks i| their scores: (i) a given intrinsic value for assigning inherent value to nodes e.g. a goal node is initialized with a higher value compared to the remaining nodes, and (ii) a calculated arc weight. They use those weight to represent attackers preference for shortest paths to reach a goal, what is somehow equivalent to using HITS hub scores to represent attackers preference for lower-cost paths to reach a target. However, the advantage of our approach is the fact scores are calculated automatically, i.e. there is no need to input weights or intrinsic values. PageRank has also been applied to a broader context within network security. For example, it has been used as part of the process to generate customized blacklists by Zhang et al. [235]. They adapt PageRank to calculate how relevant is an attacker, i.e. a specific source IP address, for a victim organization, i.e. a specific IP destination address. The relevance takes into account whether the source has or not attacked the victim in the past, obtained from historical data. Their adjacency matrix models the correlation between victims based on the number of shared sources among them. Such as it happens with the propagation of authority in the original PageRank algorithm, their relevance propagates from one victim to another as a measure of how likely it is for a victim to be attacked 170
7.13. RELATED WORK by a new source already identified by other victims. In MsAMS, we adapt the adjacency matrix to model the structure of links among network nodes, i.e. reachability among ambients. Otherwise, we keep PageRank calculation, as described in Section 7.9.2. Furthermore, in the broader sense of network security, PageRank has also been used to rank, e.g., vulnerabilities to patch [143], and IDS alarms [212]. MiuraKo and Bambos [143] propose SecureRank, a modified version of PageRank, for assigning scores to vulnerabilities. Instead of representing the relative importance of a node in respect to the other nodes based on the link structure of a graph, as it happens in the latter, SecureRank represents the relative amount of time an attacker would spend on a vulnerable node relative to the remaining nodes of a network. According to the authors, “the more time it [an attacker] spends at a node, the more vulnerable the latter [the node] is to being compromised”. Their calculation assumes that the severity of vulnerabilities are given; this is not really a problem since it is possible to retrieve such information from the NVD [161]. However, as discussed in item 7 on Section 3.1, the increasing use of automation in attacks and the advent of the Internet, have put factors like attackers skills and time, or resources an attacker needs to execute an attack under a different perspective. As a consequence, it is not necessarily true that the more time an attacker spends on a vulnerable host, the more vulnerable the host is because it depends on the skills and resources available for the attacker, and it also depends on the complexity of exploitation of a vulnerability rather than on its severity.
171
Part III
Solution Validation
173
Methodology The third part of this thesis is about internal validity of the MsAMS solution. Internal validity aims at establishing to which extent a solution solves the problem that is intended to solve [225]. We justify the validity of our solution in two chapters. First, in Chapter 8, we validate the MsAMS approach itself. Therefore we want to see if MsAMS fulfils its purpose of finding multi-step attack in a way that one can relate results obtained at the level of model back to the real network it represents, and the other way round. Most importantly we want to see whether the model allows reasoning via hypotheses about phenomena found in reality. We demonstrate the usefulness of the MsAMS approach via examples. Second, in Chapter 9, we validate the feasibility of the MsAMS approach. We do that by testing the scalability of the proof-of-concept tool that implements the approach. Therefore, we use a benchmark of experiments and statistical analysis that indicate the feasibility of the MsAMS approach.
175
8
Testing the MsAMS Approach
In Chapter 7 we presented the MsAMS (Multi-step Attack Modelling and Simulation) approach, using examples and definitions. We introduced its syntax as a variant of ambient calculus that facilitates the modelling of multi-step attacks and allows the representation of important aspects in this domain, such as the hierarchical topology of networks and attack dynamics. We also discussed that the notions of inlinks, outlinks and importance apply to ambient models representing networks, the same way as they apply to webpages. Furthermore, we presented how the scores produced by Link Analysis Ranking algorithms, namely PageRank and HITS, could be used to support the search for attacks using a network model. As mentioned before, the MsAMS approach has been implemented in a proof-of-concept tool. In this chapter, we validate the MsAMS approach using this tool. Therefore, we use example scenarios to show some interesting aspects and the potential of the MsAMS approach. First, in Section 8.1, we approach scalability of modelling with the MsAMS approach in terms of reuse of ambients specification. Then, in Section 8.2, we use a computing grid network example inpired in a real setting. We use this example to show the applicability of deny actions in a network model that correspond to actions we encounter in firewall rule sets in practice. Finally, in Section 8.3, we use a power grid network example from the literature to show the use of MsAMS tool and discuss scores returned by PageRank and HITS. We start from a model of the network with many vulnerable hosts and no representation of credentials, as modelled by Attack Graph approaches. From this baseline version we remodel a more realistic version with only a few vulnerable hosts and non-vulnerable hosts protected by credentials. We show how a network administrator can gain insights and check hypotheses about the real network via several rounds of reasoning with the modelled network, i.e. testing hypotheses, checking attacks returned by the MsAMS tool and mitigating those attacks by means of countermeasures introduced in the model. The complete specification of the computing grid network example, and all version of the power grid network example discussed in this chapter can be found in chapter appendix 8.A. In addition, the tables with PageRank and HITS scores of some of the versions, can be found in chapter appendix 8.B. 177
CHAPTER 8. TESTING THE MSAMS APPROACH
8.1 Reuse of Ambients Specification We have mentioned in Section 7.7 on page 134 that the implementation of MsAMS uses a DNS-like naming convention for ambients. We have pointed out then that this naming scheme has two advantages: (i) it indicates firewalls, which facilitates relating the output path with the actual network path, and (ii) it allows reuse of ambients specification. The latter advantage is the focus of this section. We revisit the complete specification of the running example presented in Example 10, reproduced below in Example 27. Example 27 The complete specification of the original running example in ambient terms: network net net[A|B|C|D|FW] FW[E|F|AllowIn sv_C E|AllowIn sv_D E] A[sv_A|v_A|OS_A|AllowIn net v_A] v_A[Replicate(Accept net)] sv_A[Replicate(Accept v_A)] OS_A[Replicate(Accept sv_A)] B[sv_B|v_B|OS_B|AllowIn net v_B] v_B[Replicate(Accept net)] sv_B[Replicate(Accept v_B)] OS_B[Replicate(Accept sv_B)] C[sv_C|v_C|OS_C|AllowIn net v_C] v_C[Replicate(Accept net)] sv_C[Replicate(Accept v_C)] OS_C[Replicate(Accept sv_C)] D[sv_D|v_D|OS_D|AllowIn net v_D] v_D[Replicate(Accept net)] sv_D[Replicate(Accept v_D)] OS_D[Replicate(Accept sv_D)] E[sv_E|v_E|OS_E|AllowIn net v_E] v_E[Replicate(Accept net)] sv_E[Replicate(Accept v_E)] OS_E[Replicate(Accept sv_E)] F[sv_F|v_F|OS_F|AllowIn net v_F] v_F[Replicate(Accept net)] sv_F[Replicate(Accept v_F)] OS_F[Replicate(Accept sv_F)]
We now take advantage that all hosts are configured alike and reuse the specification of ambients v, s and OS for all of them. Example 28 shows this collapsed 178
8.1. REUSE OF AMBIENTS SPECIFICATION version. Example 28 A collapsed version of the specification of the original running example in ambients terms: network net net[A|B|C|D|FW] FW[E|F|AllowIn C E|AllowIn D E] v[Accept net] s[Accept v] OS[Accept s] A[s|OS|v|AllowIn B[s|OS|v|AllowIn C[s|OS|v|AllowIn D[s|OS|v|AllowIn E[s|OS|v|AllowIn F[s|OS|v|AllowIn
net net net net net net
v] v] v] v] v] v]
Internally, in the MsAMS tool, this collapsed specification is translated automatically, via computation, to an expanded DNS-like naming scheme mentioned before (page 138), using a dollar sign to indicate transition to a lower level in the containment hierarchy of ambients. Next, we exemplify this expanded notation just for the specification of host F . Example 29 The specification of host F from Example 28 processed by MsAMS tool to an expanded naming scheme used internally: $net$FW$F[$net$FW$F$s|$net$FW$F$OS|$net$FW$F$v|AllowIn $net $net$FW$F$v] $net$FW$F$v[Replicate(Accept $net)] $net$FW$F$s[Replicate(Accept $net$FW$F$v)] $net$FW$F$OS[Replicate(Accept $net$FW$F$s)]
For the original running example it was feasible to collapse the specification by naming hosts A − F explicitly, as shown in Example 29. It means that what has been reused was the specification of v, s, and OS. However, depending on the size of the network and context, reuse of entire host specifications would be preferred. Let’s consider what happens in practice and what we mean by context. On one extreme, there are businesses where control over the network is not so strict, such as universities. In this context, the vast majority of users have administrative rights, and can install any software they want or need in what we call extended workstations. Hosts (i.e. desktops and laptops) in such networks tend to be heterogeneous since the installation of security patches for corporatesupported software made available at login time can usually be postponed and user installed software depends on user initiative to be patched. On another extreme, there are businesses where control over the network is very strict, such as financial institutions. In this context, only a small percentage of users have 179
CHAPTER 8. TESTING THE MSAMS APPROACH administrative rights to install software, and hosts are homogeneous, i.e. they contain only corporate-supported software that is patched automatically at login time, which cannot be postponed. We call them standard workstations and reuse is specially convenient for their modelling. Two typical examples from industry are: (i) 50 out of 11000 users (0.45%) have administrative rights, i.e. 99.55% of users use standard workstations1 (ii) 3600 out of 58000 users (6.21%) have administrative rights, i.e. 93.79% of users use standard2 workstations The MsAMS tool provides a copy command to allow a scalable reuse of ambients specification for modelling ambients that are alike, such as the standard hosts mentioned. The syntax of this command is shown in Example 30. Example 30 The specification of the original running example in the collapsed form shown in Example 28 is re-specified in ambient terms with 10 copies of host B as follows. network net net[A|copy B B_ 10|C|D|FW] FW[E|F|AllowIn C E|AllowIn D E] v[Accept net] s[Accept v] OS[Accept s] A[s|OS|v|AllowIn B[s|OS|v|AllowIn C[s|OS|v|AllowIn D[s|OS|v|AllowIn E[s|OS|v|AllowIn F[s|OS|v|AllowIn
net net net net net net
v] v] v] v] v] v]
The copy command generates 10 copies of host B named B 0 till B 9, as illustrated in Figure 8.1. We use reuse of specification, especially via copy, in the examples presented in the remainder of this chapter.
8.2 Computing Grid Network Example This example network, illustrated in Figure 8.2, shows a computing grid network inspired by the setup of a site part of the WLCG project. The Worldwide LHC Computing Grid (WLCG) is a project “to build and maintain a data storage 1 Obtained 2 Obtained
180
from a company in the chemical sector. from a company in the financial sector.
8.2. COMPUTING GRID NETWORK EXAMPLE net FW
... A
B_0
B_9
C
D
E
F
Figure 8.1: Modified running example with 10 copies of host B and analysis infrastructure for the entire high energy physics community that will use the LHC [Large Hadron Collider] at CERN [in Geneva]” from http: //lcg.web.cern.ch/LCG/public/3 . As shown in Figure 8.2, the computing grid structure is actually the one protected by firewall FW3. It is embedded in the network of several institutions, e.g., across the UK (http://www.gridpp.ac.uk/). Subnets sub3 and sub4 contain workstations and servers of the institution. Subnet sub1 contains a cluster of processing nodes, representing the computing power of the grid at this particular site, while subnet sub2 contains the grid storage nodes. Host C is the computing element of the grid, meaning that jobs submitted by physicists from around the World are routed to be computed in sub1 via this host. In this example, we assume jobs are only submitted through Web interface when submitted from the Internet; in reality they can also be submitted using scripts via command line. Submission can request jobs to be processed in parallel using MPI (Message Passing Interface) service [145]. This service enables the execution of parallel jobs on the top of a set of physically distributed processors. Thus, in this case, the execution of a job can take advantage of the processing capacity of hosts A and B together. Firewalls FW1-FW34 filter access from the internet to the network as follows: FW1: allows internet to access the Web Server (WS) and the Mail Server (MS) FW2: allows DMZ access to sub3 and WS access to host C (for job submission) FW3: allows WS access to host C, it also allows access from sub3 and sub4 to C (also for job submission) The WS and host C contain a remotely exploitable vulnerability. The remaining hosts and servers are not vulnerable (in this example we abstract from credentials). Usually the grid environment embedded into the institution network is administered by different administrators. One usual concern of the institution network administrator is to avoid that the grid becomes a way to attack the institution network, specially because of its computing power. For example, subnet 3 More information about the grid architecture can be found e.g. at https://twiki.cern. ch/twiki/bin/view/LCG/DpmAdminGuide\#DPM_Architecture. 4 They are also routers.
181
CHAPTER 8. TESTING THE MSAMS APPROACH
Web Server (WS)
DMZ H
I FW1 sub4
Workstations and servers
F
Mail Server (MS)
G
sub3
FW2 FW3
sub1
A
B
Processing nodes
sub2
C Computing element
D
E
Storage nodes
Figure 8.2: Computing grid network example motivated from practice
sub4 can only be reached from the Internet via sub3 (since, as we said earlier, FW2 only allows traffic from DMZ to sub3 or from WS to host C), and, in this case, sub3 contains no vulnerable hosts, therefore, sub4 at first glance seems protected, from the institution network administrator’s point-of-view. However, sub4 is also indirectly accessible from the grid and the institution administrator is not sure how the grid can affect the security of sub4. Hence, the administrator wants to check the following what-if scenario: what attack is possible, if there is a zero-day vulnerability in server H, and H is the target? In the following section, we model this example network and execute the MsAMS tool to find possible attacks.
8.2.1
Specification of the Computing Grid Network Example
The network illustrated in Figure 8.2 is viewed in terms of ambients as shown in Figures 8.3 and 8.4. These figures, in fact, represent a more user-friendly version 182
8.2. COMPUTING GRID NETWORK EXAMPLE of the Locality Tree corresponding to this example that represents the nesting of ambients in a tree format, as described in Chapter 7. internet FW1 DMZ
attHost
WS
MS
FW2
Figure 8.3: The partitioned network shown in Figure 8.2 as Ambients: internet FW2 FW3 sub2
sub1
A
B
C
D
E
sub3
F
G
sub4
H
I
Figure 8.4: The partitioned network shown in Figure 8.2 as Ambients: firewall FW2 Figure 8.3 shows an additional host in the Internet, not present in the diagram of the example network in Figure 8.2. This host (attHost) represents the attacker host, starting point for the search for attacks. This figure shows that there are two ambients inside the ambient internet: attHost and the outer firewall of the network F W 1. Firewall F W 1 protects ambients DM Z and the inner firewall F W 2. Let’s consider the specification of those ambients in parts. Example 31 The specification of ambients internet and F W 1 follows. network internet internet[attHost|FW1] FW1[DMZ|FW2|AllowIn internet DMZ]
The ambient DM Z contains the Web Server W S, and the Mail Server M S. The Web service web s provided by the W S is vulnerable represented by the fact that it can accept the remotely exploitable vulnerability v W S. A compromise of this vulnerability potentially causes complete impact on data and programs encapsulated by this host Operating System OS W S, represented by action Accept web s. Example 32 The specification of ambients DMZ and WS follows. 183
CHAPTER 8. TESTING THE MSAMS APPROACH DMZ[MS|WS|AllowIn internet WS|AllowIn internet MS] --- web server WS[v_WS|web_s|OS_WS|AllowIn internet v_WS] v_WS[Replicate(Accept internet)] web_s[Replicate(Accept v_WS)] OS_WS[Replcate(Accept web_s)]
The Mail service mail s is not vulnerable, therefore, it answers requests from ambients inside the Internet and the mail server Operating System OS M S answers requested originated from the mail service. Example 33 The specification of the ambient MS follows. --- mail server MS[s_MS|OS_MS|AllowIn internet mail_s] mail_s[Replicate(In internet)] OS_MS[In mail_s]
As illustrated in Figure 8.4, firewall F W 2 protects firewall F W 3 and subnets sub3 and sub4. In fact, F W 2 protects the computing grid network, i.e. subnets sub1, sub2 and the computing node, host C. Furthermore, those firewalls filter traffic to the institution network and the computing grid network, as already described. Example 34 The specification of ambients F W 2 and F W 3 follows. FW2[FW3|sub3|sub4|AllowIn web_s C|AllowIn DMZ sub3] FW3[sub1|C|sub2|AllowIn web_s C|AllowIn sub3 C|AllowIn sub4 C]
In this example we model three types of hosts, i.e. hosts like host C that are vulnerable, hosts like host D that are not vulnerable, and hosts like host A that are not vulnerable but allow the execution of jobs. Host C contains a remotely-exploitable vulnerability v that allows an ambientattacker to enter its service sv and even reach resources encapsulated by its OS. The specification of host C represents a typical vulnerable host in this example, thus, we reuse the specification of host C to specify server H, hypothetically considered to contain a zero-day vulnerability later on. Example 35 The specification of ambient C, a vulnerable host, follows. The same ambients are later reused to specify server H. --- host C (vulnerable host) C[sv|v|OS|AllowIn internet v] v[Replicate(Accept internet)] sv[Replicate(Accept v)] OS[Replicate(Accept sv)]
184
8.2. COMPUTING GRID NETWORK EXAMPLE Host D is not vulnerable, its service only answers requests coming from ambients within ambient internet. We have chosen, in this example, to name this service rsv which stands for “restricted service”5 for the specification of all nonvulnerable hosts. The same way, the Operating System of this host, called rOS that stands for “restricted OS”, only answers requests from the service rsv. The specification of host D represents a typical vulnerable host in this example, therefore, we reuse later its ambients to specify hosts E, F , G, I and the attacker host attHost. Example 36 The specification of host D, a non-vulnerable host, follows. The same ambients are later reused to specify hosts E, F, G, I, and attHost. --- host D (non-vulnerable host) D[rsv|rOS|AllowIn internet rsv] rsv[Replicate(In internet)] rOS[Replicate(In rsv)]
Host A contains a MPI service mpi s that accepts jobs from host C to be processed by prOS (processing OS). Since jobs actually enter those hosts to be executed, although not vulnerable, the MPI service does not only answer requests from C, it accepts ambients from C (to be executed). Host B is similar to A, therefore, we reuse the specification of host A to specify host B. Example 37 The specification of host A, a computing grid processing node, follows. The same ambients are later reused to specify host B. --- host A (processing node) A[mpi_s|prOS|AllowIn C mpi_s] mpi_s[Replicate(Accept C)] prOS[Replicate(In mpi_s)]
Now, we can specify the subnets and the attacker host reusing ambients discussed, via the copy command introduced in Section 8.1. For example, subnet sub1 contains hosts A and B; host B is specified in terms of A with the term copy A B 1 that is interpreted as “make 1 copy of ambient A and call it ambient B”6 . Example 38 The specification of subnets sub1 to sub4 and of the attacker host follows. sub1[A|copy A B 1|AllowIn internet sub2[D|copy D E 1|AllowIn internet sub3[copy D F 1|copy D G 1|AllowIn sub4[copy C H 1|copy D I 1|AllowIn --- attacker host attHost[rsv|AllowIn internet rsv]
sub1] sub2] internet sub3] internet sub4]
5 Note that we could as well have used this service for the specification of the mail service presented before. 6 In reality instead of B is B0, but we refer simply to B in this example; the same happens for the other copies.
185
CHAPTER 8. TESTING THE MSAMS APPROACH The complete specification of this example can be found in the chapter appendix 8.A. Having modelled the example network using the MsAMS formalism, we can now execute the MsAMS tool with the following input. As a result we obtain the traces shown in Example 39. • source ambient: attHost$rsv • target ambient: H$sv • search type: forward-search • fitness function: hubbiest-node
Example 39 The following traces are produced by the MsAMS tool for the network example (these traces are illustrated in Figure 8.5): >>> trace 1: Enter $INTERNET$FW1$DMZ$WS$V_WS. Enter $INTERNET$FW1$DMZ$WS$WEB_S. Enter $INTERNET$FW1$FW2$FW3$C$V. Enter $INTERNET$FW1$FW2$FW3$C$SV. Enter $INTERNET$FW1$FW2$SUB4$H$V. Enter $INTERNET$FW1$FW2$SUB4$H$SV >>> trace 2: Enter $INTERNET$FW1$DMZ$WS$V_WS. Enter $INTERNET$FW1$DMZ$WS$WEB_S. Enter $INTERNET$FW1$FW2$FW3$C$V. Enter $INTERNET$FW1$FW2$FW3$SUB1$A$MPI_S. Enter $INTERNET$FW1$FW2$SUB4$H$V. Enter $INTERNET$FW1$FW2$SUB4$H$SV >>> trace 3: Enter $INTERNET$FW1$DMZ$WS$V_WS. Enter $INTERNET$FW1$DMZ$WS$WEB_S. Enter $INTERNET$FW1$FW2$FW3$C$V. Enter $INTERNET$FW1$FW2$FW3$C$SV. Enter $INTERNET$FW1$FW2$FW3$SUB1$B$MPI_S. Enter $INTERNET$FW1$FW2$SUB4$H$V. Enter $INTERNET$FW1$FW2$SUB4$H$SV
Those attacks are possible because host C can communicate not only with sub1 and sub2 but also with sub3 and sub4 because no restrictions apply to communications initiated in C. Therefore, as feared by the institution network administrator, the computing grid can actually represent a stepping stone for an attacker to reach most protected subnets like ambient sub4. As shown by trace 1, server H can be reached by the ambient-attacker directly from the grid computing element, host C. However, this host is typically not a powerful computer since its primarily purpose is to schedule jobs received, thus, balancing the workload of jobs among the processing nodes (i.e. hosts A and B), and to report processing 186
8.2. COMPUTING GRID NETWORK EXAMPLE
Web Server (WS)
DMZ H
I FW1 sub4
Workstations and servers
F
Mail Server (MS)
G
sub3
FW2 FW3
sub1
A
B
sub2
C
D
Computing element
Processing nodes
E
Storage nodes
Web Server (WS)
DMZ H
I FW1 sub4
Workstations and servers
F
Mail Server (MS)
G
sub3
FW2 FW3
sub1
A
B
sub2
C
D
Computing element
Processing nodes
E
Storage nodes
Web Server (WS)
DMZ H
I FW1 sub4
Workstations and servers
F
Mail Server (MS)
G
sub3
FW2 FW3
sub1
A
B
Processing nodes
sub2
C Computing element
D
E
Storage nodes
Figure 8.5: Visual representation of traces 1, 2, and 3 (Example 39) 187
CHAPTER 8. TESTING THE MSAMS APPROACH results. Much more dangerous attacks are the ones shown by traces 2 and 3 since they reach H using the computing power of the cluster of processing nodes. Therefore, their severity and consequent potential impact are considerably higher compared to trace 1.
8.2.2
Blocking Firewall Outbound Traffic
As we have seen, traces 2 and 3 (i.e. W S → C → A or B) are the most worrying attacks from the Internet to server H in sub4. One action the network administrator from the institution could demand from the grid administrator is to block communication from sub1 to the institution network, i.e. to sub3 and sub4. This can be achieved by changing the rules of firewall F W 3 to deny outbound flow from sub1. In real settings this involves the addition of a deny rule to the firewall rule set, similar to what happens in MsAMS, where we add an action DenyUp sub1 in ambient F W 3. Example 40 The specification of ambient F W 3 with a deny rule follows. FW3[sub1|C|sub2|AllowIn web_s C|AllowIn sub3 C|AllowIn sub4 C|DenyUp sub1]
Refer to the chapter appendix 8.A for the complete specification of this new version of the example network. If we execute MsAMS search for attacks again (with the same input), we obtain the following trace, i.e. traces 2 and 3 are no longer possible. Example 41 The following trace is produced by MsAMS tool with the modified F W 3; using the same input used to produce traces in Example 39. Enter Enter Enter Enter Enter Enter
$INTERNET$FW1$DMZ$WS$V_WS. $INTERNET$FW1$DMZ$WS$WEB_S. $INTERNET$FW1$FW2$FW3$C$V. $INTERNET$FW1$FW2$FW3$C$SV. $INTERNET$FW1$FW2$SUB4$H$V. $INTERNET$FW1$FW2$SUB4$H$SV
Therefore, the model allowed the institution network to check consequences in terms of possible multi-step attacks of an action in the model (the use of action DenyUp in a firewall ambient) that corresponds to an action in a real network (a deny rule in a deployed firewall). This type of reasoning is not possible with current attack graph approaches, reviewed in Chapter 2. In the next section, we use a power grid network example to perform similar reasoning but, this time, involving credentials and authentication.
8.3 Power Grid Network Example Throughout this section we use a power grid network example introduced by other researchers [181, 98] of attack graphs. We illustrate the power of what-if 188
8.3. POWER GRID NETWORK EXAMPLE reasoning at the level of access control on a standard example (the power grid example) and show how attack dynamics can create multi-step attacks missed by current attack graph approaches. The example shows an enterprise network that has a typical topology, i.e. a DMZ (demilitarized zone) that interfaces with the Internet and an internal network with subnets, as illustrated in Figure 8.7. One of such subnets, the EMS (Energy Management System) subnet, is a control-system network responsible for controlling and monitoring a physical power transmission and generation infrastructure. Communication Servers (CS)
fEMS
Operating Station (OP)
Data Historian (DH)
`
fEXT User Workstations (UW)
Web Server (WS)
`
DMZ
VPN Server (VS)
`
CORPint
File Server (FS)
Citrix Server
Figure 8.6: Power grid network (CORPnet) example from [181, 98] The network CORPnet has two firewalls: fEXT that filters traffic from the DMZ to the internal network, i.e. CORPint, and fEMS that filters traffic from CORPint to the EMS network. The web server (WS) and the VPN server (VS), located in the DMZ, are directly accessible from the Internet. The VPN service allows employees access to CORPint from outside the enterprise network. The Web service retrieves webpages from the file system (FSYS) via RPC (Remote Procedure Calls) requests to the NFS7 service running on the file server. All user workstations within CORPnet can access the file system (FSYS). Access to the EMS network is only possible from the Citrix server8 to the Data Historian (DH) server. This DH server is, in fact, a database that stores power-grid-data 7 The Network File System is a service that provides network accessible file systems for client machines [173]. 8 Citrix is an American corporation that provides products and services with special focus
189
CHAPTER 8. TESTING THE MSAMS APPROACH and provides statistics. The Operating Station (OP) collects such data from the Communication Servers (CS) that actually receive them in real-time from the physical infrastructure. Table 8.1 summarizes the network access allowed. from Internet
to DMZ
DMZ
CORPint
CORPint
EMS
network access allowed all to Web Server (WS) all to VPN Server (VS) Web Server to File Server (FS) VPN Server to all Citrix server to Data Historian (DH)
Table 8.1: Summary of network access allowed As seen in Chapter 7, we model this scenario in two stages. First, we capture the topology of those networks in terms of Ambients as illustrated in Figure 8.7. This is an user-friendly representation of the Locality Tree shown in Figure 8.8. internet CORPnet DMZ WS
VS fEXT
CORPint
FS
UW_0
fEMS
DH
CS_0 CS_1
CITRIX
UW_1
OP
CS_2
WS: Web Server VS: Vpn Server FS: File Server CITRIX: CITRIX server UW_n: User Workstations DH: Data Historian server OP: OPerating station CS_n: Communication Servers
Figure 8.7: Power grid network example as Ambients Figure 8.7 shows that ambient internet contains CORP net, itself containing ambients DM Z and f EXT , representing the most external firewall. The DMZ contains ambients representing the web server W S and the VPN server V S, while firewall f EXT contains (i.e. protects) ambients CORP int and f EM S. This inner firewall f EM S 9 protects the EMS network, i.e. the data historian DH server, the operating station OP , and communication servers represented on virtualization and central management of distributed IT infrastructure (www.citrix.com); in this case the Citrix server is an application server that provides remote access to other applications. 9 The firewalls in this example are also routers.
190
8.3. POWER GRID NETWORK EXAMPLE internet
CORPnet DMZ
WS
fEXT
FS
fEMS
CORPint
VS
CITRIX
UW_0
UW_1
DH
OP
CS_0
CS_1
CS_2
Figure 8.8: Locality tree corresponding to Figure 8.7
by ambients CS 0, CS 1, and CS 2. Subnet CORP net contains the file server F S, the citrix server, and user workstations represented by ambients U W 0 and U W 1. The authors of the example mention that there are plenty of vulnerabilities in the network [98], e.g., the web and the VPN servers are vulnerable, as well as other hosts and servers in CORP int and in the power grid network. In fact, power grids are often controlled and monitored by legacy systems that incorporate little security [115] and are hard to patch. Therefore, numerous attack paths among those vulnerable hosts are found with attack graphs. We model this example and consider this original version as our baseline for modelling a more realistic version with the majority of hosts non-vulnerable, protected by credentials, and then for reasoning about attacks (returned by MsAMS tool) and countermeasures, reflected in new versions of the network specification, in Sections 8.3.2-8.3.5. The complete specification of all the versions, including the baseline version, can be found at the end of this chapter, in Section 8.A.
8.3.1
Baseline Specification of the Power Grid Network Example
In this section we specify the original example in parts but, first, we introduce an extra entity not present in the original example: the host of an employee at home. The modified setting is illustrated, as Ambients, in Figure 8.10, and its corresponding complete Locality Tree is shown in Figure 8.9. Note that we abstract from details of services and protocols, like RPC, and of technologies, like different implementations of VPN, the same way as the attack graph community does. Along this section, however, we introduce some details, e.g., related to authentication methods. As we have seen in Figure 8.7, there are two ambients within ambient internet, the enterprise network CORP net and the rest of the World connected to the Internet, represented by ambient world. 191
nfs
fsys
fs
192 v_fs
s_ws
browser_uw
os_ws
ws
os_uw
uw_0
v_ws
uw_1
corpint
os_vs
browser_uw
s_vs
vs
dmz
os_uw
s_op
v_vs
s_citrix
os_op
op
v_citrix
v_cs
s_cs
s_dh
world
os_citrix
v_op
citrix
fext
corpnet
internet
os_cs
cs_0
os_dh
dh
fems
s_cs
v_dh
v_ehome
ehome
v_cs
cs_1
os_cs
s_cs
cs_2
v_cs
os_cs
CHAPTER 8. TESTING THE MSAMS APPROACH
Figure 8.9: Complete locality tree corresponding to the ambients diagram in Figure 8.10
8.3. POWER GRID NETWORK EXAMPLE internet CORPnet DMZ WS
VS fEXT
CORPint
world
fEMS ehome
FS
UW_0
DH
CS_0 CS_1
CITRIX
UW_1
OP
CS_2
Figure 8.10: Added ambient world within internet, containing an ehome (employee at home) host to the Ambients representation of the example shown in Figure 8.7 Example 42 Ambients internet, world and CORP net are specified as follows. network internet internet[CORPnet|world] CORPnet[DMZ|fEXT|AllowIn internet CORPnet]
Ambient world contains a host ehome that itself contains a vulnerability v ehome, accessible from the Internet. Example 43 The specification of ambient world follows. --- ehome (employee at home) host world[ehome|AllowIn internet world] ehome[v_ehome|AllowIn internet v_ehome] v_ehome[Replicate(Accept internet)]
The web server W S provides web service s W S, but a remotely accessible vulnerability v W S in this service may potentially result in complete impact on data and programs encapsulated by the host Operating System OS W S, represented by the fact that it is possible to enter in this ambient. The VPN server V S has a similar ambient specification since it also contains a vulnerable VPN service. Example 44 The specification of ambient DM Z follows. DMZ[WS|VS|AllowIn internet DMZ] --- web server WS[s_WS|OS_WS|v_WS|AllowIn internet v_WS] v_WS[Replicate(Accept internet)] s_WS[Replicate(Accept v_WS)] OS_WS[Replicate(Accept s_WS)] --- VPN server
193
CHAPTER 8. TESTING THE MSAMS APPROACH VS[s_VS|OS_VS|v_VS|AllowIn internet v_VS] v_VS[Replicate(Accept internet)] s_VS[Replicate(Accept v_VS)] OS_VS[Replicate(Accept s_VS)]
The external firewall f EXT allows access from the web service s W S to the file server F S and from the VPN service s V S to all CORPint hosts, in accordance with Table 8.1. To specify the internal subnet CORP int we use the copy command, described in Section 8.1, to generate two copies of the ambient U W (user workstation), namely U W 0 and U W 1. All sub-ambients of CORP int, i.e. F S, citrix and both U W are vulnerable. Their specification is similar to the specification of the web and VPN servers, although constrained by the filtering of f EXT . It means that, although they contain a vulnerability that can be exploitable from the Internet, the firewall f EXT only allows traffic coming via VPN service, or Web service. Each user workstation contains a browser service that can make requests to other web servers in the Internet, via an Out action; this is always possible since there is no outbound filtering applied in CORPnet. Using the VPN service provided by the VPN server, an employee located physically outside CORP net can access the resources of CORP int. Example 45 The specification of ambients f EXT and CORP int follows. fEXT[CORPint|fEMS|AllowIn s_WS FS|AllowIn s_VS CORPint] CORPint[FS|copy UW UW_ 2|citrix|AllowIn internet CORPint] --- file server FS[NFS|FSYS|v_FS|AllowIn internet v_FS] v_FS[Replicate(Accept internet)] NFS[Replicate(Accept v_FS)] FSYS[Replicate(Accept NFS)] --- citrix server citrix[s_citrix|OS_citrix|v_citrix|AllowIn internet v_citrix] v_citrix[Replicate(Accept internet)] s_citrix[Replicate(Accept v_citrix)] OS_citrix[Replicate(Accept s_citrix)] --- user workstation UW[browser_UW|OS_UW|AllowIn s_VS OS_UW] v_UW[Replicate(Accept internet)] browser_UW[Out internet] OS_UW[Replicate(Accept s_VS)|Replicate(In browser_UW)]
The f EM S firewall allows only access from the citrix service s citrix to the data historian DH. While the DH host has a remotely accessible vulnerability v DH on service s DH that allows full access to, i.e. potential complete impact on the data and programs encapsulated by the OS, the OP and the CS hosts have a locally accessible vulnerability that allows the same access to the OS as the one in DH but do not represent an open door to those hosts, i.e. they require that local access, e.g., via service is acquired first. The OP answers requests from the CS n, and vice-versa, represented by the In action in both end points. 194
8.3. POWER GRID NETWORK EXAMPLE Example 46 The specification of the ambients part of the EMS network follows. fEMS[OP|DH|copy CS CS_ 3|AllowIn s_citrix DH] --- data historian server DH[s_DH|OS_DH|v_DH|AllowIn s_citrix s_DH|AllowIn internet v_DH] v_DH[Replicate(Accept internet)] s_DH[Replicate(Accept v_DH)|Replicate(In s_citrix)] OS_DH[Replicate(Accept s_DH)] --- operating station OP[s_OP|OS_OP|v_OP|AllowIn s_DH s_OP] s_OP[Replicate(Accept s_DH)] v_OP[Replicate(Accept s_OP)] OS_OP[Replicate(Accept v_OP)|Replicate(In CS_0$s_CS)| Replicate(In CS_1$s_CS)| Replicate(In CS_2$s_CS)] --- communication server CS[s_CS|v_CS|OS_CS|AllowIn s_OP s_CS] s_CS[Replicate(Accept s_OP)] v_CS[Replicate(Accept s_CS)] OS_CS[Replicate(Accept v_CS)|Replicate(In s_OP)]
Having modelled the example, we use MsAMS tool to obtain PageRank and HITS scores, and to find possible attacks in the example network. The scores returned by PageRank and HITS for the example modelled above are shown in Tables 8.2 and 8.3, respectively. Those tables can be found in Section 8.B, at the end of the chapter. According to PageRank, the top three most authoritative ambients are: 1. the web server vulnerability v W S and the VPN server vulnerability v V S with the same score: 0.18751004 2. the ehome vulnerability v ehome: 0.16886869 Therefore, instead of indicating potential targets, PageRank indicates the top priority vulnerabilities that affect the security of the modelled network. This order of priority matches our intuition of vulnerabilities to patch, since those hosts represent entry points to CORPnet from the Internet. We reason why we obtained such results next. Firewalls f EXT and f EM S do not restrict outbound traffic from CORPnet to the Internet, i.e. they do not block interactions from ambients inside f EXT to ambient DM Z and to internet. It means that there is a link from all ambients inside f EXT to the ambients inside DM Z and inside world that either have actions In internet or Accept internet. This is the case of ambients v home, v W S and v V S which represent vulnerabilities inside DM Z and world. Therefore, those vulnerabilities have the most inlinks of all ambients inside internet and their number of inlinks is the same. Let’s now have a look at outlinks of those ambients (refer to Equation 7.1). 195
CHAPTER 8. TESTING THE MSAMS APPROACH Let’s assume that the PageRank score for ambients v ehome, v W S and v V S equal x because all of them have potentially the same number of inlinks. At iteration k=1, we have: • πk (v ehome) = x • πk (v W S) = x • πk (v V S) = x At the next iteration, on the one hand, ambient v ehome propagates its importance x to 2 outlinks: v W S and v V S (other outlinks are not possible because f EXT does not allow interactions from internet directly to ambients inside f EXT ), therefore, v W S and v V S receive a share of importance equal to x2 each from v ehome. On the other hand, ambient v W S propagates its importance x to 3 oulinks: s W S, v ehome, v V S (other outlinks are not possible because f EXT only allows interactions from s W S and s V S to ambients inside f EXT ), therefore, s W S, v ehome, v V S receive a share of importance equal to x3 each from v W S. The same happens for v V S. In summary, this means that v ehome gains less importance than v W S and v V S gain, at each interaction. As a consequence, the resulting PageRank score π(v W S) and π(v V S) are higher than the score π(v ehome). The highest three authority scores returned by HITS are: 1. the operating station service s OP : 0.03718147 2. the data historian service s DH: 0.03666337 3. the citrix service s citrix, the services in the communication servers s CS 0, s CS 1, s CS 2, the vulnerabilities v CS 0, v CS 1, v CS 2, and the vulnerability in the operating station v OP with the same authority score: 0.036409695 Unlike PageRank, HITS authorities show ambients closer to our intuition of target with higher scores. The final target we have in mind is any communication server, since it is the most valuable for the corporation and for attackers, therefore, the most protected. HITS produced high authority scores for ambients within or closer to this intuitive target, all in the EMS network or representing the entry point to EMS (i.e. s citrix). Since the difference between those scores is very small, any of those are potential targets. We set the target as OS CS 1 for the remainder of this example. Note that for HITS scores a reasoning, like we did for PageRank, about why we obtained the results we did is far more complex because of the mutual relationship between authority and hub scores. This means that hub scores propagate to authority scores and vice-versa. Therefore, such analysis would demand a huge amount of experiments dedicated to this purpose to find patterns that would explain why we obtained such results. In terms of hubs, the four highest scores are: 1. the ehome vulnerability v ehome: 0.16294982 196
8.3. POWER GRID NETWORK EXAMPLE 2. the VPN vulnerability v V S and in the WS v W S: 0.16293405 3. the FS vulnerability v F S: 0.14735377 4. the citrix vulnerability v citrix: 0.14292207 The top ambients in terms of hub scores returned by HITS are quite similar to the ambients with highest pagerank scores. Both indicate vulnerabilities in the DMZ or world at the top of the list. However, all PageRank top ambients are related to entry points to CORP net, while top hub scores do not relate necessarily with network entry points but with ambients inside CORP int that represent low cost passageways to reach several other ambients like the F S and citrix. Having analyzed the scores returned by PageRank and HITS, we now use MsAMS tool to find attacks and reason about a possible countermeasure. Therefore, we run the MsAMS search for attacks with the following input: • source ambient: v ehome • target ambient: OS CS 1 • search type: forward-search • fitness function: hubbiest-node
The best cost-benefit attack path reported by MsAMS is presented next. Example 47 A trace produced by MsAMS tool for the network specified in Section 8.3.1 with the input listed above (this trace is illustrated in Figure 8.11): Enter Enter Enter Enter Enter Enter Enter Enter
$INTERNET$CORPNET$DMZ$VS$V_VS. $INTERNET$CORPNET$DMZ$VS$S_VS. $INTERNET$CORPNET$FEXT$CORPINT$CITRIX$V_CITRIX. $INTERNET$CORPNET$FEXT$CORPINT$CITRIX$S_CITRIX. $INTERNET$CORPNET$FEXT$FEMS$DH$V_DH. $INTERNET$CORPNET$FEXT$FEMS$DH$S_DH. $INTERNET$CORPNET$FEXT$FEMS$OP$S_OP. $INTERNET$CORPNET$FEXT$FEMS$CS_1$S_CS
Although the authors of the example do not show in their papers [181, 98] the attack graph corresponding to the example graphically, they report [98] that the attack graph produced for the example has 150 nodes and 173 arcs, and a trimmed version has 99 nodes and 106 arcs. After this trimming, they find the attack above returned by the MsAMS tool, and others most costly attacks reaching the citrix server. However, the example as modelled by attack graph approaches has two main problems. First, most probably, a network administrator will not leave the network so vulnerable, specially entry points like the Web server and the VPN server. Let’s assume that the administrator follows the priority of vulnerabilities to patch returned by PageRank, i.e. patch v W S and v V S, since the vulnerability on the employee’s host at home v ehome is out of her control. Second, only a few attack graph approaches [228, 163, 38] incorporate the concept 197
CHAPTER 8. TESTING THE MSAMS APPROACH Communication Servers (CS)
fEMS
Operating Station (OP)
Data Historian (DH)
`
` ehome
World
fEXT User Workstations (UW)
Web Server (WS)
`
DMZ
`
CORPint
VPN Server (VS)
File Server (FS)
Citrix Server
Figure 8.11: Visual representation of the trace (in Example 47) produced by MsAMS of credentials for access control (as seen in Chapter 2), and even though are unable to represent credential theft and to perform what-if analysis related to credentials, as discussed in Section 4.1 (page 67). All in all, attack graphs cannot be used for reasoning about more subtle attacks that involve not only vulnerable hosts, or trust relationship between two hosts, but also non-vulnerable services, and consequently hosts, protected by credentials. Therefore, next we model a more realistic version of this example with credentials.
8.3.2
Version One: Adding Credentials
In this new version of the example specification, our network administrator applied some patches and the web service is no longer vulnerable, i.e. it contains no vulnerabilities. It means that it reacts to service requests in a controlled way, and it is no longer possible to cause any impact on data and programs encapsulated by the Operating System running on the web server. Thus, the web service now answers requests from the Internet and its Operating System answers requests from the web service. Example 48 The Web Server is specified in ambients terms as follows. --- web server WS[s_WS|OS_WS|Allow internet s_WS] s_WS[Replicate(In internet)] OS_WS[Replicate(In s_WS)]
198
8.3. POWER GRID NETWORK EXAMPLE The VPN server is also not vulnerable anymore and its service now requires a valid user credential (e.g. a password) represented by ambient valid cred that in this model contains: cred 0 and cred 110 . Example 49 The VPN server is specified in ambients terms as follows. --- VPN server VS[s_VS|OS_VS|AllowIn internet s_VS] s_VS[Replicate(Accept valid_cred)] OS_VS[Replicate(In s_VS)] --- users valid credentials valid_cred[copy cred cred_ 2|AllowIn internet valid_cred] cred[Replicate(Accept internet)]
Once successfully authenticated via the VPN service, a user externally located can access CORP int, e.g. the file system F SY S, the citrix server without the need to authenticate again. Therefore, the citrix service now only accepts authenticated connections from VPN or from users logged-in on workstations U W inside CORPint. Ambients U W n model extended workstations. It means that users authenticated via VPN or via login have privileged access to the resources and data encapsulated by their workstations OS. This is reflected in the model since ambients U W 0$OS U W and U W 1$OS U W accept s V S and login U W . Example 50 The specification of subnet CORP int follows. fEXT[CORPint|fEMS|AllowIn s_WS FS|AllowIn s_VS CORPint] CORPint[FS|copy UW UW_ 2|citrix|AllowIn internet CORPint] --- file server FS[NFS|FSYS|AllowIn s_WS NFS|AllowIn s_VS NFS|AllowIn login_UW NFS] NFS[Replicate(In s_WS)|Replicate(Accept s_VS)|Replicate(Accept login_UW)] FSYS[Replicate(Accept NFS)|Replicate(In NFS)] --- citrix server citrix[s_citrix|OS_citrix|AllowIn s_VS s_citrix|AllowIn login_UW s_citrix] s_citrix[Replicate(Accept s_VS)|Replicate(Accept login_UW)] OS_citrix[Replicate(In s_citrix)] --- user workstation UW[browser_UW|login_UW|OS_UW|AllowIn s_VS OS_UW|AllowIn CORPint login_UW] browser_UW[Replicate(Out internet)] login_UW[Replicate(Accept valid_cred)] OS_UW[Replicate(Accept s_VS)|Replicate(Accept login_UW)| Replicate(In browser_UW)]
Hosts within the EMS network remain vulnerable since, as mentioned before, they are legacy systems, difficult to patch and, therefore, highly vulnerable. However, the only entry point to the power grid is secured since access to citrix is now restrict to authenticated users. 10 Note that, although we provide a more realistic modelling of VPN server, compared to attack graphs, since we make explicit that authentication is required to use a VPN connection, we abstract from VPN technologies, and protocols used (e.g. IPsec, SSL) by different VPN implementations. It is not our goal here to model further details of VPN architecture.
199
CHAPTER 8. TESTING THE MSAMS APPROACH Example 51 The power grid network is specified as follows. fEMS[OP|DH|copy CS CS_ 3|AllowIn s_citrix DH] --- data historian DH[s_DH|OS_DH|v_DH|AllowIn s_citrix s_DH|AllowIn internet v_DH] v_DH[Replicate(Accept internet)] s_DH[Replicate(Accept v_DH)|Replicate(In s_citrix)] OS_DH[Replicate(Accept s_DH)] --- operation station OP[s_OP|OS_OP|v_OP|AllowIn s_DH s_OP] s_OP[Replicate(Accept s_DH)] v_OP[Replicate(Accept s_OP)] OS_OP[Replicate(Accept v_OP)|Replicate(In CS_0$s_CS)| Replicate(In CS_1$s_CS)| Replicate(In CS_2$s_CS)] --- communication servers CS[s_CS|v_CS|OS_CS|AllowIn s_OP s_CS] s_CS[Replicate(Accept s_OP)] v_CS[Replicate(Accept s_CS)] OS_CS[Replicate(Accept v_CS)|Replicate(In s_OP)]
If we execute MsAMS tool to find attacks with the network modelled above, using the same input as before (reproduced below), the search returns no attack because a valid credential cannot be acquired in the network. • source ambient: v ehome • target ambient: OS CS 1 • search type: forward-search • fitness function: hubbiest-node • credential ambients: valid cred$cred 0 and valid cred$cred 1
We then make the following update on ambient ehome and execute the search again, i.e. re-run MsAMS tool. Example 52 The specification of the re-modelled ehome follows. ehome[v_ehome|exp_ehome|AllowIn internet v_ehome] v_ehome[Replicate(Accept internet)] exp_ehome[Replicate(Accept v_ehome)|ReleaseCred valid_cred$cred_0]
The employee at home host contains not only a vulnerability but also an exposure that allows ambient-attacker to acquire the valid credential cred 0. Example 53 A trace produced by the MsAMS tool for the example with the ambient ehome modified is (this trace is illustrated in Figure 8.12): --- trace of search task for acquisition of credential Enter $INTERNET$WORLD$EHOME$EXP_EHOME. AcquireCred
200
8.3. POWER GRID NETWORK EXAMPLE --- trace of search task for target Enter $INTERNET$CORPNET$VALID_CRED$CRED_0. Enter $INTERNET$CORPNET$DMZ$VS$S_VS. Enter $INTERNET$CORPNET$FEXT$CORPINT$CITRIX$S_CITRIX. Enter $INTERNET$CORPNET$FEXT$FEMS$DH$V_DH. Enter $INTERNET$CORPNET$FEXT$FEMS$DH$S_DH. Enter $INTERNET$CORPNET$FEXT$FEMS$OP$S_OP. Enter $INTERNET$CORPNET$FEXT$FEMS$CS_1$S_CS. Enter $INTERNET$CORPNET$FEXT$FEMS$CS_1$V_CS. Enter $INTERNET$CORPNET$FEXT$FEMS$CS_1$OS_CS Communication Servers (CS)
fEMS
fEXT
Operating Station (OP)
Data Historian (DH)
`
` ehome
World User Workstations (UW)
Web Server (WS)
`
DMZ
VPN Server (VS)
`
CORPint
File Server (FS)
Citrix Server
Figure 8.12: Visual representation of the trace (in Example 53) produced by MsAMS Therefore, a compromised host used by an employee to access the internal network via VPN may reach the power grid communication servers. What the network administrator can do in this case is to block VPN access to citrix and permit only access for authenticated connections from user workstations U W within CORPint. We make this change in the next version of the specification of CORPnet, in Section 8.3.3, and execute the MsAMS search for attacks again to check that this countermeasure solves the problem identified. The scores returned by PageRank and HITS for the example modelled above are shown in Tables 8.4 and 8.5, respectively. They can be found in Section 8.B, at the end of the chapter. According to PageRank, the top four most authoritative ambients are: 1. the credentials cred 0, cred 1, and the ehome vulnerability v ehome: 0.18106595 201
CHAPTER 8. TESTING THE MSAMS APPROACH 2. the VPN service s V S: 0.1068714 The PageRank scores for this version of the example show credentials and the vulnerability in ehome as the most important ambients. It makes complete sense since those allow penetrating the network towards the target. Therefore, again PageRank do not provide direct indication of target but provides interesting insight about what to protect or to patch. The highest three authority scores returned by HITS are: 1. the operating station service s OP : 0.036112405 2. the data historian service s DH: 0.035374995 3. the operating station vulnerability v OP , the services in the communication servers s CS 0 and s CS 1, and the vulnerabilities v CS 0 and v CS 1 with the same authority score: 0.3501747 Again, the authority scores returned by HITS show ambients closer to our intuition of target, such as the services in the operating station, the data historian, and the communication servers in the power grid. The ambients with the highest hubs returned by HITS are: 1. the ehome vulnerability v ehome: 0.2313004 2. the credential cred 0 and cred 1: 0.2312522 3. the DH vulnerability v DH: 0.12381217 Hubs again return an ordering close to the one returned by PageRank. But instead of only entry points, such as it happens with PageRank, it shows passageways like the vulnerability in the data historian that allows reaching high authority ambients like the data historian service s DH, itself leading to the top high authority ambient, the service in the operating station.
8.3.3
Version Two: Hypothesizing about a Vulnerable Workstation
To avoid the type of attack discussed in the previous section, we restrict access to citrix only for users authenticated via user workstation login. Therefore, in this new version of the specification, we make the following change in the modelling presented in Section 8.3.2. Example 54 Updated specification of Citrix: --- citrix server citrix[s_citrix|OS_citrix|AllowIn login_UW s_citrix] s_citrix[Replicate(Accept login_UW)] OS_citrix[Replicate(In s_citrix)]
202
8.3. POWER GRID NETWORK EXAMPLE If we run the MsAMS search again with this change in the specification11 , no attacks are found (same input as the previous run). This level of protection would be enough for an ideal environment where 100% of workstations were standard (as mentioned in Section 8.1). However, in practice, at least a small percentage of workstations are extended and user installed software follows outside corporate patch management. For example, such users could use a browser of their preference, not necessarily the one supported by the organization. As a result, such workstations are likely to contain vulnerabilities, since the burden of keeping them up-to-date is up to users. Therefore, we hypothesize that user workstation U W 1 contains a browser vulnerability and, since outbound is not restricted, it is reasonable to think that an user will make a request to a malicious website via Out (action) and, because of the vulnerability in the browser, the answer to this request will infect the host, allowing an attacker to bypass the login of an U W without presenting any valid credential. Therefore, in this case we execute the MsAMS search again with the following input. • source ambient: U W group$login U W • target ambient: OS CS 1 • search type: forward-search • fitness function: hubbiest-node • credential ambients: valid cred$cred 0 and valid cred$cred 1
As a result, the search returns the following attack. Example 55 The following attack trace, illustrated in Figure 8.13, is produced by the MsAMS tool. Enter Enter Enter Enter Enter Enter Enter
$INTERNET$CORPNET$FEXT$CORPINT$CITRIX$S_CITRIX. $INTERNET$CORPNET$FEXT$FEMS$DH$V_DH. $INTERNET$CORPNET$FEXT$FEMS$DH$S_DH. $INTERNET$CORPNET$FEXT$FEMS$OP$S_OP. $INTERNET$CORPNET$FEXT$FEMS$CS_1$S_CS. $INTERNET$CORPNET$FEXT$FEMS$CS_1$V_CS. $INTERNET$CORPNET$FEXT$FEMS$CS_1$OS_CS
This trace shows that even with citrix accepting connections from users logged via UW and not from users logged via VPN, a compromised extended workstation allows an attacker to reach the power grid communication servers. A next level of protection that the network administrator could consider is to introduce another level of authentication in the data historian server. We model this change next. 11 The complete specification of the example network can be found in the chapter appendix 8.A.
203
CHAPTER 8. TESTING THE MSAMS APPROACH Ticket Granting Server (TGS)
Communication Servers (CS)
Authentication Server (AS)
Kerberos
fEMS
Operating Station (OP)
Data Historian (DH)
`
fEXT ` ehome
World
fEXT User Workstations (UW)
Web Server (WS)
`
DMZ
`
CORPint
VPN Server (VS)
File Server (FS)
Citrix Server
Figure 8.13: Visual representation of the trace (in Example 55) produced by MsAMS
8.3.4
Version Three: Adding Kerberos Authentication to the Data Historian Server
First, in the next section, we review the Kerberos protocol and present how it is modelled, before we execute again the search for attacks with MsAMS tool. 8.3.4.1
Kerberos Authentication
Kerberos is an authentication service hosted in a trusted third-party and used to verify users’ identity in non-secure distributed environments, such as across the Internet. The Kerberos protocol was developed by MIT in the context of the Athena project [200] in the late 80s. Since then, kerberos-based authentication has been incorporated in several operating systems and platforms such as to the Active Directory technology by Microsoft, widely used in enterprise networks for reduced sign-on for active-directory-aware services. Kerberos protocol is based on symmetric encryption. Both (network) services that require authentication and users/clients that want to use such services have to register with Kerberos, and have to share a long-term (private) key with Kerberos. A simplified version of this authentication protocol is illustrated in Figure 8.14. The steps depicted in this figure are: 1- the user requests permission for kerberos to use a service (in a server) , providing username and password 204
8.3. POWER GRID NETWORK EXAMPLE kerberos infrastruture client
1− pw 2− TGT AS
3− TGT’ 4− key 5− key
TGS server
service
AS = Authentication Server/Service TGS = Ticket−Granting Server/Service TGT = Ticket−Granting Ticket pw = user password key = encrypted key with a timestamp
Figure 8.14: Kerberos authentication simplified to 5 steps, adapted from [200, 187] 2- kerberos Authentication Server (AS) checks the password and generates an encrypted key in the client private key containing: a session key, a timestamp, information about the client and the Ticket-Granting Server (TGS) name in the form of a Ticket-Granting Ticket (TGT) sent back to the client 3- the client decrypts the TGT and uses the session key to create an authenticator, and then repacks authenticator and original TGT in the form of a TGT0 and sends it to the TGS 4- the TGS creates an encrypted key in the service private key with the TGT0 and further information about the service requested; this key is sent to the client 5- the client sends the key received from the TGS to the service server that decrypts it, and checks its validity; communication between client and server starts Without loss of generality, we assume TGT and TGT0 are the same for the effect of modelling and use the simplified scheme from Figure 8.14 to model the Kerberos authentication in the next version of our CORPnet. 8.3.4.2
Modelling the Interface with Kerberos
The example corporate network CORP net now interfaces with a Kerberos infrastructure available on the Internet. The update example scenario is illustrated in Figure 8.15. In this next version of the specification, access to the data historian service s DH requires a keyDH obtained via Kerberos authentication. 205
CHAPTER 8. TESTING THE MSAMS APPROACH Ticket Granting Server (TGS)
Communication Servers (CS)
Authentication Server (AS)
Kerberos
fEMS
Operating Station (OP)
Data Historian (DH)
`
fEXT ` ehome
World
fEXT User Workstations (UW)
Web Server (WS)
`
DMZ
VPN Server (VS)
`
CORPint
File Server (FS)
Citrix Server
Figure 8.15: Kerberos infrastructure added to the original example scenario shown in Figure 8.6 Example 56 The updated specification of the data historian follows. --- data historian DH[s_DH|OS_DH|v_DH|AllowIn s_citrix s_DH|AllowIn internet v_DH] v_DH[Accept internet] s_DH[Accept v_DH|Accept keyDH] OS_DH[Accept s_DH]
Service kerb interf ace in citrix provides this interface to Kerberos. It means that now the citrix server provides two services: one s citrix that allows access to the server (e.g. it is a SSH service), and one kerb interf ace that allows authentication via Kerberos infrastructure. In this version we distinguish extended and standard workstations group. The service s citrix accepts any of them, i.e. UWgroup as a whole, as long as users are logged meaning that they have provided a valid cred. Therefore, in principle, all logged users can use service kerb interf ace. We used copy to model 10 standard workstations, 2 extended workstations and 2 credentials of the type cred kerb for extended workstation users. Populating the model to reflect real networks is a matter of increasing those number of copies. Example 57 The specification of the re-modelled citrix, of user workstations and users groups follows. 206
8.3. POWER GRID NETWORK EXAMPLE --- citrix citrix[s_citrix|OS_citrix|kerb_interface|AllowIn UWgroup$login_UW s_citrix] s_citrix[Accept UWgroup$login_UW] kerb_interface[Accept s_citrix] OS_citrix[In s_citrix] --- user workstations group UWgroup[UWSgroup|UWEgroup|login_UW|AllowIn s_VS UWgroup| AllowIn CORPint login_UW] login_UW[Accept valid_cred] --- standard workstations group UWSgroup[copy UWS UWS_ 10|Allow s_VS UWSgroup] --- extended workstations group UWEgroup[copy UWE UWE_ 2|cred_kerb|AllowIn s_VS UWEgroup] cred_kerb[copy credKB credKB_ 2|AllowIn CORPint cred_kerb] credKB[Accept internet] --- standard workstation UWS[browser_UWS|OS_UWS|AllowIn s_VS OS_UWS|AllowIn CORPint login_UW] browser_UWS[Out internet] OS_UWS[In s_VS|In UWgroup$login_UW|In browser_UWS]. --- extended workstation UWE[browser_UWE|OS_UWE|AllowIn s_VS OS_UWE|AllowIn CORPint login_UW] browser_UWE[Out internet] OS_UWE[Accept s_VS|Accept login_UW|In browser_UWE]
Although it seemed by the specification of service kerb interf ace in citrix that any logged user could authenticate to kerberos, we see next that only users from group U W Egroup (users from extended workstations) can do so, provided a credential of type cred kerb, e.g. credKB 0 or credKB 1. In the specification of the kerberos infrastructure the five steps described in Section 8.3.4.1 become visible: (step 1) a user authenticates to the Authentication Server AS using the interface kerb interf ace from citrix, providing a cred kerb credential, (step 2) AS releases a T GT credential used to authenticate to the Ticket-Granting Server T GS, (step 3) T GS accepts a TGT credential and (step 4) releases a credential keyDH to the user using interface kerb interf ace from citrix. The user can then (step 5) access the data historian server DH with this key, as shown in the reviewed specification of the data historian in Example 56. Example 58 The specification of the kerberos infrastructure follows. --- kerberos infrastructure kerberos[AS|TGS|AllowIn kerb_interface AS] AS[TGT|Accept UWEgroup$cred_kerb|ReleaseCred TGT] TGT[Accept internet] TGS[keyDH|Accept TGT|ReleaseKey keyDH] keyDH[Accept internet]
Considering as a what-if hypothesis that an attacker has exploited a browser vulnerability on an extended workstation, we assume in this version, as we did 207
CHAPTER 8. TESTING THE MSAMS APPROACH in the previous version, that the attacker has already bypassed the login process. We run the MsAMS tool again with the following input: • source ambient: U W group$login U W • target ambient: OS CS 1 • search type: forward-search • fitness function: hubbiest-node • credential ambients: valid cred$cred 0, valid cred$cred 1, uwgroup$uwegroup$cred kerb$credkb 0, uwgroup$uwegroup$cred kerb$credkb 1, keyDH, TGT
Example 59 Attack trace produced by MsAMS (illustrated in Figure 8.13): Enter Enter Enter Enter Enter Enter Enter
$INTERNET$CORPNET$FEXT$CORPINT$CITRIX$S_CITRIX. $INTERNET$CORPNET$FEXT$FEMS$DH$V_DH. $INTERNET$CORPNET$FEXT$FEMS$DH$S_DH. $INTERNET$CORPNET$FEXT$FEMS$OP$S_OP. $INTERNET$CORPNET$FEXT$FEMS$CS_1$S_CS. $INTERNET$CORPNET$FEXT$FEMS$CS_1$V_CS. $INTERNET$CORPNET$FEXT$FEMS$CS_1$OS_CS
This trace shows that, even with Kerberos authentication to obtain a key for access to the data historian, access to the communication servers is still possible. The reason is the remotely exploitable vulnerability v DH in the service s DH. However, as mentioned before, hosts in the EMS network contain legacy systems, difficult to patch. Therefore, the network administrator should find a solution that involves securing the entry point to this network regardless of the vulnerabilities it contains. One option is to use Kerberos authentication, not for authentication to the data historian server directly, but as another layer of protection before that, i.e. in citrix. This is reflected in the next version of the specification of CORP net.
8.3.5
Version Four: Adding Kerberos Authentication to the Citrix Server
In this version, citrix provides three services: s citrix, and two interface services, i.e. kerb interf ace and dh interf ace. As in the previous version, service s citrix is the entry point and accepts connections from users logged in CORPint workstations. Furthermore, service kerb interf ace provides an interface to Kerberos that allows users from group U W Egroup (users from extended workstations) to obtain a valid keyDH, provided a cred kerb is presented to kerberos authentication server AS. However, the DH server no longer accepts connections coming directly from service kerb interf ace, but now accepts connections originated from service dh interf ace, also provided by citrix. The service dh interf ace, introduced in the present version, is an interface with the data historian, and can only be used if keyDH is presented. 208
8.4. SUMMARY Example 60 The updated specification of citrix and DH follows (refer to the chapter appendix 8.A for the complete specification of this version). --- citrix citrix[s_citrix|OS_citrix|kerb_interface|dh_interface| AllowIn UWgroup$login_UW s_citrix] s_citrix[Accept UWgroup$login_UW] kerb_interface[Accept s_citrix] dh_interface[Accept kerberos$tgs$keyDH] OS_citrix[In s_citrix] --- data historian DH[s_DH|OS_DH|v_DH|AllowIn dh_interface s_DH|AllowIn internet v_DH] v_DH[Accept internet] s_DH[Accept v_DH|Accept dh_interface] OS_DH[Accept s_DH]
If we run the same search as the one used for the previous version (i.e. with the same input), the MsAMS tool returns no attacks. Hence, even though the EMS network is still vulnerable, it is safer now than it was before. Using MsAMS, our hypothetical network administrator was able to reason at the level of access control, something not possible with attack graphs. In fact, in this power grid example we started in Section 8.3.1 from a baseline modelling where hosts and servers were not protected by credentials and contained vulnerabilities. This modelling reflects the typical attack graph perspective of the example scenario. From this initial version we modelled a more realistic perspective with credentials in Section 8.3.2, and used the MsAMS tool to find possible attacks and validate solutions that avoids them, in Sections 8.3.3 to 8.3.5. This reasoning shows the applicability of the tool for a network administrator for gaining insights about the real network through the network model and, as a consequence, improve the level of protection of the real power grid network.
8.4 Summary In this chapter, we have used the MsAMS proof-of-concept tool to show the potential of the MsAMS approach (i) for modelling networks in a way that relates model to the real network, (ii) for finding possible multi-step attacks in the modelled network, and (iii) for providing metrics not only used internally to guide the search (i.e. HITS hubs) but also for the network administrator to make decisions. For example, PageRank scores have provided indication of most valuable entities to protect (such as credentials that allow access to the network) or high priority vulnerabilities to patch at entry points of the network. And HITS authorities have provided indication of asset value in the sense that they indicate potential targets. We have modelled a computing grid network example and used what-if analysis involving a zero-day vulnerability. However, the most interesting aspect of this example, is the ability provided by the MsAMS approach to reason about 209
CHAPTER 8. TESTING THE MSAMS APPROACH firewall outbound rules. In this case, the network administrator could check in the model if blocking requests initiated within a subnet would avoid two of the most potentially damaging traces reported. The possibility to allow this kind of reasoning and the isomorphy between actions in the model and actions in a real network are an advantage of MsAMS over current attack graph approaches. As discussed in Section 4.1 (page 67), in those approaches firewall are not explicitly represented and only inbound reachability is considered. Therefore, with MsAMS we are able not only to represent explicitly firewalls in network models, but also to represent both types of actions they perform: allow inbound and deny outbound traffic in the network. We have also modelled a power grid network example initially in the same way as the Attack Graph community does, that represents essentially only vulnerable hosts. We have then introduced a more realistic model of the network, where hosts protected by credentials also represent attack steps. Incrementally, we mimicked a network administrator reasoning about the security of the real network in terms of possible attacks found in the network model. This reasoning involved whatif hypothesis, and Kerberos authentication introduced on different hosts of the network. In addition, we have discussed scores produced by PageRank and HITS for two versions of the example.
210
8.A. CHAPTER APPENDIX: COMPLETE SPECIFICATIONS
8.A Chapter Appendix: Complete Specifications Example 61 Specification of the computing grid network example as in Section 8.2.1; traces of attacks found presented in Example 39. network internet internet[attHost|FW1] attHost[rsv|AllowIn internet rsv] FW1[DMZ|FW2|AllowIn internet DMZ] DMZ[MS|WS|AllowIn internet WS|AllowIn internet MS] WS[v_WS|web_s|OS_WS|AllowIn internet v_WS] v_WS[Replicate(Accept internet)] web_s[Replicate(Accept v_WS)] OS_WS[Replcate(Accept web_s)] MS[s_MS|OS_MS|AllowIn internet mail_s] mail_s[Replicate(In internet)] OS_MS[In mail_s] FW2[FW3|sub3|sub4|AllowIn web_s C|AllowIn DMZ sub3] FW3[sub1|C|sub2|AllowIn web_s C|AllowIn sub3 C|AllowIn sub4 C] sub1[A|copy A B 1|AllowIn internet sub1] sub2[D|copy D E 1|AllowIn internet sub2] sub3[copy D F 1|copy D G 1|AllowIn internet sub3] sub4[copy C H 1|copy D I 1|AllowIn internet sub4] --- host C (vulnerable host) C[sv|v|OS|AllowIn internet v] v[Replicate(Accept internet)] sv[Replicate(Accept v)] OS[Replicate(Accept sv)] --- host D (non-vulnerable host) D[rsv|rOS|AllowIn internet rsv] rsv[Replicate(In internet)] rOS[Replicate(In rsv)] --- host A (processing node) A[mpi_s|prOS|AllowIn C mpi_s] mpi_s[Replicate(Accept C)] prOS[Replicate(In mpi_s)]
Example 62 Specification of the computing grid network example as in Section 8.2.2; traces of attacks found presented in Example 41. network internet internet[attHost|FW1] attHost[rsv|AllowIn internet rsv] FW1[DMZ|FW2|AllowIn internet DMZ] DMZ[MS|WS|AllowIn internet WS|AllowIn internet MS] WS[v_WS|web_s|OS_WS|AllowIn internet v_WS] v_WS[Replicate(Accept internet)] web_s[Replicate(Accept v_WS)] OS_WS[Replcate(Accept web_s)]
211
CHAPTER 8. TESTING THE MSAMS APPROACH MS[s_MS|OS_MS|AllowIn internet mail_s] mail_s[Replicate(In internet)] OS_MS[In mail_s] FW2[FW3|sub3|sub4|AllowIn web_s C|AllowIn DMZ sub3] FW3[sub1|C|sub2|AllowIn web_s C|AllowIn sub3 C|AllowIn sub4 C|DenyUp sub1] sub1[A|copy A B 1|AllowIn internet sub1] sub2[D|copy D E 1|AllowIn internet sub2] sub3[copy D F 1|copy D G 1|AllowIn internet sub3] sub4[copy C H 1|copy D I 1|AllowIn internet sub4] --- host C (vulnerable host) C[sv|v|OS|AllowIn internet v] v[Replicate(Accept internet)] sv[Replicate(Accept v)] OS[Replicate(Accept sv)] --- host D (non-vulnerable host) D[rsv|rOS|AllowIn internet rsv] rsv[Replicate(In internet)] rOS[Replicate(In rsv)] --- host A (processing node) A[mpi_s|prOS|AllowIn C mpi_s] mpi_s[Replicate(Accept C)] prOS[Replicate(In mpi_s)]
Example 63 Specification of the power grid network example as in Section 8.3.1; trace of attack found presented in Example 47. network internet internet[CORPnet|world] world[ehome|AllowIn internet world] --- ehome (employee at home) host ehome[v_ehome|AllowIn internet v_ehome] v_ehome[Replicate(Accept internet)] --- corporate network CORPnet[DMZ|fEXT|AllowIn internet CORPnet] DMZ[WS|VS|AllowIn internet DMZ] --- web server WS[s_WS|OS_WS|v_WS|AllowIn internet v_WS] v_WS[Replicate(Accept internet)] s_WS[Replicate(Accept v_WS)] OS_WS[Replicate(Accept s_WS)] --- VPN server VS[s_VS|OS_VS|v_VS|AllowIn internet v_VS] v_VS[Replicate(Accept internet)] s_VS[Replicate(Accept v_VS)] OS_VS[Replicate(Accept s_VS)] --- CORPint subnet fEXT[CORPint|fEMS|AllowIn s_WS FS|AllowIn s_VS CORPint] CORPint[FS|copy UW UW_ 2|citrix|AllowIn internet CORPint] --- file server
212
8.A. CHAPTER APPENDIX: COMPLETE SPECIFICATIONS FS[NFS|FSYS|v_FS|AllowIn internet v_FS] v_FS[Replicate(Accept internet)] NFS[Replicate(Accept v_FS)] FSYS[Replicate(Accept NFS)] --- citrix server citrix[s_citrix|OS_citrix|v_citrix|AllowIn internet v_citrix] v_citrix[Replicate(Accept internet)] s_citrix[Replicate(Accept v_citrix)] OS_citrix[Replicate(Accept s_citrix)] --- user workstation UW[browser_UW|OS_UW|AllowIn s_VS OS_UW] v_UW[Replicate(Accept internet)] browser_UW[Out internet] OS_UW[Replicate(Accept s_VS)|Replicate(In browser_UW)] --- EMS network fEMS[OP|DH|copy CS CS_ 3|AllowIn s_citrix DH] --- data historian server DH[s_DH|OS_DH|v_DH|AllowIn s_citrix s_DH|AllowIn internet v_DH]. v_DH[Replicate(Accept internet)] s_DH[Replicate(Accept v_DH)|Replicate(In s_citrix)] OS_DH[Replicate(Accept s_DH)] --- operating station OP[s_OP|OS_OP|v_OP|AllowIn s_DH s_OP] s_OP[Replicate(Accept s_DH)] v_OP[Replicate(Accept s_OP)] OS_OP[Replicate(Accept v_OP)|Replicate(In CS_0$s_CS)| Replicate(In CS_1$s_CS)| Replicate(In CS_2$s_CS)] --- communication server CS[s_CS|v_CS|OS_CS|AllowIn s_OP s_CS] s_CS[Replicate(Accept s_OP)] v_CS[Replicate(Accept s_CS)] OS_CS[Replicate(Accept v_CS)|Replicate(In s_OP)]
Example 64 Specification of the power grid network example as in Section 8.3.2; trace of attack found presented in Example 53. network internet internet[CORPnet|world] world[ehome|Allow internet world] --- ehome (employee at home) host ehome[v_ehome|exp_ehome|AllowIn internet v_ehome] v_ehome[Replicate(Accept internet)] exp_ehome[Replicate(Accept v_ehome)|ReleaseCred valid_cred$cred_0] --- corporate network CORPnet[DMZ|fEXT|valid_cred|AllowIn internet CORPnet] DMZ[WS|VS|Allow internet DMZ] --- web server WS[s_WS|OS_WS|Allow internet s_WS]
213
CHAPTER 8. TESTING THE MSAMS APPROACH s_WS[Replicate(In internet)] OS_WS[Replicate(In s_WS)] --- VPN server VS[s_VS|OS_VS|AllowIn internet s_VS] s_VS[Replicate(Accept valid_cred)] OS_VS[Replicate(In s_VS)] --- users valid credentials valid_cred[copy cred cred_ 2|AllowIn internet valid_cred] cred[Replicate(Accept internet)] --- CORPint subnet fEXT[CORPint|fEMS|AllowIn s_WS FS|AllowIn s_VS CORPint] CORPint[FS|copy UW UW_ 2|citrix|AllowIn internet CORPint] --- file server FS[NFS|FSYS|AllowIn s_WS NFS|AllowIn s_VS NFS|AllowIn login_UW NFS] NFS[Replicate(In s_WS)|Replicate(Accept s_VS)|Replicate(Accept login_UW)] FSYS[Replicate(Accept NFS)|Replicate(In NFS)] --- citrix server citrix[s_citrix|OS_citrix|AllowIn s_VS s_citrix|AllowIn login_UW s_citrix] s_citrix[Replicate(Accept s_VS)|Replicate(Accept login_UW)] OS_citrix[Replicate(In s_citrix)] --- user workstation UW[browser_UW|login_UW|OS_UW|AllowIn s_VS OS_UW|AllowIn CORPint login_UW] browser_UW[Replicate(Out internet)] login_UW[Replicate(Accept valid_cred)] OS_UW[Replicate(Accept s_VS)|Replicate(Accept login_UW)| Replicate(In browser_UW)] --- EMS network fEMS[OP|DH|copy CS CS_ 3|AllowIn s_citrix DH] --- data historian DH[s_DH|OS_DH|v_DH|AllowIn s_citrix s_DH|AllowIn internet v_DH] v_DH[Replicate(Accept internet)] s_DH[Replicate(Accept v_DH)|Replicate(In s_citrix)] OS_DH[Replicate(Accept s_DH)] --- operation station OP[s_OP|OS_OP|v_OP|AllowIn s_DH s_OP] s_OP[Replicate(Accept s_DH)] v_OP[Replicate(Accept s_OP)] OS_OP[Replicate(Accept v_OP)|Replicate(In CS_0$s_CS)| Replicate(In CS_1$s_CS)| Replicate(In CS_2$s_CS)] --- communication servers CS[s_CS|v_CS|OS_CS|AllowIn s_OP s_CS] s_CS[Replicate(Accept s_OP)] v_CS[Replicate(Accept s_CS)] OS_CS[Replicate(Accept v_CS)|Replicate(In s_OP)]
Example 65 Specification of the power grid network example as in Section 8.3.3; trace of attack found presented in Example 55. 214
8.A. CHAPTER APPENDIX: COMPLETE SPECIFICATIONS network internet internet[CORPnet|world] world[ehome|Allow internet world] --- ehome (employee at home) host ehome[v_ehome|exp_ehome|AllowIn internet v_ehome] v_ehome[Replicate(Accept internet)] exp_ehome[Replicate(Accept v_ehome)|ReleaseCred valid_cred$cred_0] --- corporate network CORPnet[DMZ|fEXT|valid_cred|AllowIn internet CORPnet] DMZ[WS|VS|Allow internet DMZ] --- web server WS[s_WS|OS_WS|Allow internet s_WS] s_WS[Replicate(In internet)] OS_WS[Replicate(In s_WS)] --- VPN server VS[s_VS|OS_VS|AllowIn internet s_VS] s_VS[Replicate(Accept valid_cred)] OS_VS[Replicate(In s_VS)] --- users valid credentials valid_cred[copy cred cred_ 2|AllowIn internet valid_cred] cred[Replicate(Accept internet)] --- CORPint subnet fEXT[CORPint|fEMS|AllowIn s_WS FS|AllowIn s_VS CORPint] CORPint[FS|copy UW UW_ 2|citrix|AllowIn internet CORPint] --- file server FS[NFS|FSYS|AllowIn s_WS NFS|AllowIn s_VS NFS|AllowIn login_UW NFS] NFS[Replicate(In s_WS)|Replicate(Accept s_VS)|Replicate(Accept login_UW)] FSYS[Replicate(Accept NFS)|Replicate(In NFS)] --- citrix server citrix[s_citrix|OS_citrix|AllowIn login_UW s_citrix] s_citrix[Replicate(Accept login_UW)] OS_citrix[Replicate(In s_citrix)] --- user workstation UW[browser_UW|login_UW|OS_UW|AllowIn s_VS OS_UW|AllowIn CORPint login_UW] browser_UW[Replicate(Out internet)] login_UW[Replicate(Accept valid_cred)] OS_UW[Replicate(Accept s_VS)|Replicate(Accept login_UW)| Replicate(In browser_UW)] --- EMS network fEMS[OP|DH|copy CS CS_ 3|AllowIn s_citrix DH] --- data historian DH[s_DH|OS_DH|v_DH|AllowIn s_citrix s_DH|AllowIn internet v_DH] v_DH[Replicate(Accept internet)] s_DH[Replicate(Accept v_DH)|Replicate(In s_citrix)] OS_DH[Replicate(Accept s_DH)] --- operation station OP[s_OP|OS_OP|v_OP|AllowIn s_DH s_OP] s_OP[Replicate(Accept s_DH)] v_OP[Replicate(Accept s_OP)]
215
CHAPTER 8. TESTING THE MSAMS APPROACH OS_OP[Replicate(Accept v_OP)|Replicate(In Replicate(In Replicate(In --- communication servers CS[s_CS|v_CS|OS_CS|AllowIn s_OP s_CS] s_CS[Replicate(Accept s_OP)] v_CS[Replicate(Accept s_CS)] OS_CS[Replicate(Accept v_CS)|Replicate(In
CS_0$s_CS)| CS_1$s_CS)| CS_2$s_CS)]
s_OP)]
Example 66 Specification of the power grid network example as in Section 8.3.4; trace of attack found presented in Example 59. network internet internet[CORPnet|world|kerberos] world[ehome|AllowIn internet world] --- CORPnet network CORPnet[DMZ|fEXT|valid_cred|Allow internet CORPnet] --- employee at home host ehome[v_ehome|exp_ehome|AllowIn internet v_ehome] v_ehome[Replicate(Accept internet)] exp_ehome[Replicate(Accept v_ehome)|ReleaseCred valid_cred$cred_0] --- DMZ subnet DMZ[WS|VS|Allow internet DMZ] --- web server WS[s_WS|OS_WS|AllowIn internet s_WS] s_WS[In internet] OS_WS[In s_WS] --- VPN server VS[s_VS|OS_VS|AllowIn internet s_VS] s_VS[Accept valid_cred] OS_VS[In s_VS] --- valid users credentials valid_cred[copy cred cred_ 2|AllowIn internet valid_cred] cred[Accept internet] --- external firewall fEXT[CORPint|fEMS|AllowIn s_WS FS|AllowIn s_VS CORPint] --- CORPint subnet CORPint[FS|UWgroup|citrix|AllowIn internet CORPint] --- file server FS[NFS|FSYS|AllowIn s_WS NFS|AllowIn s_VS NFS|AllowIn UWgroup$login_UW NFS] NFS[In s_WS|Accept s_VS|Accept UWgroup$login_UW] FSYS[Accept NFS|In NFS] --- citrix citrix[s_citrix|OS_citrix|kerb_interface|AllowIn UWgroup$login_UW s_citrix] s_citrix[Accept UWgroup$login_UW] kerb_interface[Accept s_citrix] OS_citrix[In s_citrix] --- user workstations group UWgroup[UWSgroup|UWEgroup|login_UW|AllowIn s_VS UWgroup|
216
8.A. CHAPTER APPENDIX: COMPLETE SPECIFICATIONS AllowIn CORPint login_UW] login_UW[Accept valid_cred] --- standard workstations group UWSgroup[copy UWS UWS_ 10|Allow s_VS UWSgroup] --- extended workstations group UWEgroup[copy UWE UWE_ 2|cred_kerb|AllowIn s_VS UWEgroup] cred_kerb[copy credKB credKB_ 2|AllowIn CORPint cred_kerb] credKB[Accept internet] --- standard workstation UWS[browser_UWS|OS_UWS|AllowIn s_VS OS_UWS|AllowIn CORPint login_UW] browser_UWS[Out internet] OS_UWS[In s_VS|In UWgroup$login_UW|In browser_UWS]. --- extended workstation UWE[browser_UWE|OS_UWE|AllowIn s_VS OS_UWE|AllowIn CORPint login_UW] browser_UWE[Out internet] OS_UWE[Accept s_VS|Accept login_UW|In browser_UWE] --- EMS network fEMS[OP|DH|copy CS CS_ 3|AllowIn dh_interface DH] --- data historian DH[s_DH|OS_DH|v_DH|AllowIn s_citrix s_DH|AllowIn internet v_DH] v_DH[Accept internet] s_DH[Accept v_DH|Accept keyDH] OS_DH[Accept s_DH] --- operation station OP[s_OP|OS_OP|v_OP|AllowIn s_DH s_OP] s_OP[Accept s_DH] v_OP[Accept s_OP] OS_OP[Accept v_OP|In CS_0$s_CS|In CS_1$s_CS|In CS_2$s_CS] --- communication servers CS[s_CS|v_CS|OS_CS|AllowIn s_OP s_CS] s_CS[Accept s_OP] v_CS[Accept s_CS] OS_CS[Accept v_CS|In s_OP] --- kerberos infrastructure kerberos[AS|TGS|AllowIn kerb_interface AS] AS[TGT|Accept UWEgroup$cred_kerb|ReleaseCred TGT] TGT[Accept internet] TGS[keyDH|Accept TGT|ReleaseKey keyDH] keyDH[Accept internet]
Example 67 Specification of the power grid network example as in Section 8.3.5; no attack found. network internet internet[CORPnet|world|kerberos] world[ehome|AllowIn internet world] --- CORPnet network CORPnet[DMZ|fEXT|valid_cred|Allow internet CORPnet] --- employee at home host
217
CHAPTER 8. TESTING THE MSAMS APPROACH ehome[v_ehome|AllowIn internet v_ehome] v_ehome[Accept internet] --- DMZ subnet DMZ[WS|VS|Allow internet DMZ] --- web server WS[s_WS|OS_WS|AllowIn internet s_WS] s_WS[In internet] OS_WS[In s_WS] --- VPN server VS[s_VS|OS_VS|AllowIn internet s_VS] s_VS[Accept valid_cred] OS_VS[In s_VS] --- valid users credentials valid_cred[copy cred cred_ 2|AllowIn internet valid_cred] cred[Accept internet] --- external firewall fEXT[CORPint|fEMS|AllowIn s_WS FS|AllowIn s_VS CORPint] --- CORPint subnet CORPint[FS|UWgroup|citrix|AllowIn internet CORPint] --- file server FS[NFS|FSYS|AllowIn s_WS NFS|AllowIn s_VS NFS|AllowIn UWgroup$login_UW NFS] NFS[In s_WS|Accept s_VS|Accept UWgroup$login_UW] FSYS[Accept NFS|In NFS] --- citrix citrix[s_citrix|OS_citrix|kerb_interface|dh_interface| AllowIn UWgroup$login_UW s_citrix] s_citrix[Accept UWgroup$login_UW] kerb_interface[Accept s_citrix] dh_interface[Accept kerberos$tgs$keyDH] OS_citrix[In s_citrix] --- user workstations group UWgroup[UWSgroup|UWEgroup|login_UW|AllowIn s_VS UWgroup| AllowIn CORPint login_UW] login_UW[Accept valid_cred] --- standard workstations group UWSgroup[copy UWS UWS_ 10|Allow s_VS UWSgroup] --- extended workstations group UWEgroup[copy UWE UWE_ 2|cred_kerb|AllowIn s_VS UWEgroup] cred_kerb[copy credKB credKB_ 2|AllowIn CORPint cred_kerb] credKB[Accept internet] --- standard workstation UWS[browser_UWS|OS_UWS|AllowIn s_VS OS_UWS|AllowIn CORPint login_UW] browser_UWS[Out internet] OS_UWS[In s_VS|In UWgroup$login_UW|In browser_UWS]. --- extended workstation UWE[browser_UWE|OS_UWE|AllowIn s_VS OS_UWE|AllowIn CORPint login_UW] browser_UWE[Out internet] OS_UWE[Accept s_VS|Accept login_UW|In browser_UWE] --- EMS network
218
8.B. CHAPTER APPENDIX: PAGERANK AND HITS SCORES fEMS[OP|DH|copy CS CS_ 3|AllowIn dh_interface DH] --- datahistorian DH[s_DH|OS_DH|v_DH|AllowIn dh_interface s_DH|AllowIn internet v_DH] v_DH[Accept internet] s_DH[Accept v_DH|Accept dh_interface] OS_DH[Accept s_DH] --- operation station OP[s_OP|OS_OP|v_OP|AllowIn s_DH s_OP] s_OP[Accept s_DH] v_OP[Accept s_OP] OS_OP[Accept v_OP|In CS_0$s_CS|In CS_1$s_CS|In CS_2$s_CS] --- communication servers CS[s_CS|v_CS|OS_CS|AllowIn s_OP s_CS] s_CS[Accept s_OP] v_CS[Accept s_CS] OS_CS[Accept v_CS|In s_OP] --- kerberos infrastructure kerberos[AS|TGS|AllowIn kerb_interface AS] AS[TGT|Accept UWEgroup$cred_kerb|ReleaseCred TGT] TGT[Accept internet] TGS[keyDH|Accept TGT|ReleaseKey keyDH] keyDH[Accept internet]
8.B Chapter Appendix: PageRank and HITS Scores
219
CHAPTER 8. TESTING THE MSAMS APPROACH ambient $INTERNET$WORLD$EHOME $INTERNET$CORPNET$FEXT$FEMS$DH $INTERNET$CORPNET$FEXT$FEMS$OP$S OP $INTERNET$CORPNET$FEXT$CORPINT $INTERNET$CORPNET$FEXT$CORPINT$CITRIX $INTERNET$WORLD $INTERNET$WORLD$EHOME$V EHOME $INTERNET$CORPNET$FEXT$FEMS$CS 0$S CS $INTERNET$CORPNET$FEXT$FEMS$DH$V DH $INTERNET$CORPNET$DMZ$VS$OS VS $INTERNET$CORPNET$FEXT$FEMS$CS 1$V CS $INTERNET$CORPNET$FEXT$FEMS$OP $INTERNET$CORPNET$FEXT$CORPINT$UW 0$OS UW $INTERNET$CORPNET$FEXT$CORPINT$FS $INTERNET$CORPNET$FEXT$CORPINT$FS$V FS $INTERNET$CORPNET$FEXT$CORPINT$FS$FSYS $INTERNET$CORPNET $INTERNET$CORPNET$FEXT$FEMS$CS 2 $INTERNET$CORPNET$FEXT$FEMS$CS 0$V CS $INTERNET$CORPNET$FEXT$FEMS$DH$OS DH $INTERNET$CORPNET$FEXT$CORPINT$CITRIX$OS CITRIX $INTERNET$CORPNET$FEXT$CORPINT$UW 1$OS UW $INTERNET$CORPNET$FEXT$CORPINT$FS$NFS $INTERNET$CORPNET$DMZ$VS $INTERNET$CORPNET$DMZ$VS$V VS $INTERNET$CORPNET$DMZ$WS $INTERNET $INTERNET$CORPNET$FEXT$FEMS$CS 2$S CS $INTERNET$CORPNET$FEXT$FEMS$CS 1 $INTERNET$CORPNET$FEXT$FEMS$CS 1$OS CS $INTERNET$CORPNET$FEXT$FEMS$CS 1$S CS $INTERNET$CORPNET$FEXT$CORPINT$CITRIX$S CITRIX $INTERNET$CORPNET$DMZ$WS$OS WS $INTERNET$CORPNET$FEXT$FEMS$CS 0 $INTERNET$CORPNET$FEXT$CORPINT$CITRIX$V CITRIX $INTERNET$CORPNET$FEXT$CORPINT$UW 0$BROWSER UW $INTERNET$CORPNET$DMZ$VS$S VS $INTERNET$CORPNET$FEXT $INTERNET$CORPNET$FEXT$FEMS$CS 2$OS CS $INTERNET$CORPNET$FEXT$FEMS$CS 2$V CS $INTERNET$CORPNET$FEXT$FEMS$CS 0$OS CS $INTERNET$CORPNET$FEXT$FEMS$DH$S DH $INTERNET$CORPNET$FEXT$CORPINT$UW 1 $INTERNET$CORPNET$DMZ $INTERNET$CORPNET$DMZ$WS$V WS $INTERNET$CORPNET$FEXT$FEMS $INTERNET$CORPNET$FEXT$FEMS$OP$V OP $INTERNET$CORPNET$FEXT$FEMS$OP$OS OP $INTERNET$CORPNET$FEXT$CORPINT$UW 1$BROWSER UW $INTERNET$CORPNET$FEXT$CORPINT$UW 0 $INTERNET$CORPNET$DMZ$WS$S WS
pagerank value 0.004304162 0.004304162 0.0049764668 0.004304162 0.004304162 0.004304162 0.16886869 0.0047271634 0.014282447 0.010406292 0.004878176 0.004304162 0.010406292 0.004304162 0.047588766 0.0060600317 0.004304162 0.004304162 0.004878176 0.0049764668 0.005636937 0.010406292 0.012394282 0.004304162 0.18751004 0.004304162 0.004304162 0.0047271634 0.004304162 0.004896513 0.0047271634 0.010975675 0.01406757 0.004304162 0.039243966 0.004304162 0.057431955 0.004304162 0.004896513 0.004878176 0.004896513 0.0063275234 0.004304162 0.004304162 0.18751004 0.004304162 0.0047271634 0.004878176 0.004304162 0.004304162 0.057431955
Table 8.2: PageRank scores, power grid example, Section 8.3.1 (α = 0.85) 220
8.B. CHAPTER APPENDIX: PAGERANK AND HITS SCORES ambient $INTERNET$WORLD$EHOME $INTERNET$CORPNET$FEXT$FEMS$DH $INTERNET$CORPNET$FEXT$FEMS$OP$S OP $INTERNET$CORPNET$FEXT$CORPINT $INTERNET$CORPNET$FEXT$CORPINT$CITRIX $INTERNET$WORLD $INTERNET$WORLD$EHOME$V EHOME $INTERNET$CORPNET$FEXT$FEMS$CS 0$S CS $INTERNET$CORPNET$FEXT$FEMS$DH$V DH $INTERNET$CORPNET$DMZ$VS$OS VS $INTERNET$CORPNET$FEXT$FEMS$CS 1$V CS $INTERNET$CORPNET$FEXT$FEMS$OP $INTERNET$CORPNET$FEXT$CORPINT$UW 0$OS UW $INTERNET$CORPNET$FEXT$CORPINT$FS $INTERNET$CORPNET$FEXT$CORPINT$FS$V FS $INTERNET$CORPNET$FEXT$CORPINT$FS$FSYS $INTERNET$CORPNET $INTERNET$CORPNET$FEXT$FEMS$CS 2 $INTERNET$CORPNET$FEXT$FEMS$CS 0$V CS $INTERNET$CORPNET$FEXT$FEMS$DH$OS DH $INTERNET$CORPNET$FEXT$CORPINT$CITRIX$OS CITRIX $INTERNET$CORPNET$FEXT$CORPINT$UW 1$OS UW $INTERNET$CORPNET$FEXT$CORPINT$FS$NFS $INTERNET$CORPNET$DMZ$VS $INTERNET$CORPNET$DMZ$VS$V VS $INTERNET$CORPNET$DMZ$WS $INTERNET $INTERNET$CORPNET$FEXT$FEMS$CS 2$S CS $INTERNET$CORPNET$FEXT$FEMS$CS 1 $INTERNET$CORPNET$FEXT$FEMS$CS 1$OS CS $INTERNET$CORPNET$FEXT$FEMS$CS 1$S CS $INTERNET$CORPNET$FEXT$CORPINT$CITRIX$S CITRIX $INTERNET$CORPNET$DMZ$WS$OS WS $INTERNET$CORPNET$FEXT$FEMS$CS 0 $INTERNET$CORPNET$FEXT$CORPINT$CITRIX$V CITRIX $INTERNET$CORPNET$FEXT$CORPINT$UW 0$BROWSER UW $INTERNET$CORPNET$DMZ$VS$S VS $INTERNET$CORPNET$FEXT $INTERNET$CORPNET$FEXT$FEMS$CS 2$OS CS $INTERNET$CORPNET$FEXT$FEMS$CS 2$V CS $INTERNET$CORPNET$FEXT$FEMS$CS 0$OS CS $INTERNET$CORPNET$FEXT$FEMS$DH$S DH $INTERNET$CORPNET$FEXT$CORPINT$UW 1 $INTERNET$CORPNET$DMZ $INTERNET$CORPNET$DMZ$WS$V WS $INTERNET$CORPNET$FEXT$FEMS $INTERNET$CORPNET$FEXT$FEMS$OP$V OP $INTERNET$CORPNET$FEXT$FEMS$OP$OS OP $INTERNET$CORPNET$FEXT$CORPINT$UW 1$BROWSER UW $INTERNET$CORPNET$FEXT$CORPINT$UW 0 $INTERNET$CORPNET$DMZ$WS$S WS
authority 0.0 0.0 0.03718147 0.0 0.0 0.0 0.01355535 0.036409695 0.032632466 0.020333674 0.036409695 0.0 0.032408234 0.0 0.02646059 0.032408234 0.0 0.0 0.036409695 0.036159508 0.032408234 0.032408234 0.032632466 0.0 0.013649792 0.0 0.0 0.036409695 0.0 0.036159508 0.036409695 0.036409695 0.020333674 0.0 0.02664624 0.032408234 0.03309037 0.0 0.036159508 0.036409695 0.036159508 0.03666337 0.0 0.0 0.013649792 0.0 0.036409695 0.036159508 0.032408234 0.0 0.02664624
hub 2.3772389e-5 2.3772389e-5 0.0060794866 2.3772389e-5 2.3772389e-5 2.3772389e-5 0.16294982 0.006165382 0.09019126 0.0054894593 0.0060374304 2.3772389e-5 0.0054894593 2.3772389e-5 0.14735377 0.00541351 2.3772389e-5 2.3772389e-5 0.0060374304 0.0060794866 0.0060374304 0.0054894593 0.0043941536 2.3772389e-5 0.16293405 2.3772389e-5 2.3772389e-5 0.006165382 2.3772389e-5 0.0060374304 0.006165382 0.004424811 0.004424811 2.3772389e-5 0.14292207 2.3772389e-5 0.0022783186 2.3772389e-5 0.0060374304 0.0060374304 0.0060374304 0.00541351 2.3772389e-5 2.3772389e-5 0.16293405 2.3772389e-5 0.006165382 0.0060374304 2.3772389e-5 2.3772389e-5 0.0022783186
Table 8.3: HITS scores, power grid example, Section 8.3.1 (ξ = 0.85) 221
CHAPTER 8. TESTING THE MSAMS APPROACH ambient $INTERNET$WORLD$EHOME $INTERNET$CORPNET$VALID CRED$CRED 0 $INTERNET$CORPNET$FEXT$FEMS$DH $INTERNET$CORPNET$FEXT$FEMS$OP$S OP $INTERNET$CORPNET$FEXT$CORPINT $INTERNET$CORPNET$FEXT$CORPINT$CITRIX $INTERNET$CORPNET$FEXT$CORPINT$UWGROUP$LOGIN UW $INTERNET$WORLD $INTERNET$WORLD$EHOME$EXP EHOME $INTERNET$WORLD$EHOME$V EHOME $INTERNET$CORPNET$FEXT$FEMS$CS 0$S CS $INTERNET$CORPNET$FEXT$FEMS$DH$V DH $INTERNET$CORPNET$DMZ$VS$OS VS $INTERNET$CORPNET$FEXT$FEMS$CS 1$V CS $INTERNET$CORPNET$FEXT$FEMS$OP $INTERNET$CORPNET$FEXT$CORPINT$UWGROUP$UW 0$OS UW $INTERNET$CORPNET$FEXT$CORPINT$FS $INTERNET$CORPNET$FEXT$CORPINT$FS$FSYS $INTERNET$CORPNET $INTERNET$CORPNET$FEXT$FEMS$CS 2 $INTERNET$CORPNET$FEXT$FEMS$CS 0$V CS $INTERNET$CORPNET$FEXT$FEMS$DH$OS DH $INTERNET$CORPNET$FEXT$CORPINT$CITRIX$OS CITRIX $INTERNET$CORPNET$FEXT$CORPINT$UWGROUP $INTERNET$CORPNET$FEXT$CORPINT$UWGROUP$UW 1 $INTERNET$CORPNET$FEXT$CORPINT$FS$NFS $INTERNET$CORPNET$DMZ$VS $INTERNET$CORPNET$DMZ$WS $INTERNET $INTERNET$CORPNET$FEXT$FEMS$CS 2$S CS $INTERNET$CORPNET$FEXT$FEMS$CS 1 $INTERNET$CORPNET$FEXT$FEMS$CS 1$OS CS $INTERNET$CORPNET$FEXT$FEMS$CS 1$S CS $INTERNET$CORPNET$FEXT$CORPINT$CITRIX$S CITRIX $INTERNET$CORPNET$FEXT$CORPINT$UWGROUP$UW 0 $INTERNET$CORPNET$FEXT$CORPINT$UWGROUP$UW 0$BROWSER UW $INTERNET$CORPNET$DMZ$WS$OS WS $INTERNET$CORPNET$VALID CRED $INTERNET$CORPNET$FEXT$FEMS$CS 0 $INTERNET$CORPNET$FEXT$CORPINT$UWGROUP$UW 1$OS UW $INTERNET$CORPNET$DMZ$VS$S VS $INTERNET$CORPNET$FEXT $INTERNET$CORPNET$FEXT$FEMS$CS 2$OS CS $INTERNET$CORPNET$FEXT$FEMS$CS 2$V CS $INTERNET$CORPNET$FEXT$FEMS$CS 0$OS CS $INTERNET$CORPNET$FEXT$FEMS$DH$S DH $INTERNET$CORPNET$DMZ $INTERNET$CORPNET$VALID CRED$CRED 1 $INTERNET$CORPNET$FEXT$FEMS $INTERNET$CORPNET$FEXT$FEMS$OP$V OP $INTERNET$CORPNET$FEXT$FEMS$OP$OS OP $INTERNET$CORPNET$FEXT$CORPINT$UWGROUP$UW 1$BROWSER UW $INTERNET$CORPNET$DMZ$WS$S WS
pagerank value 0.004267429 0.18106595 0.004267429 0.0055145174 0.004267429 0.004267429 0.004267429 0.004267429 0.055569414 0.18106595 0.0048533524 0.021342969 0.004267429 0.005092503 0.004267429 0.017244648 0.004267429 0.008086067 0.004267429 0.004267429 0.005092503 0.0055145174 0.004267429 0.004267429 0.004267429 0.017970113 0.004267429 0.004267429 0.004267429 0.0048533524 0.004267429 0.0051331576 0.0048533524 0.017970113 0.004267429 0.004267429 0.004267429 0.004267429 0.004267429 0.017244648 0.1068714 0.004267429 0.0051331576 0.005092503 0.0051331576 0.008802851 0.004267429 0.18106595 0.004267429 0.0048533524 0.005092503 0.004267429 0.004267429
Table 8.4: PageRank scores, power grid example, Section 8.3.2 (α = 0.85) 222
8.B. CHAPTER APPENDIX: PAGERANK AND HITS SCORES ambient $INTERNET$WORLD$EHOME $INTERNET$CORPNET$VALID CRED$CRED 0 $INTERNET$CORPNET$FEXT$FEMS$DH $INTERNET$CORPNET$FEXT$FEMS$OP$S OP $INTERNET$CORPNET$FEXT$CORPINT $INTERNET$CORPNET$FEXT$CORPINT$CITRIX $INTERNET$CORPNET$FEXT$CORPINT$UWGROUP$LOGIN UW $INTERNET$WORLD $INTERNET$WORLD$EHOME$EXP EHOME $INTERNET$WORLD$EHOME$V EHOME $INTERNET$CORPNET$FEXT$FEMS$CS 0$S CS $INTERNET$CORPNET$FEXT$FEMS$DH$V DH $INTERNET$CORPNET$DMZ$VS$OS VS $INTERNET$CORPNET$FEXT$FEMS$CS 1$V CS $INTERNET$CORPNET$FEXT$FEMS$OP $INTERNET$CORPNET$FEXT$CORPINT$UWGROUP$UW 0$OS UW $INTERNET$CORPNET$FEXT$CORPINT$FS $INTERNET$CORPNET$FEXT$CORPINT$FS$FSYS $INTERNET$CORPNET $INTERNET$CORPNET$FEXT$FEMS$CS 2 $INTERNET$CORPNET$FEXT$FEMS$CS 0$V CS $INTERNET$CORPNET$FEXT$FEMS$DH$OS DH $INTERNET$CORPNET$FEXT$CORPINT$CITRIX$OS CITRIX $INTERNET$CORPNET$FEXT$CORPINT$UWGROUP $INTERNET$CORPNET$FEXT$CORPINT$UWGROUP$UW 1 $INTERNET$CORPNET$FEXT$CORPINT$FS$NFS $INTERNET$CORPNET$DMZ$VS $INTERNET$CORPNET$DMZ$WS $INTERNET $INTERNET$CORPNET$FEXT$FEMS$CS 2$S CS $INTERNET$CORPNET$FEXT$FEMS$CS 1 $INTERNET$CORPNET$FEXT$FEMS$CS 1$OS CS $INTERNET$CORPNET$FEXT$FEMS$CS 1$S CS $INTERNET$CORPNET$FEXT$CORPINT$CITRIX$S CITRIX $INTERNET$CORPNET$FEXT$CORPINT$UWGROUP$UW 0 $INTERNET$CORPNET$FEXT$CORPINT$UWGROUP$UW 0$BROWSER UW $INTERNET$CORPNET$DMZ$WS$OS WS $INTERNET$CORPNET$VALID CRED $INTERNET$CORPNET$FEXT$FEMS$CS 0 $INTERNET$CORPNET$FEXT$CORPINT$UWGROUP$UW 1$OS UW $INTERNET$CORPNET$DMZ$VS$S VS $INTERNET$CORPNET$FEXT $INTERNET$CORPNET$FEXT$FEMS$CS 2$OS CS $INTERNET$CORPNET$FEXT$FEMS$CS 2$V CS $INTERNET$CORPNET$FEXT$FEMS$CS 0$OS CS $INTERNET$CORPNET$FEXT$FEMS$DH$S DH $INTERNET$CORPNET$DMZ $INTERNET$CORPNET$VALID CRED$CRED 1 $INTERNET$CORPNET$FEXT$FEMS $INTERNET$CORPNET$FEXT$FEMS$OP$V OP $INTERNET$CORPNET$FEXT$FEMS$OP$OS OP $INTERNET$CORPNET$FEXT$CORPINT$UWGROUP$UW 1$BROWSER UW $INTERNET$CORPNET$DMZ$WS$S WS
authority 0.0 0.020013204 0.0 0.036112405 0.0 0.0 0.030657565 0.0 0.029418051 0.01980887 0.03501747 0.02971537 0.029418051 0.03501747 0.0 0.029418051 0.0 0.029418051 0.0 0.0 0.03501747 0.0346671 0.029418051 0.0 0.0 0.02971537 0.0 0.0 0.0 0.03501747 0.0 0.0346671 0.03501747 0.0346671 0.0 0.029418051 0.029418051 0.0 0.0 0.029418051 0.031283587 0.0 0.0346671 0.03501747 0.0346671 0.035374995 0.0 0.020013204 0.0 0.03501747 0.0346671 0.029418051 0.029418051
Table 8.5: HITS scores, power grid example, Section 8.3.2 (ξ = 0.85) 223
hub 3.3308672e-5 0.2312522 3.3308672e-5 0.008380173 3.3308672e-5 3.3308672e-5 3.3308672e-5 3.3308672e-5 0.004707155 0.2313004 0.0085548265 0.12381217 3.3308672e-5 0.008295492 3.3308672e-5 0.0074153794 3.3308672e-5 0.007044397 3.3308672e-5 3.3308672e-5 0.008295492 0.008380173 3.3308672e-5 3.3308672e-5 3.3308672e-5 0.014649088 3.3308672e-5 3.3308672e-5 3.3308672e-5 0.0085548265 3.3308672e-5 0.008295492 0.0085548265 0.014649088 3.3308672e-5 3.3308672e-5 3.3308672e-5 3.3308672e-5 3.3308672e-5 0.0074153794 0.009477406 3.3308672e-5 0.008295492 0.008295492 0.008295492 0.007044397 3.3308672e-5 0.2312522 3.3308672e-5 0.0085548265 0.008295492 3.3308672e-5 3.3308672e-5
9
Scalability of the MsAMS Approach
In the previous chapter we have validated the MsAMS approach using two example scenarios, one of them in several versions. We have shown how the approach allows network administrators to reason and gain insights about a real network through a model of the network. In this chapter, we validate the scalability of the MsAMS approach. In this respect, we use the proof-of-concept tool to show that the approach is feasible in practice. First, we provide a bird’s eye view of the implemented modules in Section 9.1. Then, we evaluate their performance and memory consumption under an increasing number of ambients and number of firewall rules, in Section 9.2. With a benchmark of tests we use statistical analysis to produce evidence showing that the overall performance of the tool is quadratic, therefore, comparable to the best attack graphs available. Throughout this chapter, and in Chapter 10, we also identify possible improvements.
9.1 Overview of the MsAMS Tool The implementation of the proof-of-concept MsAMS tool is composed of the following modules: 1. Network Expansion This module transforms collapsed ambient names contained in a network model to DNS-like, i.e. hierarchically expanded names, as mentioned in Sections 7.7 and 8.1. It also expands the copy command, mentioned in Section 8.1, a facility made available to duplicate ambient specifications. 2. Network Compilation This module converts ambient terms from a network model to an internal representation of the network recognized by the remaining modules1 . This 1 This conversion involves, e.g., the creation of a table of symbols containing (internal) efficient ambient names, the mapping between (external) expanded ambient names (generated by the previous module) and their internal representation as in the table of symbols, and a compact representation of ambients actions.
225
CHAPTER 9. SCALABILITY OF THE MSAMS APPROACH modules returns a compilation error if an ambient model is not complete, according to Definition 28, if the model has any ambiguity (e.g. if two ambients A and B contain a sub-ambient named v, the distinction between A$v and B$v must be explicit in the model), or if there is a syntax error such that an ambient action not belonging to the set of possible actions as in Definition 18 or an ambient name not complying with the naming convention mentioned in Example 5 (page 128). 3. Links Computation This module computes links as described in Section 7.8 (page 139). Therefore, it computes all possible links derived from Accept and In actions, according to the reduction rules described in Appendix A, for ambients of a network. As a result, it creates a sparse matrix L of zeros and ones, and a table of Accept links (i.e. inlinks and outlinks of each ambient) specifically prepared for the search module. 4. PageRank Computation This module computes PageRank scores, as described in Section 7.9.2 (page 143). It reads the sparse matrix of links generated by the previous module, but (in its current version) uses a dense representation of this matrix to calculate the vector of PageRank scores according to Equation 7.2. In fact, it reuses an implementation in C for operations with (dense) matrix, i.e., matrix transpose, and multiplication between matrix and vector. 5. HITS Computation This module computes HITS scores, as described in Section 7.9.3 (page 145). Similar to what happens with the PageRank module, it also reuses the same implementation for matrix operations to calculate authority and hub vectors according to Equations 7.5 and 7.6, respectively. 6. Attack Search This module performs the search for attacks, as described in Section 7.11 (page 158). The list of candidate ambients from a current ambient is obtained from the table of Accept links, pre-processed by the “Links Computation” module. Early versions of those modules were implemented in Python. However, the Python versions were too slow for any serious testing of scalability, something that we should have expected given the results in http://shootout.alioth.debian. org/u32q/2 . Therefore, using the experience of the HEP (High Energy Physics) group at Brunel University (http://www.gridpp.ac.uk/tier2/london/) with grid and distributed computing, and with functional languages programming, a partnership was established, resulting in the current version of the MsAMS 2 For a simple example, see http://shootout.alioth.debian.org/u32q/benchmark.php? test=binarytrees&lang=all
226
9.2. SCALABILITY OF THE MSAMS TOOL implementation, evaluated in the next section. Therefore, modules “Network Expansion” (428 lines of code - LOC), “Network Compilation” (385 LOC), and “Links Computation” (366 LOC) were implemented in Haskell3 , and “Attack Search” (1453 LOC) in Lisp4 . As mentioned above, “PageRank Computation” (478 LOC) and “HITS Computation” (433 LOC) were implemented in C5 reusing code for matrix manipulation (246 LOC); additionally, 4 of the modules enumerated above use an I/O routine in C (246 LOC). The choice for Haskell relies on the fact that this is a good option for prototyping; code tends to be much shorter than equivalent in C. Furthermore, because of its strong type system, a lot of errors are either not possible (e.g., segmentation fault errors) or are caught by the compiler itself. Additionally, it provides recursive types (not available in C), very useful for the expand and compile modules. The choice for Lisp is motivated by the fact that it allows changes in code at execution time, as it happens with Python, an useful feature for prototyping the search module, but without compromising performance, as we will see in the following section.
9.2 Scalability of the MsAMS Tool Next, we analyze the performance of the modules introduced in the previous section in terms of (i) increasing number of ambients, and (ii) increasing number of firewall rules. In addition, we analyze RAM memory consumed by the most relevant modules under varied number of ambients. All the tests reported in this section were performed in a machine running GNU/Linux distribution Ubuntu 9.04 64 bits, kernel 2.6.28-13-generic #45-Ubuntu SMP, with the following hardware configuration: processor: Intel(R) Xeon(R) CPU model: E5345 CPU: 2.33 GHz cache size: 4096 KB 8 cores (only 1 core used for running tests) total RAM memory: 8078448 KB total swap: 5831552 KB
9.2.1
Time Performance with Increasing Number of Ambients
We use for this set of tests the running example from Chapter 7, slightly modified. Here, we have several copies of host A, host C and host D, not protected by the firewall, and host E, and 2 copies of host F, under the protection of the firewall, i.e. contained in the ambient FW. The firewall allows interaction between hosts 3 GHC
6.10.2: Glasgow Haskell Compiler, http://haskell.org/ghc Bank Common Lisp: SBCL 1.0.29, http://www.sbcl.org/ 5 Gnu C Compiler: gcc 4.3.3, http://gcc.gnu.org/ 4 Steel
227
CHAPTER 9. SCALABILITY OF THE MSAMS APPROACH C or D to host E, as specified in Example 68. We use this model with a varying number of copies of ambient A; the initial configuration uses 500 copies of A, bringing the total of ambients to 2022, and the final configuration uses 5000 copies of host A, bringing the total of ambients to 20022. Example 68 Specification of the network used for running the performance tests, reported in Table 9.1. network net net[copy A A_ 500|C|D|FW] A[v|s|OS|AllowIn net v] C[s|v|OS|AllowIn net v] D[s|v|OS|AllowIn net v] s[Accept v] v[Accept net] OS[In s] FW[E|copy F F_ 2|AllowIn C$s E$v|AllowIn D$s E$v] E[s|v|OS|AllowIn net v] F[s|v|OS|AllowIn net v]
Table 9.1 shows the performance data collected with an increasing number of ambients6 . Note that the total computation times were also measured, therefore, they do not correspond exactly to the sum of time spent by each module for a certain number of ambients; this difference is expected since there is an uncertainty involved with the time measures collected, i.e. they are not 100% accurate. We executed the MsAMS tool with the following input, and obtained the attack trace C$v.C$s.E$v.E$s, independent from the number of ambients used. • source ambient: A 3$s • target ambient: E$s • search type: forward-search • fitness function: hubbiest-node
Figure 9.1 (page 230) shows a plot with the performance data presented in Table 9.1. This plot makes it visually clear that the computation of links is the most demanding module in terms of time performance. Then, there is a considerable gap between this and the next 3 demanding modules, i.e. the module that computes HITS, the search module and the module that computes PageRank. We analyze the complexity of those modules in theory next. Proposition 2 The complexity of the computation of both PageRank and HITS is O(n2 ) [120], where n is the number of ambients in the network model. Proof. Each iteration of PageRank involves one vector-matrix multiplication (Equation 7.2) that typically requires O(n2 ) computations, while each iteration of 6 We obtained execution time with the command: /usr/bin/time−−f ormat =00 %C : %U s00 , that captures the time spent in user mode by the evaluated program.
228
9.2. SCALABILITY OF THE MSAMS TOOL
Ambients 2022 4022 6022 8022 10022 12022 14022 16022 18022 20022
Expand
Compile
0.04 0.15 0.32 0.60 0.96 1.44 2.06 2.84 3.74 4.78
0.11 0.23 0.35 0.50 0.66 0.79 0.97 1.12 1.23 1.41
Links PageRank Times in seconds 1.32 0.33 5.82 1.28 13.08 2.66 24.45 4.70 39.82 7.28 60.85 10.49 82.30 14.37 110.00 18.60 145.98 23.52 179.53 29.20
HITS
Search
Total
0.54 2.28 5.23 9.13 14.90 21.54 29.56 40.69 53.05 69.28
0.55 1.50 3.17 5.00 7.21 11.32 16.21 23.79 31.87 42.24
2.96 11.35 24.94 44.40 71.58 106.35 145.40 197.22 261.52 326.04
Table 9.1: Performance of modules with varied number of ambients HITS involves two vector-matrix multiplication for the computation of authorities (Equation 7.5)7 and two more for the computation of hubs (Equation 7.6). Therefore, HITS processing time is more demanding compared to PageRank (this is visible in Figure 9.1, page 230) although its complexity remains O(n2 ). Proposition 3 The complexity of the computation of links is O(drn2 ), where: d: is the depth of the locality tree, i.e. the maximum nesting of ambients representing the hierarchy of a network r: is the maximum number of firewall rules in the network model n: is the number of ambients in the network model Proof. For each pair of ambients (x, y), the computation of links involves determining if there is a link between x and y. In the worst-case it involves n2 tests. Determining if there is a link between x and y involves traversing the locality tree from x to the lca(x, y) and from y to the lca(x, y) (see Definition 43 in Appendix A), demanding as such comparisons against the firewall rules of the most 2d ambients. The comparison against the firewall rules of each ambient demands O(r) because r is the maximum number of firewall rules in any ambient in the network. In practice, d and r are limited. The hierarchy of a network, from the Internet to a host located in the most inner subnet of a network is limited by a 32-bits addressing scheme in IPv4 networks, and by a 64-bits addressing scheme in IPv6 networks. It means that, in practice, d is bound by those limits and is a small constant. According to study by Wool [231], networks in practice have in average (1−ξ)
7 Note that the authority equation ~ xk = ξLT L~ xk−1 + en is resolved via a vector-matrix multiplication L~ xk−1 first, resulting in a vector that is then multiplied by matrix LT , that is why it involves two vector-matrix multiplications; the same happens for hubs.
229
100
Expand Network Compile Network Compute Links Compute PageRank Compute HITS Search Attacks
0
50
Performance (sec)
150
200
CHAPTER 9. SCALABILITY OF THE MSAMS APPROACH
5000
10000
15000
20000
Number of Ambients
Figure 9.1: Performance of modules with varied number of ambients 144 firewall rules. We will study how this affects the performance of the MsAMS tool under an increasing r, up to 2200. Results are reported in Section 9.2.2. The complexity of the attack search, in the absence of credentials and with all ambients static, can be solved with O(n2 nlog(n)) using a variation of Dijkstra’s algorithm [61] for finding the shortest path between two nodes in a graph. However, the acquisition and use of credentials, and the possibility of movement increase this complexity, and evaluating it becomes not trivial. As such, we will evaluate the complexity of the MsAMS tool with scalability tests reported in the next sections. 9.2.1.1
Evaluation
We have seen that, in theory, the overall complexity of the MsAMS tool is O(n2 ), where n is the number of ambients in the network model, since none of its modules has complexity above it. In this section, we evaluate this complexity using our benchmark of tests with practical values of n, similar to other authors in the field of Attack Graphs, e.g. [155, 164]. We use the Hermite Interpolation [90]8 to plot T measured for different modules, as reported in Table 9.1 (in microseconds), against n2 . This interpolation connects given points smoothly, showing the shape of the resulting curve between, 8 Also
230
known as cspline.
9.2. SCALABILITY OF THE MSAMS TOOL 4.5e+08 n*n Compute PageRank and HITS Compute Links Search Attacks Total Computation
4e+08
Performance (microseconds)
3.5e+08
3e+08
2.5e+08
2e+08
1.5e+08
1e+08
5e+07
0 4000
6000
8000
10000 12000 Number of ambients (n)
14000
16000
18000
20000
Figure 9.2: Hermite interpolation plot of computing time T of performancedemanding modules, compared to a n2 shape curve where n is the number of ambients in this case, T and n2 . We also plot the curve n ∗ n to allow comparison with the other curves resulting from the interpolation. The plot in Figure 9.2 gives an indication that the overall performance of the MsAMS tool is quadratic, i.e. its overall performance is O(n2 ). This conclusion is based on the fact that in the plot the total computation curve is below the n ∗ n curve, following a same trend as the number of ambients grow. To further study the relationship between T and n, we use linear regression provided by the package R [48]9 . The plot in Figure 9.3 shows the linear regression fit between T and n2 (solid line); R returns coefficients showing that the equation of the resulting line is y = 0.8132x − 64440000. Hence, we see this as evidence that T is increasing linearly with n2 , and it is increasing slowly due to the slope of the line (= 0.8132). This figure also shows the linear best fit between T and n3 (dashed line). In this case the slope of the line is really small (= 0.00004), resulting in an almost horizontal line. This indicates that there is no relationship between T and n3 . Additionally, we use log-log plot as yet another method for studying the relationship between T and n, for the different modules of the MsAMS implementation. This type of plot shows the relationship between log(y) and log(x) in an 9 Package R is a software for statistical computing and graphics; all plots and empirical analysis reported in this chapter used R.
231
3.0e+08
CHAPTER 9. SCALABILITY OF THE MSAMS APPROACH
2.0e+08 1.5e+08 1.0e+08 0.0e+00
5.0e+07
Performance T (microseconds)
2.5e+08
best fit: T~n*n best fit: T~n*n*n
0e+00
1e+08
2e+08
3e+08
4e+08
Number of ambients (n)
Figure 9.3: Linear regression plot with line of best fit between time measured T and n2 and line of best fit between T and n3
equation of the form log(y) = log(a) + b ∗ log(x) that corresponds to the curve y = axb . According to the log-log plot in Figure 9.4, the benchmark data for the overall computing time T lies on the curve y = 0.4466n2.0549 . This might be an indication that T is varying in fact with n2.0549 , and not exactly with n2 and, therefore, the performance of MsAMS would be in fact slightly slower than O(n2 ). If confirmed, this distortion is probably caused by the module that computes links since the equation of its curve is y = ax2.146 . Such distortion might be explained by garbage collection (GC) in the Haskell used to compile and execute this module. Nevertheless, using parallel GC would most probably eliminate this distortion since tests (e.g., by Marlow et al. [130]) indicate that this type of GC may potentially reduce processing time by half. Parallel GC was already available in Haskell GHC 6.10.2 used to generate the benchmark, but at that time it seemed not stable enough. Interesting to note, however, that if we plot the curve n2 against n and the curve T against n, where T = 0.4466n2.0549 (curve obtained via log-log), e.g., for n[10000, 20000], we see that the former curve actually grows quicker that the latter curve. 232
15
16
17
18
Total Computation Compute Links Compute PageRank and HITS Search Attacks
13
14
Performance T (microseconds)
19
20
9.2. SCALABILITY OF THE MSAMS TOOL
8.0
8.5
9.0
9.5
Number of ambients (n)
Figure 9.4: Log-log plot for computing time T of different modules and number of ambients n
9.2.2
Time Performance with Increasing Number of Firewall Rules
The purpose of this set of tests is to analyze time performance of the modules introduced in Section 9.1, not under an increasing number of ambients, as in the previous section, but under an increasing number of firewall rules. Therefore, here we keep the number of ambients constant (equal to 8194 ambients). We use another version of the running example introduced in Chapter 7, as specified in Example 69. The firewall now protects 1024 copies of host F , and outside the firewall there are also 1024 copies of host A. This specification shows 3 firewall rules just for demonstration purposes. In fact, a number of firewall rules from 200 to 2200 was used, and firewall rules, i.e. AllowIn actions, were generated randomly allowing communication from one copy of A to one copy of F , without repetition of rules. Example 69 Specification of the network used for running the performance tests, reported in Table 9.2, here with just 3 firewall rules as a demonstration. network net net[FW|copy A A_ 1024] A[OS|s|v|AllowIn net v] v[Accept net] sv[Accept v]
233
CHAPTER 9. SCALABILITY OF THE MSAMS APPROACH Firewall Rules 200 400 600 800 1000 1200 1400 1600 1800 2000 2200
Expand
Compile
0.36 0.36 0.38 0.39 0.38 0.40 0.40 0.40 0.41 0.42 0.42
0.54 0.56 0.56 0.56 0.57 0.57 0.58 0.58 0.60 0.60 0.60
Links PageRank Times in seconds 68.16 4.83 111.91 4.80 155.11 4.78 198.32 4.79 241.96 4.84 284.86 4.82 328.53 4.73 371.73 4.83 415.44 4.77 459.45 4.85 501.88 4.78
HITS
Search
Total
10.00 9.80 9.70 9.72 9.87 10.04 10.13 10.06 10.11 10.04 9.72
4.78 4.75 4.78 4.79 4.79 4.79 4.79 4.79 4.79 4.79 4.79
88.65 132.23 175.35 218.63 262.31 305.41 349.10 392.32 436.01 480.10 522.25
Table 9.2: Performance of modules with varied number of firewall rules; 8194 ambients OS[In sv] FW[copy A F_ 1024| AllowIn A_0$s F_2$v| AllowIn A_1$s F_1$v| AllowIn A_2$s F_0$v]
Table 9.2 shows the performance data collected with an increasing number of firewall rules10 . We executed the MsAMS tool with the following input, and obtained the attack trace F 0$v.F 0$s, independent on the number of firewall rules used. • source ambient: A 0$s • target ambient: F 0$s • search type: forward-search • fitness function: hubbiest-node
Figure 9.5 shows a plot with the performance data presented in Table 9.2. It demonstrates that the only affected module under these circumstances is the computation of links, since the performance of the other modules remained constant. This was expected because more firewall rules increase the computation of links, basically for the same reason as this module is affected by an increasing number of ambients. However, once the matrix of links and the table of Accept links is generated, nothing changes in the computation of rankings and the search since the number of ambients is the same. 9.2.2.1
Evaluation
Let’s apply Hermite Interpolation again to visualize the relationship between total computing time T (in milliseconds) and increasing number of firewall rules 10 We
234
used the same command as reported in the previous section to collect execution time.
200
300
Expand Network Compile Network Compute Links Compute PageRank Compute HITS Search Attacks
0
100
Performance (sec)
400
500
9.2. SCALABILITY OF THE MSAMS TOOL
500
1000
1500
2000
Number of Firewall Rules
Figure 9.5: Performance of modules with varied number of firewall rules r using our benchmark, shown in Table 9.2. The interpolation plot, in Figure 9.6, indicates that the total computation time curve is below the curve r ∗ r. We see this as an evidence that increasing the number of firewall rules for practical values, the overall T grows with r2 . Linear regression confirms this result, as shown the plot in Figure 9.7 (page 237). The line of best fit of T in respect to the squared number of firewall rules r2 (solid line) corresponds to the equation y = 0.08581x + 147800. It means that T is increasing linearly with r2 . Compared to the behavior of T under an increasing number of ambients, as seen in the previous section, we observe that the slope of the line is even smaller (= 0.08581), indicating a slower increase. This figure also shows the linear best fit between T and n3 (dashed line). The horizontal line indicates there is no relationship between T and n3 .
9.2.3
Space Performance with Increasing Number of Ambients
Finally, in this section we analyze the behavior of the MsAMS tool in terms of percentage of memory consumed by the performance-relevant modules, under a varied number of ambients. Table 9.3 shows the memory data collected (in percentage) with an increasing number of ambients11 . 11 We logged memory consumption with the command: pidstat − pALL − r110000; this command captures a snapshot of memory used by all processes once per second. Note that there is
235
CHAPTER 9. SCALABILITY OF THE MSAMS APPROACH
5e+06 r*r Total Computation 4.5e+06 4e+06
Performance (milliseconds)
3.5e+06 3e+06 2.5e+06 2e+06 1.5e+06 1e+06 500000 0 500
1000 1500 Number of firewall rules (r)
2000
Figure 9.6: Hermite interpolation plot of total computation T , compared to a r2 shape curve where r is the number of firewall rules
Ambients 2022 4022 6022 8022 10022 12022 14022 16022 18022 20022
Links PageRank HITS Search percentage of RAM memory consumed 0.32 0.80 0.80 0.32 3.14 3.14 1.90 0.44 7.02 7.02 3.41 0.60 12.46 12.46 8.03 0.78 19.44 19.44 9.74 0.82 27.97 27.97 13.84 0.90 38.04 38.04 19.51 1.16 49.66 49.66 21.96 1.20 62.83 62.83 37.07 1.28 77.55 77.55 56.57
Table 9.3: Percentage of RAM memory consumed by each module (total RAM: 8GB)
236
3e+05
4e+05
best fit: T~r*r best fit: T~r*r*r
1e+05
2e+05
Performance T (microseconds)
5e+05
9.2. SCALABILITY OF THE MSAMS TOOL
0e+00
1e+06
2e+06
3e+06
4e+06
5e+06
Number of firewall rules (r)
Figure 9.7: Linear regression plot with line of best fit between time measured T and r2 and line of best fit between T and r3 , where r is the number of firewall rules
The plot of data presented in Table 9.3, shown in Figure 9.8, makes it evident that the computation of PageRank and HITS (their lines overlap in the plot) are the most crucial modules in terms of memory consumption. However, this was expected since, as mentioned before, the current version of those modules uses a dense representation of the matrix of links. Therefore, a significant improvement would be to change the representation of this matrix to sparse. We evaluate those modules further next. 9.2.3.1
Evaluation
The Hermite interpolation of memory consumed M (in KB) by the most demanding modules (i.e. search and PageRank or HITS) is shown in Figure 9.9. It indicates that both modules have a performance in terms of memory below the line 2 ∗ n ∗ n. Linear regression permits the refinement of this analysis. Figure 9.10 (page 239) shows the line of best fit of M for the most memory demanding modules against the squared number of ambients n2 . The fit line for the search module corresponds to the equation y = 1.034x − 22600000, and the best fit line for the other two modules (i.e. PageRank and HITS that behave a trade-off between heavy instrumentation and precision, thus, snapshots at smaller intervals tend to interfere with the performance of the module under test [86].
237
80
CHAPTER 9. SCALABILITY OF THE MSAMS APPROACH
60 40 20 0
% of Memory Consumed (total 8GB)
Compute Links Compute PageRank Compute HITS Search Attacks
5000
10000
15000
20000
Number of Ambients
Figure 9.8: Consumption of RAM memory with varied number of ambients 9e+08 2*n*n Search Attacks Compute PageRank or Compute HITS
8e+08
Memory Consumed (M) in KB
7e+08
6e+08
5e+08
4e+08
3e+08
2e+08
1e+08
0 4000
6000
8000
10000 12000 Number of ambients (n)
14000
16000
18000
20000
Figure 9.9: Hermite interpolation of memory consumed M by memory-demanding modules, compared to a 2n2 shape curve 238
9.3. SUMMARY OF SCALABILITY RESULTS
3e+08 2e+08 0e+00
1e+08
Memory consumed (M) in KB
4e+08
best fit search: M~n*n best fit PR or HITS: M~n*n best fit PR or HITS: M~n*n*n
0e+00
1e+08
2e+08
3e+08
4e+08
Number of ambients (n)
Figure 9.10: Linear regression plot with line of best fit between memory consumed M and n2 , and line of best fit between M and n3
exactly the same in terms of memory) correspond to equation y = 1.563x+85574. These lines show that M is increasing linearly with n2 although with different slopes of increase. This figure also shows the linear best fit between M and n3 (dashed line). The horizontal line indicates that M is independent of n3 . Memory consumed could be improved, as already mentioned, with a sparse representation of the matrix of links for the PageRank and HITS computation. In addition, the memory performance of the attack search module could be improved, e.g., with a more compact representation of the table of Accept links that needs to be kept in the RAM memory during the search process.
9.3 Summary of Scalability Results Along this section we have analyzed the scalability of the MsAMS proof-ofconcept tool in respect to time and space performance. We have reported experiments showing evidence that its overall time performance, with up to 20022 ambients or with up to 2200 firewall rules, is quadratic based on the benchmark used. This performance is similar to the best worst-case performance reported by the Attack Graph community. Note that to represent a network with n hosts, we need O(n) ambients. Therefore, the overall complexity of the approach in terms of hosts remains O(n2 ). 239
CHAPTER 9. SCALABILITY OF THE MSAMS APPROACH 1. Noel et at. [155] report a worst-case complexity of O(n2 ) for their most recent version of CAULDRON, turned into a commercial product, where n is the number of hosts in the network model. 2. Ou et al. [164] report a graph generation running time of O(n2 log(n)) for MulVAL, where n is the number of hosts. 3. Ingols et al. [105] assume a network with V vulnerability instances, T ports, C credentials, I interfaces (i.e. services), and R reachability groups. However, it is hard to compare our performance with theirs because they present an expected worst-case performance of O(max(V, T )RC), leaving out I in the evaluation of complexity. 4. the commercial product Skybox [196] has a complexity O(n3 ), according to [105]. In summary, results presented in this section indicate the feasibility of the tool for use in practice, since it performs on a par with the current best attack graph tools. Considering other criteria, collected in the form of requirements presented in Chapter 4, such as the ability to fully represent the topological hierarchy of a network and the ability to model and reason about credentials and authentication methods, we believe that the MsAMS approach scores better.
240
Part IV
Final Remarks
241
10
Conclusion
This thesis has introduced the MsAMS (Multi-step Attack Modelling and Simulation) solution that comprehends an (i) approach based on the theory of Mobile Ambients that applies heuristic search with ranking algorithms to find possible multi-step attacks on a modelled network, and (ii) a proof-of-concept tool that demonstrates the feasibility of the approach. This solution contributes to the field of Attack Graphs in many ways, but specially by the rich expressiveness of the formalism it uses for modelling networks and updating those models, and for finding multi-step attacks that involve credential theft. It allows network administrators to gain insights and test hypotheses on a modelled network that can be used to improve security of the real network it represents, as shown in Chapter 8. MsAMS contributes to the field of Attack Graphs, an active area of research and development. For example, very recently two prominent approaches reviewed in Chapter 2 have turned commercial: NetSPA that became GARNET[229], and CAULDRON [155]. This is an indication that Attack Graphs, although not a silver bullet for information security, raise market as well as academic interest. The research carried out, and reported in this thesis, has been driven by the following six research questions: • RQ1 Which properties and attributes of a network turn it susceptible to attacks? • RQ2 Which attackers’ objectives turn a network susceptible to attacks? Which strategies are used by attackers to achieve those objectives? • RQ3 What are possible attack steps? • RQ4 How to model a network in a simplified but realistic way? • RQ5 How can multi-step attacks be represented considering the type of steps uncovered in RQ3? • RQ6 How to find attacks in a way that serves attackers’ objectives and strategies mentioned in RQ2 and that uses the answers to questions RQ4 and RQ5? 243
CHAPTER 10. CONCLUSION They aimed to fulfil two sub-goals: understand network attacks (G1.1.1.1) and design a way to find possible network attacks (G1.1.1.2), which contribute towards achieving the overall goal of providing decision making support to improve network security (G1), as shown in the breakdown of goals reproduced next from page 7. G1 Provide decision making support to improve network security G1.1 Manage risk of possible network attacks G1.1.1 Identify possible network attacks G1.1.1.1 Understand network attacks G1.1.1.2 Design a way to find possible network attacks G1.1.2 Assess risk that possible network attacks represent G1.1.3 Treat risk of possible network attacks G1.2 Manage risk of network intrusions G1.2.1 Detect network intrusions G1.2.2 Assess risk that network intrusions represent G1.2.3 Treat risk of network intrusions We viewed the research process itself as a design problem in the sense that the output from the research questions RQ1-RQ3, related to goal G1.1.1.1, provided input to the research questions RQ4-RQ6, related to G1.1.1.2, in the form of the following requirements for the solution. These requirements were not only derived from answers to RQ1-RQ3, but also from gaps found in the literature of Attack Graphs. R1 The solution should permit full representation of the network topology. R2 The solution should permit the representation of attack dynamics and network dynamics. R3 The solution should allow for reasonable automatic estimation of asset values, useful for assignment of potential targets. R4 The solution should allow the investigation of hypotheses, via what-if scenarios. R5 The solution should provide automatic estimation of expected cost of an attack step. The thesis has been organized as follows. In Part I we reviewed related work in Chapter 2, reviewed the context of networks, attackers, and multi-step attacks, in Chapter 3, and set the requirements for the solution in Chapter 4. In Part II we investigated the NVD, in Chapter 5, and obtained the vulnerability classification later adopted by the solution, framed the solution direction as an Optimization 244
10.1. DISCUSSION Problem with the preliminary approach ELAS (Evolutionary Learning of Attack Scenarios), presented in Chapter 6, and described the MsAMS (Multi-step Attack Modelling and Simulation) approach and the methodology it follows, in Chapter 7. In Part III we validated the MsAMS approach in two aspects. In Chapter 8, we addressed (i) scalability of modelling; in this respect we discussed and exemplified reuse and copy of ambients specification, and (ii) use of the tool for finding attacks and reasoning about countermeasures; in this respect; we used examples to mimic a network administrator performing what-if analysis and checking for possible attacks before taking a decision about a security improvement reflected in the network model. Most importantly, the MsAMS allowed us to reason about credential theft and find more subtle attacks than currently possible by other approaches found in the Attack Graph community. Additionally, it also allowed to reason about outbound network reachability, another advantage compared to the same community. In Chapter 9 we validated the feasibility of the MsAMS approach via scalability tests using statistical analysis. Results indicated that the MsAMS approach is feasible since the proof-of-concept tool that implements the approach scales as good as the best attack graph tools reported in the literature. All in all, from the validation of MsAMS we learned that it is possible to reason and use the tool to get insights about possible targets, and possible attacks dealing with credentials at a high level of abstraction. Even if the model so far has no automatic input from scanning tools that report individual vulnerabilities found in the network, MsAMS can still be very useful as a way to extract knowledge from what-if analysis, and validate security improvements via cycles of changed specification and re-execution of the tool.
10.1 Discussion This section revisits the requirements detailed in Chapter 4, and listed in the previous section, against the proposed solution MsAMS. R1 The network topology should be fully represented in the attack graph. This requirement involves two aspects: the representation of relevant entities, and the representation of hierarchy of entities. Both are fulfilled by MsAMS, since we can model in abstract terms the set of entities from real networks which are relevant to represent vulnerable and non-vulnerable hosts, the topology of networks, attackers and logical groupings. This is achieved because MsAMS is based on Mobile Ambients and nesting is intrinsic to the concept of Ambients. A parallel between the entities listed in this requirement, as described in Chapter 4, and pointers to examples in which they appear in MsAMS models is provided next. 245
CHAPTER 10. CONCLUSION Real Entities • Firewalls
• Subnets, LANs, VLANs
• Hosts
• Network services
• TCP & UDP ports and protocols • Vulnerabilities • Vulnerability attributes
• Attackers • Credentials
MsAMS Models • Examples in Chapters 7 and 8 show firewalls encapsulating hosts and subnet they protect; allow and deny filtering rules take the form of AllowIn and DenyUp actions. • Example in Sections 8.2 and 8.3 show subnets encapsulating hosts; for the effect of modelling with MsAMS, there is no different between subnet, LAN and VLAN. • Examples in Chapters 7 and 8 show hosts providing services, containing e.g. vulnerabilities, exposures, credentials. • Not only server software that provides a functionality to clients is regarded as a service, but also client applications, such as browsers or login interfaces; several examples in Chapters 7 and 8. • Ports are represented by the action AllowIn on an ambient representing a host, while protocols are also ambients as shown in examples in Section 7.10.1.2. Examples in Chapters 7 and 8 show vulnerabilities as ambients encapsulated by hosts. • Access required and possible impact resulting from the exploitation are vulnerability attributes; examples in Section 7.10.1 show vulnerabilities of several types. • Explanation in Section 7.7 reveals an attacker as an ambient that moves across a network. • A credential is also an ambient; examples in Sections 7.10.2 and 8.3.
R2 The solution should permit the representation of attack and network dynamics. Attack dynamic is the progress of an attack according to a strategy (currently MsAMS only deals with the best cost-benefit strategy, refer to Section 3.3), and involving acquisition of credentials. In this thesis we have addressed attack dynamics involved in composing multiple steps until a target is reached, taking into account credential theft. The fact that MsAMS can model credential theft is a novelty in the field of Attack Graphs since none of the other attack graph approaches reviewed in Chapter 2 can do this. In fact, we have already discussed this gap in Section 4.1 on page 67; current attack graphs are only able to represent trust relationship between two hosts, and no uncertainty is involved in the process. Therefore, in MsAMS the ambient-attacker may or may not be able to acquire the needed credential, but credentials once gained can be used along an entire attack. 246
10.1. DISCUSSION In addition, this requirement, as described in Chapter 4, also mentions network dynamics such as change in firewall rules, change in network security policies, movement of assets, deployment of new assets, and patch of vulnerabilities. Network dynamics influence security, e.g., if a firewall rule changes maybe a vulnerable service not accessible for a real attacker before becomes accessible, or if a vulnerability is patched an opportunity for a real attacker to penetrate a network that was available before disappears, and so on. However, these examples are treated statically by the current version of the MsAMS tool. When changes as mentioned happen, MsAMS allows them to be incorporated to the network model in a practical way by means of changes in the capabilities and locality of ambients. In this case, a simulation (search for attacks) executed again will have those changes incorporated. So, currently in our approach network dynamics are treated as what-if hypotheses1 . A further improvement would be to allow a network model to change while a simulation is taking place. For example, instead of only the ambient-attacker be able to issue an Enter action, ambients of the network should be able to issue such action as well. Alternatively, an action from an attacker could have implications in the model of the network itself. An example could be the case where an attacker by exploiting a vulnerability in a host renders the host unavailable2 . The formalism used in MsAMS allows such dynamics, so this is not a problem, the problem is to balance the cost-benefit it would bring to the outcome of the tool. For example, what would be the benefit of modelling the dynamics of this type of vulnerability? Maybe if we consider collusion of attackers this would be an advantage. In summary, further analysis is needed to determine if the benefit of modelling network dynamics is larger than the cost it represents in terms of modelling and simulation. Another example given in this requirement, as described in Chapter 4, is the dynamics of mobile code. Again the formalism itself allows the representation of the dynamics involved by means of the replication process (that could be used for parallel composition of attack steps), and a different fitness function to implement the best-coverage attacker strategy, described in Section 3.3.3 on page 57. These dynamics are required to find the susceptibility of a network to attack involving propagation of malware via botnets and even server-side attacks that propagate to clients. However, this will remain as future work as discussed in Section 10.2. R3 The solution should allow for reasonable automatic estimation of asset values, useful for assignment of potential targets. The solution assumes that targets can be selected from connectivity-based 1 The community of Attack Graphs does not discuss this aspect, but it is seems that such changes involve updating input and re-generating the graph itself, what can be considered practical depending on the performance of the graph building process. 2 Please refer to Section 7.10.1 on page 148 for a description of this type of vulnerability, called only-A meaning only-Availability compromise.
247
CHAPTER 10. CONCLUSION asset values computed automatically, rather than from financially-based asset values computed manually. MsAMS experimented with two views of authority (or importance) scores calculated via the schemas used by HITS and PageRank algorithms. In the examples studied in Chapters 7 and 8, the highest authority scores returned by HITS matched with our intuition of targets, as ambients with higher asset value. Furthermore, although PageRank scores did not really provide insights about targets, they indicated higher priority vulnerabilities to patch or important assets to be protected such as credentials. PageRank showed results similar to hub scores from HITS, but instead of only related to entry points as pageranks, hubs also corresponded to our intuition of well connected ambients inside the network that represent low cost passages for attackers to reach targets. Nevertheless, as mentioned in Section 7.9.1 on page 141, the analysis of how inlinks and outlinks affect PageRank and HITS scores is not trivial, and has motivated many studies (e.g. [13, 216]). However, it is important to keep in mind that MsAMS does not use the score of the target selected but rather the target itself for finding attacks. MsAMS tool provides scores to support the network administrator in selecting a target manually. Therefore, one can argue that the methodology proposed in this thesis for determining which network nodes are targets has limitations in the sense that connectivity-based scores do not capture special cases such as almost isolated hosts that have high financial asset value. This represents no problem, since the tool itself is not limited in the sense that one can use other methodologies to determine target and the tool will work the same because it only requires that a target is provided, no matter how it is determined. Therefore, if financially-based asset values become available or if the network administrator wants to use qualitative methods or simply intuition to determine targets3 , MsAMS can still be used. Nevertheless, authority scores from HITS provide very interesting insights for the network administrator about targets since these scores are objective, consistent, scalable and allow comparison. R4 The solution should allow the investigation of hypotheses, via what-if scenarios All the types of hypotheses listed in this requirement, as described in Chapter 4, are possible using MsAMS, they are: – hypotheses about initial attacker location and resources, – hypotheses about exposures which disclosure credentials – hypotheses about zero-day vulnerabilities – hypotheses about vulnerabilities in custom software components with similar objective as the previous item 3 For example, in the scenario presented in Section 8.2 we set the target as part of a what-if hypothesis.
248
10.1. DISCUSSION – hypotheses related to attackers strategies like the ones identified in Chapter 3, i.e. best cost-benefit from an attack or best-coverage of a network. A current limitation of MsAMS in this respect is the availability of just one attacker strategy, namely the best cost-benefit from an attack, described in Section 3.3.2, and used in examples throughout Chapters 7, 8, and 9. Therefore, the best-coverage of a network strategy will remain as future work and is discussed in Section 10.2.1. Furthermore, the what-if resulting from the dynamics of the network, as discussed above, are also possible since all of them involve changes in locality or capabilities of existing ambients, and the specification of new ambients , they are: – change in firewall rules, e.g. expand connectivity due to new business demands – change in network security policies, e.g. restrict connectivity due to past attacks – movement of assets, e.g. due to relocation of hosts – deployment of new assets, e.g. new firewalls, new hosts or new network services Besides, MsAMS provides the possibility of extra what-if analysis related to credentials, not mentioned in the original requirement. This has been demonstrated in the example scenario in Section 8.3, and is not available in any other attack graph approach since they do not deal with credential theft. R5 The solution should provide automatic estimation of expected cost of an attack step. Cost is a metric that allows the selection among possible alternative steps during the simulation of an attack, according to an attacker strategy. Examples in Chapters 7, 8 and 9 have shown that MsAMS successfully uses scores, automatically produced by HITS (i.e. hub scores) for all ambients represented in the network model, as an indication of most promising (i.e. less costly) attack steps (for the hubbiest-node fitness function, described in Section 7.11 on page 7.11) for a potential attacker to reach targets. Hub scores are then an estimation of expected cost. Therefore, we meet this requirement completely since we provide a cost metric that scales, is objective, consistently and automatically calculated following a rationale, and is absolute allowing comparison between alternative attack steps. All other attack graphs that use metrics of cost rely either on information that cannot be automatically retrieved or rely on estimation from expert judgement. 249
CHAPTER 10. CONCLUSION
10.2 Opportunities for Future Work Along the research reported in this thesis, several opportunities for future work were identified. Some involve further research and are described in Section 10.2.1, while some involve further development of the current version of MsAMS towards a more industrial standard, described in Section 10.2.2.
10.2.1
Further Academic Research
1. Assessing risk identified In this thesis we aimed at the identification of risks of multi-step attacks in a network (G1.1.1), but have not addressed the assessment of those risks (G1.1.2). However, the usefulness of the current MsAMS would greatly improve by the estimation of the risk of each possible attack. We have already started work in this direction [102, 100, 101] using the Common Vulnerability Scoring System (CVSS) (refer to Section 5.2 on page 84 for an overview of CVSS). CVSS provides a schema of attributes, rating and rating values used to derive an unique score for each vulnerability (i.e. CVE [52]) present in the NVD [161]. We rearranged these attributes and determined dependencies among them, although keeping CVSS rating and rating values, to derive, via a BBN (Bayesian Belief Network), two scores reflecting frequency (as the chance of a vulnerability being exploited) and impact related to each vulnerability. The aggregation of estimates of impact and frequency from several vulnerabilities currently is performed by the aggregation algorithm provided by the BBN implementation used. This means that the frequency and impact estimates of a particular vulnerability become the prior distribution for the following vulnerability and so forth. This way, the risk level of an asset containing several vulnerabilities is determined. As an example dependency among attributes, we established a dependency between the potential impact on C I A4 that the vulnerability may cause with the requirements of the asset affected by the vulnerability, also in terms of C I A. Therefore, if the vulnerability causes a confidentiality impact but the asset has no confidentiality requirements, confidentiality has no effect on the impact score. Note that we considered dependencies among attributes to determine frequency and impact related to a vulnerability but no dependencies between the vulnerabilities themselves. This work could be extended to determine frequency based on the vulnerabilities used in an attack path and their impact applied to the C I A requirements of the target. 2. Other attacker strategies The more attacker strategies are provided, the more useful MsAMS becomes to the network administrator because a larger diversity of attacks 4 Confidentiality,
250
Integrity and Availability
10.2. OPPORTUNITIES FOR FUTURE WORK can be uncovered. This aspect is in the border line between research and development since, specifically for the best coverage strategy (explained in Section 3.3.3 on page 57) to find the susceptibility of the network to become a botnet, the supporting research has already been done, as reported in the mentioned section. Incorporating this strategy to MsAMS involves addressing the following: • A new fitness function to determine best candidates which maximizes botnet effectiveness, i.e. its size. It means that the largest set of candidates which comply to a certain criteria (that could be the presence of a specific type of vulnerability) would be selected at the same time. Therefore, it would be as if the ambient-attacker had initially a script that would be replicated for each candidate selected. • Currently, the stopping criterion for the search is either the number of cycles or the fact that the ambient-attacker reached the target, what comes first. In the best coverage of the network strategy, the stopping criterion would be based on the number of cycles, in the sense that the search would stop after the maximum number of nodes were recruited within the minimum number of cycles. This would indirectly minimize botnet diameter, which indicates botnet efficiency. We have also identified in Section 3.3.3 on page 57 that a typical DDoS involves two stages, i.e. an infection and a launch phases. The former fits with the best coverage strategy and the latter with the best cost-benefit strategy. Therefore, combining these two strategies is useful for anticipating the susceptibility of a modelled network to DDoS5 . Although, in principle, all the elements needed for finding this type of attack are present in MsAMS, it involves more research, e.g., in terms of the search algorithm, and in terms of ambients capabilities. Apart from the best coverage strategy to find botnet-like attacks, and the combination of best coverage and best cost-benefit strategies to find DDoSlike attacks, MsAMS has the potential to incorporate other strategies provided that they are represented in terms of metrics available and there is an objective stopping criterion. 3. Improved metrics MsAMS uses links processed from actions In and Accept, as explained in Section 7.8 on page 139. Authority scores are derived from these links via PageRank and HITS algorithms, but all links have the same weight. Intuitively, let’s think about two ambients placed in a same subnet, both accepting any ambient from the subnet. In principle6 , they would have 5 As we have seen in Chapter 6, we have been able to uncover DoS attacks from a graph using ELAS, the MsAMS predecessor approach, not using strategies but rather using an added value input, not readily available. 6 In principle because these ambients may have other capabilities.
251
CHAPTER 10. CONCLUSION similar authority scores from HITS. However, suppose the first is used occasionally and the second is used constantly. Therefore, it seems reasonable to think that the second is more authoritative than the first. Based on this rationale, Tomlin [211] has proposed TrafficRank. His ranking scheme uses the number of accesses to a webpage to assign weight to links. It would be interesting to use network traffic to annotate links and derive scores to ambients in MsAMS. Our expectation is that authority scores would become more accurate over time giving a better indication of targets. Another alternative to improve metrics would be to use another algorithm to calculate scores. Recent studies (e.g. by Najork [147]) reveals that yet another link analysis ranking algorithm, called Stochastic Approach to Link Structure Analysis (SALSA) [123], outperforms HITS. SALSA incorporates features from both HITS and PageRank and, like HITS, produces two sets of scores: authority and hubs. However, SALSA does not use mutual reinforcement between hubs and authorities as HITS does. Since it is difficult to anticipate which algorithm will adapt better to the domain of network attacks, it would be worth to experiment with how well SALSA scores performs to indicate targets and as a measure of cost of attack steps. It should be noted that the SALSA algorithm is query-dependent, and therefore it needs to be modified to generate scores for the entire set of ambients. 4. Distinction of credential ambients The current version of MsAMS makes no distinction among ambients. Therefore, all entities listed in requirement R1 are modelled the same. However, at simulation time, a distinction needs to be made between ambients representing credentials and the remaining ambients. This is required because an ambient-attacker can never “gain” a credential, i.e. it can never gain an Enter c where c represents a credential, instead credentials must be “acquired”. This is not the same for the remaining ambients. Therefore, this distinction is made via input to the search (as described in Section 7.11 on page 158) because it can be the case that a credential is not released in the network, therefore, we cannot determine which ambients are credentials automatically. A better way to deal with this distinction is to use typed ambients [36] to determine credentials at modelling time. 5. Specifics of insiders Another possible extension that would probably also benefit from a typedMsAMS is to consider elements specific to insiders that would allow finding attacks particular to this group. For example, instead of only representing entities related to authentication as we do now in terms of credentials, we would have to represent authorization as well, i.e. which subjects can perform which actions on which objects. Additionally, roles or job functions and, probably, a more refined approach to cope with social engineering methods to acquire access to objects or roles would also be required. 252
10.2. OPPORTUNITIES FOR FUTURE WORK 6. Possibility of querying network models The current version of MsAMS uses the query-independent version of HITS to calculate authority and hub scores (as presented in Section 7.9.3 on page 145). It means that scores are calculated using the whole matrix of links. However, originally HITS is query-dependent [120], therefore, first a sub-matrix is processed using the query provided by a user via a search engine, then the scores are calculated just for this sub-matrix. This functionality, in theory, seems interesting for querying large network models. For example, the network administrator may want to know what is the best cost-benefit attack from a source to a target via a specific host, or that depends on the exploitation of a specific vulnerability, or depends on the acquisition of a specific credential.
10.2.2
Further Industrial Development
1. Import of input As we have seen in Chapter 7, the current version of MsAMS relies on manual specification of ambients, although scalability of modelling is already achieved by means of duplication of ambient specification, as shown in Chapter 8. However, the ideal situation would be to have the specification populated as much as possible automatically. We have indicated in Section 7.4 on page 123 the possible sources of information for modelling, all of them are readily available, except one: the item related to authentication methods used in the network and credentials involved depend on input from the network administrator. However, the administrator has this knowledge and the level of abstraction about credentials required by MsAMS is coarse grained. Therefore, this should not be a problem specially if the visualization aspect of the tool is improved, as discussed in the next item. 2. Visualization of network and attacks The visual complexity of attack graphs is a major issue in the field of Attack Graphs. Although many researchers have addressed it in different ways, we identified significant gaps discussed in Chapter 4 that motivated requirement R1 (The solution should permit full representation of the network topology). Since MsAMS satisfied this requirement by adopting a Mobile Ambients-based formalism (as discussed in the previous section), we contributed towards reducing the overall problem. However, to completely address it and also to improve significantly the usability of MsAMS, a graphical interface is required. This interface would show ambients as illustrated in Figure 7.3, allowing zoom-in and out in the nesting of ambients (i.e. in the network locality tree) and showing the specification of each ambient upon request of the network administrator. The output, currently purely symbolic as shown in Section 7.7 on page 126, would also benefit immensely from a graphical interface showing animated attack paths. 253
CHAPTER 10. CONCLUSION 3. Improvements in scalability Although empirical tests reported in Chapter 8 have shown that the scalability of the MsAMS proof-of-concept tool is comparable to the best attack graph approaches found in the literature, they revealed areas for improvements. For example, space performance of both PageRank and HITS could improve significantly by using sparse representation of the matrix of links for calculations. Similarly, the search module could improve in terms of space and time performance with a compact representation of the table of links. In addition, the overall processing time of the tool would improve if all its modules were coded in C, and if they took advantage of parallel programming [169]. For example, (i) different search tasks (as described in Section 7.11 on page 158) could be computed in parallel, (ii) the calculation of scores could take advantage of parallel matrix-vector multiplication, and (iii) the computation of links could use a shared pool and as many parallel processes as possible taking link-processing-tasks from the pool.
254
Appendices
255
A
Formalization of the MsAMS Approach
In Chapter 7 we have introduced the syntax and informal semantics of our variant of the ambient calculus by Cardelli and Gordon [35, 36, 34], applied to the domain of multi-step network attacks. Therefore, we have introduced new operators to facilitate modelling in this domain and use a modified set of reduction rules and of structural congruence rules to search for attacks. This chapter introduces preliminary concepts in Section A.1, formalizes such reduction rules in Section A.2, and the rules of structural congruence in Section A.3. Along this appendix, we discussion differences between the original ambient calculus and the modified version used by MsAMS.
A.1 Preliminary Concepts Four concepts are essential for the formalization of the movement and communication reduction rules. These are: (i) the concept of an ambient inside another ambient (Chapter 7, Definition 22) (ii) the concept of Least Common Ancestor (lca) (Chapter 7, Definition 34) (iii) the concept of parent of an ambient (Chapter 7, Definition 19) (iv) the concept of pathTo, defined next Definition 43 (Concept of pathTo.) There is a path from ambient x to ambient y, denoted pathTo(x,y) is True, if and only if: • the path from the parent of ambient x to the lca(x, y) is not blocked, i.e. if DenyFromTo(x,parent x,lca(x,y)) = False, and • the path from the lca(x, y) to the parent of ambient y is permitted, i.e. if AllowFromTo(x,y,lca(x,y),parent y) = True, where the methods DenyFromTo and AllowFromTo are presented in Figure A.2 and A.3, respectively. Figure A.1 illustrates the scope of methods DenyFromTo and AllowFromTo in terms of a network locality tree. Thus, while DenyFromTo tests if ambient x can 257
APPENDIX A. FORMALIZATION OF THE MSAMS APPROACH move from its parent to the lca(x, y) (upwards the tree), the AllowFromTo tests if ambient x can move from the lca(x, y) until the parent of ambient y (downwards the tree). lca(x,y)
method
AllowFromTo
method
DenyFromTo
y
x
Figure A.1: Scope of methods DenyFromTo and AllowFromTo used to test if there is a pathTo from ambient x to ambient y
% The method DenyFromTo returns True if ambient x cannot move from % inside ’from’ until inside ’to’ DenyFromTo(x,from,to) CASE from = to % ambient x reached ’to’ without any deny return False CASE exist action (DenyUp n) belonging to actions of ’from’ and x is inside n % x could not exit ’from’ return True ELSE % x could exit ’from’, let’s see if x can exit the parent of ’from’ DenyFromTo(x,parent ’from’,’to’)
Figure A.2: Simplified pseudocode of the DenyFromTo method
A.2 The MsAMS Reduction Rules This section presents reduction rules that actually result in movement (Section A.2.1), communication (Section A.2.2), and resource-acquisition (Section A.2.3). A reduction rule P → Q describes the evolution of process P into a new process Q [35]. 258
A.2. THE MSAMS REDUCTION RULES % % % %
The method AllowFromTo returns True if ambient x can move from inside ’from’ until inside ’to’ which contains ambient y. The allowed entry inside ambient y requires an Accept x or an Accept n, where x is inside n
AllowFromTo(x,y,from,to) CASE from = to % x was allowed to reach ’to’ return True CASE exist action (AllowIn n y) belonging to actions of ’to’ and x is inside n % x could enter ’to’, let’s see if x can enter the parent of ’to’ AllowFromTo(x,y,’from’,parent ’to’) ELSE % x could not penetrate ’to’ return False
Figure A.3: Simplified pseudocode of the AllowFromTo method
A.2.1
Reduction which handles ambients movement
MsAMS only allows inter-ambient movements. When an ambient moves, all its processes move with it. Note that in the original ambient calculus [35], it is possible to have a process not contained within an ambient, while in MsAMS a process is always contained within an ambient. Reduction 1 Reduction between Enter and Accept. This reduction only happens if ambient x is inside ambient n and pathT o(x, y) is True: x[Enter y.ActRulex | Px ] | y[Accept n.ActRuley | Py ] → y[x[ActRulex | Px ] | ActRuley | Py ] As mentioned in Chapter 7, our action Enter is equivalent to Cardelli’s primitive in [35]. However, movement in the original ambient calculus is asynchronous; as explained by Cardelli “An entry capability, in m, can be used in the action in m.P, which instructs the ambient surrounding in m.P to enter a sibling ambient named m”. Therefore, movement is unilateral and depends only on the initiative of the ambient willing to move, so called active ambients [35]; the reduction happens with any sibling, if more than one m sibling exists. This behavior can raise anomalies, called interferences by Levi and Sangiorgi [124]. For example, in the original ambient calculus, the result of n[in m.P ]|m[Q]|m[R] can be either m[Q|n[P ]]|m[R] or m[Q]|m[R|n[P ]]. In this case, process P can perform the same interaction with two different parties. Furthermore, more serious anomalies can also happen in the original ambient calculus, e.g., the result of h[n[in m.P |out h.R]|m[Q]] can be either n[P |R]|h[m[Q]] or h[m[Q|n[P |R]]], 259
APPENDIX A. FORMALIZATION OF THE MSAMS APPROACH what means that ambient n can end up outside ambient h or inside a child of h, ambient m. To avoid these anomalies Levi and Sangiorgi [124] propose the Mobile Safe Ambient (SA) where movement capabilities such as in (enter) needs a counterpart in (allow enter) to reduce. We take the SA approach to movements in MsAMS. Movement is synchronous in MsAMS and requires bilateral agreement between the ambient willing to move and the ambient willing to accept the movement to happen. However, the movement will only succeed, and therefore reduce, if there are no ambient along the path which block the movement (through DenyUp actions). The exit of ambients involved in our reduction enter-accept is implicit, i.e. permitted by default. Thus, there is no explicit equivalent to the capability exit from the ambient calculus in MsAMS, as well as no equivalent to capability open. The action open is used in the original calculus to dissolve an ambient perimeter, revealing its contents to its parent ambient. However, it may cause security problems, as discussed by Buglisi et al. [29], which proposed the Boxed Ambients where the open is dropped. Furthermore, open is used in MA to allow intra-ambient communication between processes. Therefore, to avoid anomalies and, since communication in MsAMS is inter-ambients, we also do not have the capability open. An advantage of synchronous movement is that the name of an ambient is not so important as it happens in Mobile Ambients (MA). In MA, ambients’ names should “be guarded very closely” [35] because knowing or revealing an ambient name is enough to allow entering this ambient. Therefore, an ambient name represents a permission on itself, what is not true in MsAMS where permission (in the form of an Accept) is explicit.
A.2.2
Reduction which handles ambients communication
MsAMS allows inter-ambients communication, regulated by the following reduction rule.
Reduction 2 Reduction between In and Out. This reduction only happens if ambients x is inside ambient n and pathT o(x, y) is True: x[Out y.ActRulex | Px ] | y[In n.ActRuley | Py ] → x[ActRulex | Px ] | y[ActRuley | Py ]
In the original ambient calculus [35], communication happens in terms of input (x).P , where variable x can be instantiated with names (e.g an ambient name m) or capabilities (e.g. in m), and in terms of output < M >. Communication is asynchronous, channel-based and “works locally within a single ambient” [35]. An output releases a message M representing a capability within an ambient 260
A.3. THE MSAMS STRUCTURAL CONGRUENCE RULES and, if a binding occurs between this capability M and any input variable x (e.g. ambient names or capabilities), then there is a reduction. As a result of the reduction we have P x ← M , meaning that all possible x in P are replaced by M . Therefore, in MA, it is assumed that asynchronous communication works only locally and that non-local communication is restricted by capabilities [33]. In MsAMS, input/output is not channel-based and abstracts from content exchange, hence, it is less powerful than in ambient calculus. Communication is only a way to synchronize information, inspired by input/output as in Milner’s CCS [140] and Hoare’s CSP [95]. Therefore, communication is synchronous, i.e. depends on agreement between the parties involved, and inter-ambients instead of intraambient; two ambients willing to communicate, can only do so if there is a pathTo from the source ambient to the destination ambient, e.g., if there is no firewall blocking their communication.
A.2.3
Reduction which handles ambients resource-acquisition
Resource-acquisition in MsAMS, such as for the acquisition of credentials, is regulated by the following reduction rule.
Reduction 3 Reduction between AcquireCred and ReleaseCred. In this reduction, c is an ambient that represents a credential: x[AcquireCred.ActRulex | Px ] | y[ReleaseCred c.ActRuley | Py ] → x[ActRulex | Replicate(Enter c) | Px ] | y[ActRuley | Py ] To acquire a credential c, an ambient x has to enter an ambient y, which releases credentials in the form of actions ReleaseCred c1 , ..., ReleaseCred cn , and issue an action AcquireCred. A non-deterministic match between AcquireCred and ReleaseCred ci results in ambient x acquiring the capability of entering ambient ci , i.e, x acquires Enter ci . In the original ambient calculus [35], Cardelli and Gordon consider acquire n.P as equivalent to open n.P , and releasen.P as equivalent to n[]|P . Therefore, theirs acquire has the problems of the open, mentioned in Section A.2.1.
A.3 The MsAMS Structural Congruence Rules The structural congruence rules defining equivalence relations (denoted by ≡) allowed by the MsAMS syntax are listed next. 1. Replication. x[Replicate(Px )] ≡ x[Px | Replicate(Px )] 261
APPENDIX A. FORMALIZATION OF THE MSAMS APPROACH Replication in MsAMS is a way to represent iteration and recursion, such as in ambient calculus [33]. In the original calculus a replicate !P produces “as many parallel replicas of P as needed” [33]; therefore replication in ambient calculus is unbound. In MsAMS, replication of a process Px produces only one replica of Px , where Px complies with Definition 16. Note that since parallel composition only appears within an ambient, as mentioned in Chapter 7, constructs like !(P |Q) possible in the original MA do not happen in MsAMS. 2. Permutation. x[Px ] ≡ x[π(Px )], where: π(Px ) is a permutation of Px For example, this permutation rule makes it possible to apply the Enter/Accept reduction as below: x[z|u|w|Enter y] | y[a|Accept n|b|c|d] → y[a|b|c|d|x[z|u|w]] In this case, the permutations π(Px ) and π(Py ) guarantee that the Enter and the Accept will be placed at the beginning of each of these ambients’ process list, therefore, potentially allowing a reduction as described in Section A.2.1. Implicit to the structural permutation is the structural commutativity, also present in the original ambient calculus, that guarantees: x[ActRulex1 .ActRulex2 | Px ] ≡ x[ActRulex2 .ActRulex1 | Px ]
262
B
Gathering Defense Requirements using Attack Trees 1
This chapter discusses how Attack Trees, reviewed in Section 2.2.2 on page 23, can be applied to raise awareness about possible attacks from insiders. We illustrate their use by proposing a method to facilitate the elicitation of goal-based (security) requirements for the defense against insiders. Each tree contains a brainstorming of means to achieve the following sub-goals:“Pre-attack”, “Gain access”, “Abuse access” and “Abuse permission”. Such sub-goals represent in fact high-level steps, and a sequence of those steps represent a multi-step attack which can be performed by an insider to compromise an asset. Traversing each tree from leaf to root provides a plan of actions for the attacker, which the defender wants to anticipate to proactively identify gaps in defense. Hence, as defined in Chapter 2, those attack trees are viewed as attack strategies and their possible countermeasures as defense strategies. Insider threat is becoming comparable to outsider threat in frequency of security events. This is a worrying situation, since insider attacks have a high probability of success because insiders have authorized access (i.e. they are allowed to get in the network) and legitimate privileges (i.e. they are allowed to perform actions while in the network). Despite their importance, insider threats are still not properly addressed by organizations, and remains a challenge. We contribute to reverse this situation by introducing, in this chapter, a framework composed of a method for identification and assessment of potential insider attacks and of two supporting deliverables for awareness of insider threat. The deliverables are: (i) attack strategies structured in four attack trees, and (ii) a matrix which correlates defense strategies, attack strategies and control principles.
1 An early version of this chapter has been published at EMMSAD´ 07 [75], itself derived from a technical report [74].
263
APPENDIX B. GATHERING DEFENSE REQUIREMENTS USING ATTACK TREES
B.1 Introduction According to recent surveys [205, 85] and reports from studies [114, 171] carried out by the U.S. Secret Services and the CERT (http://www.cert.org/insider_ threat/), insiders are responsible for major financial losses, damages and disruptions to organizations. Worse, incidents2 originated from insiders are tending to rise and to become comparable in frequency to incidents originated by outsiders. We consider an insider, as defined by Bishop [20], as “a trusted entity that is given the power to violate one or more rules in a given security policy... the insider threat occurs when a trusted entity abuses that power”. The CERT categorizes insider crime in three major groups: fraud, theft of information and IT sabotage. The first one occurs when someone obtains unjustifiable services or property from the organization. The second one occurs when someone steals confidential or proprietary information from the organization. The third one occurs when someone harms, in any sense, the organization or individual(s) within the organization. CERT found that: (i) there is no conclusive evidence that a general profile of insiders exists, and (ii) in more than half of the cases studied, insiders exploited vulnerabilities in applications, processes and procedures/policies, not necessarily known by outsiders. Thus, insiders do not only take advantage of technical expertise but they also take advantage of details specific to the organization and of social engineering in an environment based on trust. Additionally, insiders tend to have more opportunities, when compared to outsiders, caused e.g. by the deterioration of access and permission management which may cause accumulation of privileges. In summary, the combination of power, trust and knowledge turn insiders particularly dangerous and, as a consequence, their malicious actions have high probability to be successful and to remain undetected. Therefore, the insiders problem is even more complex than the outsiders problem because it may involve multiple steps not only at the network level but also at the application level [179], related to subtle violations of control principles. To reduce the insider problem, many challenges have yet to be overcome. One challenge is the identification and assessment of risk that insiders represent to an organization proactively. Risk management frameworks (e.g. OCTAVE [1] and NIST SP 800-30 [202]) are not focused on particularities of insiders, and the wide spectrum of insiders goals may turn low-level approaches using, e.g., misuse cases [195] and defense trees [21] unusable. Yet another challenge is the lack of tool support for the identification and assessment of those risks. Commercial products have approached the risk of insider incidents mainly from the perspective of anomaly-based detection (e.g. LogRhythm (www.logrythm.com), ArcSight (www.arcsight.com), and IBM IRIS [6] (Identity Risk and Investigation Solution). Therefore, they alert on suspicious behavior of users or even known patterns of insider misuse (e.g. off-hours access to data and encrypted file uploads) taking into account context information and prior or peer behaviors. Although very useful, their assumption that insider malicious activity always in2 Remember
264
from Chapter 2 that incidents are successful attacks.
B.2. A FRAMEWORK FOR GATHERING DEFENSE REQUIREMENTS volve visible behavior change may be very effective for the detection of fraud, but there is a lot more to the insider problem not covered by such approach. The contribution of this chapter is a framework that addresses the first challenge mentioned above. It consists of a method for identification and assessment of insiders attacks (i.e. attacker strategies), and of two deliverables. We assess potential attacks and identify the risk level of an asset indirectly via its defense level. Therefore, from identified threats and vulnerabilities (treated together) we derive potential attacks, from which we derive defense level and then risk level, which allows prioritization of security requirements for defense against insiders. The deliverables are: (i) insider attack strategies structured in four (high level) attack trees (reviewed in Chapter 2), and (ii) a matrix that relates control principles to attack and defense strategies. The purpose of these two deliverables is to increase awareness about the insider problem in general for a more efficient and effective application of the method in an organizational context. They take the perspective of control principles, which are exploited by attack strategies and enforced by defense strategies. This perspective enables us to look at the insider problem as a whole and gather requirements against all insiders categories, i.e. fraud, theft of information and IT sabotage. This chapter is organized as follows. Section B.2 briefly (i) introduces the notion of control principles, (ii) organizes insiders attack strategies in four attack trees, (iii) presents a matrix for matching defense strategies, attack strategies and control principles, and (iv) introduces the actual method, core of the framework. Section B.3 describes an example application of the framework. In Section B.4 the framework is discussed, in Sections B.5 related work is reviewed, and finally, in Section B.6, we conclude and point to future work.
B.2 A framework for gathering defense requirements The proposed framework is composed of a method and of supporting deliverables. Its goal is to help organizations to identify requirements that enable defense against insiders. As shown in Figure B.1, control principles are our starting point and this choice is twofold. First, insiders exploit vulnerabilities which can be achieved by exploiting control principles. Second, control principles provide mechanisms for organizations to prevent and detect insiders activities. Thus, control principles are, on the one hand, exploited by attack strategies, due to flaws or weaknesses in processes, applications, infrastructure, etc, and, on the other hand, enforced by defense strategies to assure a certain level of security. Cobit [109] defines controls as “the policies, procedures, practices and organizational structures designed to provide reasonable assurance that business objectives will be achieved and undesired events will be prevented or detected and corrected.” Although each organization implements specific controls according to their goal(s)/business mission they are based on common control principles which apply to any organization. 265
APPENDIX B. GATHERING DEFENSE REQUIREMENTS USING ATTACK TREES
Past insider cases
Control Principles exploited by
Available defenses enforced by insights
insights
Attack Strategies
Defense Strategies
supports
supports
Method for gathering requirements for defense against insider
Framework
Figure B.1: Framework composed by a method and supporting attack and defense strategies
A taxonomy of control principles related to IT, composed from the literature [182, 46, 110, 28], is presented next. 1. Separation of Duty (SoD): from [110] ”[SoD aims to ensure that] no employee or group should be in a position both to perpetrate and to conceal errors or fraud in the normal course of their duties”. This principle can be enforced in a static way, by not permitting one person to assume incompatible functions/permissions (i.e. exclusive roles), and in a dynamic way, by not permitting the activation of exclusive roles in the same session. Dynamic SoD can come in three flavors: (i) object SoD - same person prohibited to perform critical operations on a same object, (ii) operation SoD - same person prohibited to perform critical functions in a workflow, and (iii) history SoD - same person prohibited to perform all his authorizations on the same object over time. This principle can be difficult to achieve in small organizations. In this case, other principles [47] like reconciliation, review, audit and supervision can be used. 2. Dual Control (also called Two-Person Rule or Four-eye Principle): this principle aims to make sure that sensitive tasks require two individuals, usually with identical roles and hierarchical position, to perform. 3. Delegation and Revocation: delegation refers to a change in the assignment of authorization from one person to another. Revocation cancels delegation. 4. Supervision, Review and Audit: supervision [183] aims to make sure that subordinates execute assigned obligations. Review aims to control the execution of delegated obligations. Audit aims to allow tracing and analysis of events collected in audit logs. 266
B.2. A FRAMEWORK FOR GATHERING DEFENSE REQUIREMENTS 5. Accountability: refer to Section 2.1 on page 15. 6. Least Privilege and Need-to-know: least privilege aims to ensure that individuals are only assigned to the minimum set of privileges needed to perform their duties. Need-to-know is a special case of least privilege used on military environments. It rely on labels for individuals and objects to restrict access to information. 7. Non-repudiation: refer to Section 2.1 on page 15. 8. Reconciliation: control based on totals, balancing sheets, i.e. on crossinformation checking. 9. Classification of Assets: classification of assets ensures C-I-A via levels of security depending on the protection required. It is prescribed by security standards like ISO 27002 [107] as a means to maintain control over assets. It is important to have in mind that humans are also assets and thus the classification of users in roles, clearance levels or groups is also instrument of control.
B.2.1
Supporting deliverable: attack strategies organized in attack trees
We structure attack strategies usually exploited by insiders in four attack trees. The tree “Pre-attack”, shown in Figure B.2, contains alternatives to achieve the goal of preparing for an attack. It shows get password and social engineering as two of the possible means of achieving such goal; each one is further decomposed into means to achieve them, and so on. The tree “Gain access” is illustrated in Figure B.3, the tree “Abuse access” in Figure B.4, and the tree “Abuse permission” in Figure B.5. These trees have been derived from possible exploitations of control principles (listed in the previous section) and from past insider cases documented in the literature [89, 114, 171, 24]. From the latter we acknowledge insights about possible exploitations on applications, infrastructure and organizational structure. Although these trees cannot be considered as exhaustive, they provide a solid basis for out-of-the-box reasoning about insiders strategies. As discussed in Section 2.2.2 on page 23, attack trees provide an structured top-down way to brainstorm means to achieve a goal, represented by the root of the tree. Since all trees in this chapter have only OR relations, achieving any sub-goal represented by child nodes, brings an attacker closer to achieve the parent goal, represented by their parent node. A path from a leave to the root of the tree represents multi-steps to achieve the goal which may not be enough to launch an attack. For example, pre-attack steps need to be followed by other steps to allow an insider to gain access to a specific asset, addressed by another tree. The aim of such trees is the exploration of broadness, instead of deepness. Hence, the main idea of these trees is to provide a wide spectrum of strategies 267
APPENDIX B. GATHERING DEFENSE REQUIREMENTS USING ATTACK TREES
Pre-attack
1
2
social engineering
get password
6
7
social engineering 12
13
convince the sharing of passwords
8
steal password
14
abuse of authority to get password
4
get physical possession of backups
build up relationship to get info
9
use unclosed browser for pw protected url(s) 15
shoulder surfing
3
10
use pw cracking software
11
replace password
16
use brute-force methods
5
17
exploit weak hash alg. for encrypted pw
use pw guessing strategies
20
Infiltrate to the organization
use pw sniffing methods 18
19
use keyboard stroke hw/ sw
search for pw (e.g. e-mails, post-it, etc)
21
use default passwords
guess obvious passwords
Figure B.2: Tree structure of attack strategies involved with “Pre-attack”
Gain access
1
use own legitimate account
2
3
advantage of unlocked machines
exploit account management deficiencies
4
7
5
exploit vulnerability on applications 8
gain physical access to machines
6
social engineering 9
gain privileged access
10
11
use access paths known by organization
use access paths unknown by organization
gain physical access to a machine
12
13
14
15
use still valid but not in use accounts
use accounts not disabled on job termination
use shared password with someone else
use backdoor accounts
16
on different OS, systems, applications
use password obtained on pre-attack
17
remote access to shared accounts
Figure B.3: Tree structure for attack strategies involved with “Gain access”
268
B.2. A FRAMEWORK FOR GATHERING DEFENSE REQUIREMENTS
Abuse access
1
2
3
create backdoor accounts
reconnaissance
4
exploit attempts w/ wrong pw
compromise data
5
6
Install / insert/ execute malicious code
abuse permission (separate tree)
8
9
13
modify/delete configuration files 15
discover vulnerabilities specific to org.
16
learn info like accounts not in use but active
19
insert trap doors in applications
11
use portable devices to copy/record
take away info upon job termination
14
modify/delete critical data
17
browse documents
disclose confidential information 10
use wireless connection to transmit info
lock admin accounts
12
7
modify/delete log files
18
search for publicly known vulnerabilities
20
deploy password cracking sw
21
deploy logic/ time bombs
22
deploy hackers’ toolkits
23
24
deploy keyboard stroke hw & sw
deploy Trojan Horses, etc
Figure B.4: Tree structure for attack strategies involved with “Abuse access”
used by insiders to launch attacks instead of providing a step-by-step breakdown of a specific attack from an attacker goal. Each of these trees can be viewed as a high-level step that can be composed, in several ways, by insiders to launch attacks. The statechart in Figure B.6 illustrates those possibilities. We can see in the figure that, from the initial state, an insider may or not need to perform pre-attack activities, e.g., related to the acquisition of a password or information not already in her possession. The next stage, gain access, involves basically using access the insider holds for the normal course of her duties or gain an additional form of access. It can be followed by activities related to abuse of access and/or abuse of permissions.
B.2.2
Supporting deliverable: a matrix of attack versus defense strategies
We present, in this section, a list of defense strategies derived from (i) the analysis of attack strategies which can be exploited by insiders, as discussed in Section B.2.1, (ii) the taxonomy of control principles provided in Section B.2, and (iii) a literature review [89, 114, 171, 24, 32]. The defense strategies are organized in three lists, the first corresponds to the attack strategy trees “Pre-attack” and “Gain access”, the second corresponds to the tree “Abuse access” and the third corresponds to the tree “Abuse permission”. These defense strategies have been composed with the same objective of broadness instead of deepness as we did for 269
APPENDIX B. GATHERING DEFENSE REQUIREMENTS USING ATTACK TREES
Abuse permission
6
1
2
3
exploit least privilege breaches
use of shared passwords
benefit from lack of twoperson rule
8
7
exploit asset management deficiencies
14
15
16
exploit delegation
exploit delegation/ revocation
bypass static SoD
bypass objectbased SoD
18
21
22
via delegation
change of job functions not reflected
17
at the functional level
at the business process level
19
via conflicts among roles
27
26
abuse hold of secret details e.g. admin pw
bypass static SoD
accumulate privileges
via role management deficiencies
abuse privileged access
12
bypass users classification
13
20
5
abuse separation of duties
9
abuse lack of sharing e.g. to sign checks
abuse role permissions
11
10
bypass objects classification
4
conflicts on direct role assignment
23
24
abuse overlap request/grant
abuse conflicting concerns/goals
25
abuse custody of assets
28
29
30
31
conflicts on role hierarchy assignment
abuse overlap execution/ supervision
abuse overlap authorization/ approval
abuse overlap recording/ reporting
Figure B.5: Attack strategies involved with “Abuse permission” the attack strategies. They will be useful as a reference when eliciting requirements for the defense against insider risks, in step 5 (see Section B.2.3.5) of the method. Defense strategies against Pre-attack and Gain access attack strategies: 1. review all access paths to assets periodically to ensure actual paths match expected paths 2. ensure that only access paths needed for an individual’s job function are activated 3. ensure the deactivation of all paths available for an individual upon job termination 4. enforce tight password management: (i) adopt strong password, (ii) change passwords periodically, and (iii) check periodically all information systems administration passwords to identify out-of-box unchanged passwords 5. enforce strong authentication 6. ensure security patches are applied in a regular basis on every node of the inner network area 270
B.2. A FRAMEWORK FOR GATHERING DEFENSE REQUIREMENTS
Pre−Attack
Gain Access
Abuse Access
Abuse Permission
Figure B.6: Attack trees as states and possible transitions between them. 7. support security policies by education, i.e. organization-wide security awareness and training initiatives for potential insiders 8. watch for behavioral precursors like disruption, dissatisfaction, level of expectations Defense strategies against Abuse access attack strategies: 1. adopt inventory and configuration management to audit whether hardware and software installed in desktops and servers comply with what is expected 2. use periodical data integrity checks on critical information 3. enforce physical measures for access to information 4. inspect code (e.g. via peer review) with the specific purpose of identifying trap doors (from CWE3 “a feature intentionally placed in a program that facilitates remote debugging or system maintenance which can compromise the security of an application”), buffer overflows (from CWE “this condition exists when a program attempts to put more data in a buffer than it can hold”; it permits unauthorized access to memory area adjacent to the allocated buffer), logic/time bombs, validation errors, error handling failure, etc, left by developers intentionally or not 3 Common
Weakness Enumeration, refer to Chapter 5.
271
APPENDIX B. GATHERING DEFENSE REQUIREMENTS USING ATTACK TREES 5. ensure audit data cannot be modified by anyone in the organization 6. analyze audit logs to track critical transactions and to track access, modification and deletion of critical information Defense strategies against Abuse permission attack strategies: 1. review objects classification periodically 2. check periodically expected users permissions, based on job function, and actual permissions, based on actions performed. However, individuals usually perform several roles within his/her job function. Thus, the set of expected permissions for an individual is the sum of all permissions acquired through (i) direct role assignment, (ii) indirect role assignment, i.e. role hierarchy, (iii) delegation, i.e. temporary permissions, and (iv) role management deficiencies, for example, an employee has been promoted to another function and his/her previous roles have not been disabled. Two controls are important. First, if the set of all actual permissions an individual has exceeds the expected permissions the organization defined for the job function. Second, if the set of permissions violates separation of duties, in this case a detailed analysis of critical assets and processes dealt by this individual is necessary 3. check if delegated permissions conflict with permissions an individual had at the time of delegation; in this case, static separation of duties are violated 4. check delegations followed by revocations; this scenario can be exploited to overcome object separation of duties [183]. A same object can be accessed by two exclusive roles, assuming delegation causes a temporary loss of the delegated permissions, which is then reacquired by revocation. Because this violation is dynamic, it can only be detected by the analysis of audit logs 5. review periodically execution of tasks which require two peers for completion 6. ensure that critical data, such as passwords to critical assets, are not exclusively handled by an uniquely privileged individual 7. review separation of duties at the functional level; a matrix with job functions both on columns and lines and a cross on conflicting intersections can help identifying SoD among job functions 8. review separation of duties at the process level through auditing. However, it is pre-requisite to have strong role management because, otherwise, even if the separation of operations is checked, it can happen that two critical operations are logged as being performed by different roles but, in practice, the same individual executed both. Critical operations can also span several applications and in this case a cross-application audit is necessary, and a manual mapping between roles from these applications is a pre-requisite for detecting violations of SoD 272
CONTROL PRINCIPLES AT INTERSECTIONS SD: Separation of Duties DC: Dual Control D/R: Delegation/Revocation AU: Audit CC: aCCountability LP: Least Privilege NR: Non-Repudiation RC: ReConciliation CL: CLassification of Assets X: other forms of control DEFENSE STRATEGIES
AT TA C K ST G R AT G et a A- n EG 6) d IE an us S d es So us om (P ci e of eb A- al 2 en sh o d & gi ar y e G ne ed ls A- e pa e’s 5) rin g ss pa U f w ss o se rp or w ow d or re (A d -a n P- (P tta le 2) Agi ck t 1 im Ta a & nd at ke e to ad ac ga va ce in nt ss ac ag (G ce Ex e Aof ss pl 1) oi un ta lo cc ck ou ed nt m Ex m ac an hi pl ne oi ag tv em (G ul Aen ne 2) t r ab de R ec ilit f i c on ie ie s nc na on ie is s sa ap (G nc pl Ai e c C at 3) (A re io Aat ns e 1) (G ba Ack 4) do or C om ac co pr om un ts is e (A da Ex Ata (A pl 2) (A A oit
B.2. A FRAMEWORK FOR GATHERING DEFENSE REQUIREMENTS
Review periodically actual access paths against expected paths Ensure only paths needed for job function are activated for an individual
AU RC LP
AU RC LP
AU RC LP AU RC NR
LP
Ensure deactivation of paths upon job termination Enforce tight password management: (i) strong password, (ii) periodic changes, (iii) none out-of-box passwords Enforce strong authentication
AU
AU NR
AU
AU NR
AU RC LP AU RC LP
AU LP
AU LP
AU LP
AU LP
AU RC LP
AU
AU NR
AU
Table B.1: Extract from which correlates attack strategies, defense AU Ensure security patchesa arematrix applied as soon as RC after they are available strategies andpossible control principles (PA: Pre-attack, GA: Gain access; AA: Abuse NR Support security policies by education, i.e. access, AP: Abuse privilege) X X awareness and training Watch for individual behavioral changes like disruption and dissatisfaction
X
9. ensure non-repudiation of privileged actions: (i) set formal mechanisms for Review periodically hardware inventory and software configuration requesting services to administrators and establish a link between requests and actions performed by administrators can be checked via auditing; (ii) a Check data integrity on critical information AU profile of actions expected to be performed to resolve most common types X Enforcefor physical measures for access to information of requests administrators can be created to allow matching between expectedInspect andcodeactual actions to identify trap doors, buffer overflow conditions, suspicious calls, validation errors, etc
X
X
RC
X
X
Now, we match control principles, attack strategies, and defense strategies in AU Ensure audit data cannot be modified by anyone a matrix, as shown in Table B.1. Review assets classification and role structure AU This tableperiodically shows an extract (the full matrix has 15 columns and 17 rows [74]) AU LP LP of such a matrix, where (i) the horizontal axis contains aAU list of defense strateReview periodically actual users permissions against RC expected usersaxis permissions gies, (ii) the vertical contains the first level of nodes from the attack trees LP, D/R Ensurerefers that critical to operations, transactions and data (where e.g. PA “Pre-attack”, GA to “Gain access” and so on), and are not handled by an unique individual (iii) the intersections provide insights on which control principles enforces the AU AU Enforce management of privileged actions the attack strategy. Defense strategies, dedefense strategy and protects against NR NR rived from the literature [114, 171, 24] and from control principles, have been composed with the same objective of broadness instead of deepness as we did for the attack strategies. This matrix is an example and needs to be customized by organizations according to the controls they use. Furthermore, it can be refined to a more concrete level by replacing a control by tools, policies and procedures that implement that control. If kept up-to-date, this matrix can provide insights about weaknesses in controls applied to some defenses against attack strategies. Thus, the matrix is useful when deriving requirements for the defense against insiders. The next problem is which of all possible defense strategies should actually be chosen by an organization to mitigate identified attack strategies. We 273
X
AU
APPENDIX B. GATHERING DEFENSE REQUIREMENTS USING ATTACK TREES
Organization goal(s)/ business Set of assets/ processes mission
List of critical assets/processes
Identify critical assets and processes
One critical asset/process selected
Select one critical asset or process
Step 1
Organization Attack architecture strategies from trees
Identify potential attacks related to insider threat
Step 2
List of goal-based defense requirements for the asset/process to be elicited
Prioritized list of potential attacks Based on risk level Defense strategies
Select defense strategies against potential attacks with high risk level
Step 3
Asset/process defenses In place
List of potential attacks identified for the asset/process
Matrix of attack versus defense strategies
Assess risk level of each potential attack from defense level
Step 5
Step 4
Figure B.7: Method for gathering requirements for defense against insiders
present a method for deciding this in the next section.
B.2.3
Method for gathering defense requirements
The method, shown in IDEF0 notation in Figure B.7, consists of 5 steps. The boxes represent steps of the method. Horizontal arrows coming into the boxes are inputs which are transformed by the steps into outputs and vertical arrows are inputs not transformed by the steps. Outputs are represented by horizontal arrows coming out of the boxes.
B.2.3.1
Step 1: Identify critical assets and processes
The main goal of the first step is to narrow the scope of the investigation about insider threat to the core business of the organization by identifying critical assets and processes. Critical assets may include data, information systems and services as well as processes concentrated on one application or spanning several applications. Two elements are input for this step: (i) the organization goal(s)/business mission, and (ii) the set of all assets and processes of the organization. We do not prescribe any method for determining the criticality of assets but Critical Impact Factors [203], e.g., may be used to determine critical assets while keeping a straight alignment with the organization goal(s)/business mission. The list of critical assets and processes should be a consensus among stakeholders. Output: list of critical assets/processes 274
B.2. A FRAMEWORK FOR GATHERING DEFENSE REQUIREMENTS B.2.3.2
Step 2: Select one critical asset/process
From the previous step we acquire knowledge about the organization main targets of control. The goal of the second step is to narrow the scope of the insider threat investigation even further by prioritizing the critical assets/processes. The advantage of doing this is two-fold. The first advantage follows the known Divide and Conquer strategy. It helps providing a short-term estimation for the number of identification/assessment sessions and a longer-term estimation for the number of iterations necessary to cover the whole set of critical assets/processes. The second advantage is the re-use of defense requirements among critical assets/processes. No specific method for prioritization, allowing selection of one critical asset/process, is prescribed. It remains up to the organization to decide which criteria to use for the selection. Output: one critical asset/process selected B.2.3.3
Step 3: Identify potential attacks related to insiders
The previous step provides an unique focus for the remaining three steps. The objective of step 3 is to identify potential attacks which turn the critical asset/process vulnerable to insider threat. We divide this step in two stages. In the first stage, a representative of security is nominated the champion. This person will use system architecture diagrams, options of insider attacks illustrated in Figure B.6, and the attack strategy trees (discussed in Section B.2.1) to list risks he believes are relevant for the critical asset/process. In the second stage, stakeholders will get together to discuss potential attacks represented by insiders and it will be more effective if they have spent some time to build a short list of the top options in their view, using the attack strategy trees as reference. The session(s), conducted by the champion, aims to get agreement about the potential attacks. As discussed in Chapter 3, the attack strategy trees can be used either to identify single-step attacks or multi-steps attacks, according to combinations illustrated in Figure B.6. As an example of the former case, stakeholders can think about “accumulate privileges” (Abuse permission tree - node 14) as a risk to a loan process. As an example of the latter case, stakeholders can think about the attack steps “use legitimate access (developer), insert trap door in application” (Gain access tree - node 1, Abuse access tree - node 19) and then “exploit vulnerability on application , modify/delete critical data” (Gain access tree - node 4, Abuse access tree - node 13) as a risk to a human resource database. Output: list of potential attacks identified for the asset/process B.2.3.4
Step 4: Assess risk level of each potential attack from defense level
This step aims to prioritize the potential attacks which threatens a particular asset/process that have been identified in the previous step. One input for this assessment phase is the critical asset/process defense specification, i.e. defense 275
APPENDIX B. GATHERING DEFENSE REQUIREMENTS USING ATTACK TREES mechanisms and methods already implemented. The defense specification allows for the determination of a defense level as a countermeasure in respect to the potential attack under consideration. This defense level may either be considered “high” or “low” and consequently the corresponding risk level is derived as the opposite. Determining the defense level can be straightforward. For example, if the human resource database uses strong authentication methods and the potential attack being analyzed is “get password” then the defense level will probably be considered as “high”, and consequently the risk as “low”. As another example, for the “accumulate privileges” potential attack, determining the defense level would involve auditing a structure of role assignments, which might be complicated at this point. In this case, considering the defense level as “low” would be the most appropriate decision because the risk would then be forwarded to the next step as “high” priority. We acknowledge that this defense classification is a weak point of the method because it relies completely on the subjective judgment of the champion, or any security specialist, and agreement among stakeholders. Tool support for the evaluation of defense levels would be an advantage. Nevertheless, we also believe this weakness does not invalidate the method since the determination of the defense level follows a clear rationale. The process of risk assessment described should be followed for each potential attack identified for the asset/process. It remains open to organizations to set limits in terms of the number of attacks analyzed, carried over or postponed to a new round of the method. Output: prioritized list of potential attacks identified for the asset/process based on risk level B.2.3.5
Step 5: Select defense strategies which counter the potential attacks with high risk
From the previous step the organization acquires awareness about which potential attacks have high risks and therefore are top priority for the asset/process. In this step the focus is to look at which defense strategies can be used to bring the asset/process to a level of defense which avoids/mitigates those potential attacks. The defense strategies listed in Section B.2.2 are elaborated in the format of defense goals, which match Anton’s [9] definition of goals: “goals are high level objectives of the business, organization, or system. They capture the reasons why a system is needed and guide decisions at various levels within the enterprise”. Thus, we aim in this step to identify, for each potential attack with high risk, a list of defense goals using as reference the defense strategies provided. After applying the method to all critical assets/processes, overlapping defense goals among several assets/processes should be identified and the priority of defense goals should be determined. Therefore, the complete list of defense goals needs to be analyzed, refined and decomposed into requirements to be later elicit and implemented in the organization. Several researchers have proposed methods and tools for the elicitation of goal-based requirements (e.g. [9, 59, 146]) but this task is out of the scope of the method. 276
B.3. THE FRAMEWORK APPLIED: AN EXAMPLE
communication channel information flow Teller’s computer
firewall
Personal account database
credentials session
key
session key PKI server
Manager’s computer
firewall
Business account database
Figure B.8: Example from a fictitious financial institution (from Chinchani et al. [38])
Output: list of goal-based defense requirements for the asset/process to be elicit
B.3 The framework applied: an example Figure B.8 shows an example, adapted from Chinchani et al. [38], based on a fictitious financial institution. In the example, a teller can complete any personal account transaction involving up to $5,000, through the personal account database, but only a manager can complete transactions, above this limit. Transactions on business accounts are limited to managers upon the presentation of credentials to a Kerberos-like server . Successful authentication generates a session key to access the business account database. Both databases are protected by firewalls to prevent external attacks. Example - step 1 A standard business mission for financial institutions is usually in the line of “provide high quality banking services & financial solutions”. Thus, it implies on the high criticality of assets and processes related to monetary transactions. In step 1, management identifies the critical assets/processes. In this very simple example, we assume that this results in the following list: (i) asset: personal account database, (ii) process: endorsement of personal account transactions over $5,000, (iii) asset: business account database, and (iv) process: business account transactions. Example - step 2 We select the process “business account transactions” because, although this process seems already well protected, the board of directors wants re-assurance. Example - step 3 and 4 We simulate the role of stakeholders to identify potential attacks using as reference the four attack strategy trees. They look at each path from the trees and the combination of those trees, as shown 277
APPENDIX B. GATHERING DEFENSE REQUIREMENTS USING ATTACK TREES in Figure B.6 and decide if it is relevant for the process or if it suggests another relevant attack scenario (i.e. sequence of steps). Table B.2 shows the potential attacks identified and assessed. Example - step 5 In this step we identify the defense strategies which seem appropriate as countermeasures for the five potential attacks with high risks (marked in bold in Table B.2). In a real situation, the defense strategies need to be adapted and refined. Table B.3 contains the output of the method, i.e. goal-based requirements for defense against the organizations’ insiders in respect to the process analyzed. This example demonstrates the potential applicability of the framework for the identification of potential attacks by insiders and corresponding defense strategies as defense goals. We have seen that the process analyzed, which seemed already well protected, is in fact subject to potential attacks which might not be evident.
B.4 Discussion In this section, we discuss the proposed framework around three topics which, we believe, turn it interesting: (i) merging of access-oriented with permissionoriented approaches, (ii) abstraction from asset-specific, organization-specific or class of attackers-specific goals, and (iii) shift from risk-based to defense-based assessment of insider threat. First, the management of access control may deteriorate over time, opening security breaches for abuse from insiders. These breaches are related not only to the authorization of access to assets but also to more subtle permissions and control principles, such as prohibition of access, delegation of authorization, separation of duties, membership to roles, etc. When assessing insider risk, it is important to consider these permission-related risks in addition to access-related risks. Second, our approach to the modeling of insider threat concentrates not on detailed and specific goals of an insider or class of insiders but on the spectrum of alternatives he can exploit to reach high-level goals. This makes our approach more scalable than approaches that consider low-level attacker goals. The attack trees (“Pre-attack”, “Gain access”, “Abuse access” and “Abuse permission”) we propose reflect this approach and represent attack steps which combined in different manners increase awareness of the insider threat problem. Other researchers (e.g. [24, 30]) tend to model insider threat in a detailed manner that is not as scalable. Third, the most frequently used approach to prioritize risk of attacks rely on measures of attack likelihood and impact. However, these attributes are difficult to quantify in a meaningful way, specially the likelihood corresponding to a specific potential attack. To get around this problem, we prioritize risks of insiders using the level of defense of the asset/process under analysis for a specific potential attack. This shift allows the classification of the risk of a same potential 278
B.5. RELATED WORK attack differently according to the level of defense or degree of resistance of the asset/process under consideration. The deliverables of our framework aim to decrease the dependency on expert judgment for the assessment of risk from insiders. We believe that stakeholders can participate more effectively and efficiently in the process of identification and assessment of risks if they have knowledge about means exploitable by insiders and defenses useful against them.
B.5 Related work The framework presented in this chapter is related to insider threat modeling and risk management, the main ingredients of our approach. With respect to the latter, we review briefly two risk management frameworks, OCTAVE [1] and NIST SP 800-30 [202], as well as risk assessment patterns [189], considered of relevance for our work. With respect to the former, we already reviewed, along the chapter, relevant related work [195, 21, 24, 30]. Three points from OCTAVE are of interest for our work: (i) threats are gathered from enterprise knowledge. We believe our deliverables decrease this dependence; (ii) assets are prioritized based on threats, opposed to our approach where prioritization is aligned to organization goal(s)/business mission; (iii) vulnerabilities are identified based on catalogs of known attacks, however threats related to “accumulation of privileges” (AP-13) e.g. are hardly found in catalogs. Two points from the NIST SP 800-30 standard are worth emphasizing in respect to our work: (i) threats are derived from threat-sources. Thus, in terms of insiders, the focus would be on human threats. We believe our approach of attack strategies induces a broader vision of the insider problem, since it provides insights not commonly explored, as for example, separation of duty scenarios, which are unlikely to be considered in threat-source reasoning; (ii) vulnerabilities and controls have to be analyzed. We have a more focused approach when we evaluate defense level for one specific potential attack, indirectly combining the two. Risk assessment patterns provide the basics of the method proposed in this chapter. However, two points are worth mentioning. First, the proposed framework applies the general pattern specifically to the Insider Threat domain, by means of supporting deliverables. Thus, it adds value to the patters in that sense. Second, it fills some gaps left to the implementer of the risk assessment pattern. For example, we define a simple rationale for the qualitative prioritization of risks based on the protection level in place for an asset/process.
B.6 Summary We address the assessment of potential attacks with a focus on insider threat by proposing a framework that consists of (i) a method for gathering goal-based 279
APPENDIX B. GATHERING DEFENSE REQUIREMENTS USING ATTACK TREES (security) requirements for defense against insiders, and of (ii) two deliverables: insider attack strategies organized in four attack trees, and a matrix structure for matching attack and defense strategies with control principles. The method itself is not specifically tailored to insider threat and could be used for analyzing outsider threat as well. However, the framework as a whole is tailored to provide awareness to organizations towards e.g. abuse of permissions related to SoD and accumulation of roles, specific to insiders. This is valuable because it allows systematic analysis of possible multi-step attacks by insiders. Even though it remains at a high level, it allows reasoning about defenses in place and identification of defense gaps which are, in fact, goal-based requirements to be later elicited. Besides, it allows reasoning out-of-the-box, i.e. reasoning not only about abuse of access (a common type of abuse) but also about abuse of permissions. Note however that, just as other risk assessment methods, it depends on expert judgement and the results of applying it are as reliable as this judgement.
280
B.6. SUMMARY
Potential attacks At1
At2
At3
At4
At5 At6
At7 At8
At9
terminated manager uses his account/credentials after his termination to perform fraudulent business transactions terminated manager uses a backdoor account and his “old” credentials to perform business transactions insider gains physical access to a manager’s authenticated computer and performs business transactions teller learns a vulnerability specific to the organization, e.g. the manager does not apply security patches on a regular basis, to acquire credentials to perform business transactions manager deploys a logic/time bomb in the business account database manager performs fraudulent business transactions applied to, e.g., wife or boyfriend accounts (as beneficiaries) insider discloses information about business transactions to competitors or press member of application X developers team inserts a trap door in the application code which enables business transactions manager shares password/credentials with a teller or another manager (e.g. in case of emergency), enabling them to impersonate the manager to perform business transactions
Defense Risk level level high low
low
high
high
low
low
high
low
high
high
low
low
high
low
high
high
low
Table B.2: Potential attacks and derived risk level (from defense level) for the critical process “business account transactions”
281
APPENDIX B. GATHERING DEFENSE REQUIREMENTS USING ATTACK TREES
DG1 DG2 DG3
DG4 DG5 DG6
Defense goal review all access paths to assets periodically to ensure actual paths match expected paths ensure security patches are applied in a regular basis on every node of the inner network area adopt inventory and configuration management to audit if hardware and software installed in desktops and servers comply with expected analyze audit logs to track critical transactions and to track access, modification and deletion of critical information inspect code (e.g. via peer review) support security policies by education, i.e. organization-wide security awareness and training initiatives for potential insiders
Table B.3: Defense goals for the critical process “business account transactions”
282
Publications by the Author
S. H. Houmb, V. N. L. Franqueira, and E. A. Engum. Quantifying Security Risk Level from CVSS Estimates of Frequency and Impact. In Press: Journal of Systems and Software, Available online 23 August 2009: http://dx.doi.org/10.1016/j.jss.2009.08.023. Elsevier. V. N. L. Franqueira, R. H. C. Lopes, and P. A. T. van Eck. Multi-step Attack Modelling and Simulation (MsAMS) Framework based on Mobile Ambients. In SAC 2009: Proc. of the 24th Annual ACM Symposium on Applied Computing, pages 66-73, US, Mar 2009. ACM Press. V. N. L. Franqueira, P. A. T. van Eck, R. J. Wieringa, and R. H. C. Lopes. A Mobile Ambients-based Approach for Network Attack Modelling and Simulation. In ARES 2009: Proc. of the Forth Int. Conference on Availability, Reliability and Security, pages 546-553, Japan, Mar 2009. IEEE Press. S. H. Houmb and V. N. L. Franqueira. Estimating ToE Risk Level using CVSS. In ARES 2009: Proc. of the Fourth Int. Conference on Availability, Reliability and Security, pages 718-725, Japan, Mar 2009. IEEE Press. S. H. Houmb, V. N. L. Franqueira, and E. Erlend. Estimating Impact and Frequency of Risks to Safety and Mission Critical Systems Using CVSS. In ISSRE 2008 Supplemental Proceedings: 1st Workshop on Dependable Software Engineering, US, Nov 2008. IEEE Press. V. N. L. Franqueira, R. H. C. Lopes, and P. van Eck. Multi-step Attack Modelling and Simulation (MsAMS) Framework based on Mobile Ambients. Technical Report TR-CTIT-08-44, University of Twente, Jun 2008. V.N.L. Franqueira and M. van Keulen, Analysis of the NIST database towards the composition of vulnerabilities in attack scenarios. Technical Report TR-CTIT-08-08, University of Twente, Feb 2008. V. N. L. Franqueira and R. H. C. Lopes. Vulnerability Assessment by Learning Attack Specifications in Graphs. In IAS07: Proc. of the 3rd Int. Symposium on Information Assurance and Security, pages 161-164, England, Aug 2007, IEEE Press. V.N.L. Franqueira, P.A.T. van Eck. Defense against insider threat: a framework for gathering goal-based requirements. In EMMSAD’07: Proc. of the 12th Int. Workshop on Exploring Modeling Methods in Systems Analysis and Design, Norway, pages 193-202, Jun 2007. V. N. L. Franqueira, R. H. C. Lopes, and P. van Eck. An Evolutionary Approach for Learning Attack Specifications in Network Graphs. Technical Report TR-CTIT-07-40, University of Twente, Jun 2007. 283
Publications by the Author V.N.L. Franqueira and P. van Eck. Defense against insider threat: a framework for gathering goal-based requirements. Technical Report TR-CTIT06-75, University of Twente, Dec 2006. V.N.L. Franqueira and P. van Eck. Towards alignment of architectural domains in security policy specifications. In Proccedings of the 8th International Symposium on System and Information Security, Brazil, Nov 2006. V.N.L. Franqueira. Evolution of security policies. In: Doctoral Symposium Proceedings of the 14th IEEE International Requirements Engineering Conference (RE06), USA, Sep 2006. IEEE Press. V.N.L. Franqueira and P. van Eck. Towards alignment of architectural domains in security policy specifications.0 Technical Report TR-CTIT-0631, University of Twente, Jun 2006. V.N.L. Franqueira. Access Control from an Intrusion Detection Perspective. Technical Report TR-CTIT-06-10, University of Twente, Jun 2006.
284
References [1] C. Alberts and A. Dorofee. Managing Information Security Risks: The OCTAVE Approach. Addison-Wesley, Boston, MA, USA, first edition, 2002. [2] M. Almgren and U. Lindqvist. Application-integrated data collection for security monitoring. In Recent Advances in Intrusion Detection (RAID 2001), LNCS 2212, pages 22–36, Davis, California, October 2001. Springer. [3] Amenaza. The SecurlTree BurgleHouse Tutorial, Version 2.5, August 2006. http: //www.amenaza.com/downloads/docs/Tutorial.pdf, accessed Jan 2008. [4] P. Ammann, J. Pamula, J. Street, and R. Ritchey. A host-based approach to network attack chaining analysis. In ACSAC ’05: Proc. of the 21st Annual Computer Security Applications Conference, pages 72–84, Washington, DC, USA, 2005. IEEE Computer Society. [5] P. Ammann, D. Wijesekera, and S. Kaushik. Scalable, graph-based network vulnerability analysis. In CCS ’02: Proceedings of the 9th ACM conference on Computer and communications security, pages 217–224, New York, NY, USA, 2002. ACM. [6] G. F. Anderson, D. A. Selby, and M. Ramsey. Insider attack and real-time data mining of user behavior. IBM Journal Research and Development, 51(3):465–475, 2007. [7] R. Anderson. Why Information Security is Hard - An Economic Perspective. In ACSAC’01: Proc. 17th Annual Computer Security Applications Conference, pages 358–365. IEEE Computer Society Press, December 2001. [8] R. Anderson and T. Moore. Information Security Economics - and Beyond. In CRYPTO’07: 27th Annual International Cryptology Conference, pages 68–91, August 2007. [9] A. I. Anton. Goal-Based Requirements Analysis. In ICRE ’96: Proc. 2nd Int. Conference on Requirements Engineering (ICRE ’96), pages 136–144, Washington, DC, USA, 1996. IEEE Computer Society. [10] M. L. Artz. NetSPA : a Network Security Planning Architecture. Master’s thesis, MIT - Massachusetts Institute of Technology, May 2002. [11] AS/NZS-4360:2004. Australian/New Zealand Standards, Risk Management, 2004. [12] A. Avizienis, J.-C. Laprie, B. Randell, and C. Landwehr. Basic Concepts and Taxonomy of Dependable and Secure Computing. IEEE Transactions on Dependable and Secure Computing, 1(1):11–33, January-March 2004. [13] K. Avrachenkov and N. Litvak. The effect of new links on google pagerank. Stochastic Models, 22(2):319–331, December 2006. [14] S. Axelsson. Research in intrusion-detection systems: A survey and taxonomy. Technical Report 99-15, Department of Computer Engineering, Chalmers University of Technology, Goteborg, Sweden, March 2000. [15] P. Bacher, T. Holz, M. Kotter, and G. Wicherski. Know your Enemy: Tracking Botnets. The Honeypot Projet, March 2005. http://www.honeynet.org/papers/bots/, last visited 15 Jan 2009. [16] W. H. Baker, C. D. Hylender, and J. A. Valentine. 2008 data breach investigations report. Verizon Business Security Solutions, June 2008. www.verizonbusiness. com/resources/security/databreachreport.pdf, Visited on Sep 2008. [17] S. M. Bellovin. Computer security - an end state? Communications of the ACM, 44(3):131–132, 2001.
285
REFERENCES [18] P. Berander and A. Andrews. Requirements prioritization. In A. Aurum and C. Wohlin, editors, Engineering and Managing Software Requirements, pages 69– 94. Springer Verlag, Berlin, Germany, 2005. [19] C. Berge. Graphs and Hypergraphs, volume 6 of North-Holland Mathematical Library. American Elsevier Pub. Co, second edition, 1975. [20] M. Bishop. Position: Insider is relative. In NSPW ’05: Proceedings of the 2005 workshop on New security paradigms, pages 77–78, New York, NY, USA, 2005. ACM Press. [21] S. Bistarelli, F. Fioravanti, and P. Peretti. Defense trees for economic evaluation of security investments. In ARES’06: Proc. of the The 1st Int. Conference on Availability, Reliability and Security, pages 416–423, Washington, DC, USA, April 2006. IEEE Computer Society. [22] D. Bolzoni and S. Etalle. Boosting Web Intrusion Detection Systems by Inferring Positive Signatures. In OTM’08: Proc. of Confederated International Conferences, volume 5332 of LNCS, pages 938–955, Berlin, 2008. Springer Verlag. [23] P. Boncz, T. Grust, M. van Keulen, S. Manegold, J. Rittinger, and J. Teubner. MonetDB/XQuery: a fast XQuery processor powered by a relational engine. In Proc. of the 2006 ACM SIGMOD Int’l conf. on Management of data, Chicago, IL, USA, pages 479–490, 2006. [24] R. C. Brackney and R. H. Anderson. Undersatanding the insider threat: Proceedings of a march 2004 workshop, 2004. [25] C. Braghin, A. Cortesi, S. Filippone, R. Focardi, F. L. Luccio, and C. Piazza. BANANA - A Tool for Boundary Ambients Nesting ANAlysis. In TACAS’03: Proc. 9th Int. Conf. Tools and Algorithms for the Construction and Analysis of Systems, pages 437–441. Springer-Verlag, 2003. [26] C. Braghin, A. Cortesi, and R. Focardi. Security Boundaries in Mobile Ambients. Computer Languages, 28(1):101–127, April 2002. [27] S. Brin and L. Page. The anatomy of a large-scale hypertextual Web search engine. Comput. Netw. ISDN Syst., 30(1-7):107–117, 1998. [28] BS. ISO 17799: Information technology. Security techniques. Code of practice for information security management, 2000. [29] M. Bugliesi, G. Castagna, and S. Crafa. Reasoning about Security in Mobile Ambients. In CONCUR’01: Proc. of the 12th Int. Conf. on Concurrency Theory, pages 102–120, London, UK, 2001. Springer-Verlag. [30] J. W. Butts, R. F. Mills, and R. O. Baldwin. Developing an insider threat model using functional decomposition. In MMM-ACNS: 3rd Int. Workshop on Mathematical Methods, Models, and Architectures for Computer Network Security, volume 3685 of LNCS, pages 412–417. Springer, September 2005. [31] M. Calder. A Grand Challenge for Computer Science: As Built Models of Computing Systems. National e-Science Centre, e-Science Institute, Workshop on Grand Challenges for Computer Research, UK, November 2002. www.nesc.ac. uk/esi/events/Grand_Challenges/panelb/b17.pdf. [32] D. M. Cappelli, A. G. Desai, A. P. Moore, T. J. Shimeall, E. A. Weaver, and B. J. Willke. Management and Education of the Risk of Insider Threat (MERIT). In Proc. 24th Int. Conference of the System Dynamics Society, The Netherlands, July 2006. Radboud University of Nijmegen. [33] L. Cardelli. Mobility and security. In F. L. Bauer and R. Steinbrggen, editors, Proc. of the NATO Advanced Study Institute on Foundations of Secure Computation, NATO Science Series, pages 3–37, Marktoberdorf, Germany, 27 July - 8 August 2000. IOS Press. Lecture notes for Marktoberdorf Summer School 1999.
286
REFERENCES [34] L. Cardelli. Bioware Languages, pages 59–65. Monographs in Computer Science. Springer, New York, 2004. [35] L. Cardelli and A. D. Gordon. Mobile Ambients. In Foundations of Software Science and Computation Structures: First International Conference, FOSSACS’98, volume 1378 of LNCS, pages 140–155, Berlin Germany, 1998. Springer-Verlag. [36] L. Cardelli and A. D. Gordon. Types for Mobile Ambients. In POPL’99: Proc. of the 26th ACM SIGPLAN-SIGACT symposium on Principles of programming languages, pages 79–92, New York, NY, USA, 1999. ACM. [37] Common criteria for information technology security evaluation, part 1: Introduction and general model, September 2006. Version 3.1, Revision 1, CCMB2006-09-001. [38] R. Chinchani, A. Iyer, H. Q. Ngo, and S. Upadhyaya. Towards a Theory of Insider Threat Assessment. In DSN 2005: Int. Conf. on Dependable Systems and Networks, pages 108–117. IEEE Computer Society Press, July 2005. [39] R. Chinchani, A. Iyer, H. N. Q., and S. Upadhyaya. A Target-Centric Formal Model For Insider Threat and More. Technical Report 2004-16, University of Buffalo, US, October 2004. [40] S. Christey. Unforgivable Vulnerabilities. MITRE Corporation, August 2007. Presented as a “Turbo-Talk” at the Black Hat Briefings 2007 held in Las Vegas, Nevada, USA. [41] S. Christey and R. A. Martin. Vulnerability Type Distributions in CVE, version 1.1. MITRE Corporation, May 2007. [42] C. Y. Chung, M. Gertz, and K. N. Levitt. DEMIDS: A misuse detection system for database systems. In Proc. 3rd Int. IFIP TC-11 WG11.5 Working Conf. on Integrity and Internal Control in Information Systems, pages 159–178. Kluwer Academic Publishers, 1999. [43] A. Compagnoni, E. L. Gunter, and P. Bidinger. Role-based Access Control for Boxed Ambients. Theoretical Computer Science, 398(1-3):203–216, 2008. [44] W. J. Cook, W. H. Cunningham, W. R. Pulleyblank, and A. Schrijver. Combinatorial Optimization. John Wiley & Sons, Inc., New York, NY, USA, 1998. [45] E. Cooke, F. Jahanian, and D. McPherson. The Zombie Roundup: Understanding, Detecting, and Disrupting Botnets. In SRUTI’05: Proc. of the Steps to Reducing Unwanted Traffic on the Internet on Steps to Reducing Unwanted Traffic on the Internet Workshop, pages 39–44, Berkeley, CA, USA, 2005. USENIX Association. [46] COSO. Internal Control - Integrated Framework by Committee on Sponsoring Organizations of the Treadway Commission, 1994. [47] COSO. Internal Control over Financial Reporting - Guidance for Smaller Public Companies, 2006. [48] M. J. Crawley. The R Book. Wiley Blackwell, 2007. [49] M. Cremonini and D. Nizovtsev. Understanding and Influencing Attackers Decisions: Implications for Security Investment Strategies. In WEIS06: 5th Workshop on the Economics of Information Security, June 2006. [50] J. Cullum, C. E. Irvine, and T. E. Levin. Performance impact of connectivity restrictions and increased vulnerability presence on automated attack graph generation. In ICIW 2007: 2nd Int. Conf. on i-Warfare and Security Naval Postgraduate School, pages 33–46, England, March 2007. Academic Conferences Limited.
287
REFERENCES [51] F. Cuppens and R. Ortalo. Lambda: A language to model a database for detection of attacks. In RAID’00: Proc. of the Third Int. Workshop on Recent Advances in Intrusion Detection, pages 197–216, London, UK, 2000. Springer-Verlag. [52] Common Vulnerabilities and Exposures. http://cve.mitre.org/, visited 10July-2008. [53] CVE-2008-3257. Stack Buffer Overflow, Published in the National Vulnerability Database (NVD) on 22 Jul 2008. http://web.nvd.nist.gov/view/vuln/detail? vulnId=CVE-2008-3257. [54] CVE-2008-3257. Secunia Advisory. http://secunia.com/advisories/31146. Visited 23-Jan-2009. [55] CVE-2008-5416. Published in the National Vulnerability Database (NVD) on 10 Dec 2008. http://web.nvd.nist.gov/view/vuln/detail?vulnId= CVE-2008-5416. [56] CVSS calculator. CVSS: Common Vulnerability Scoring System Support v2. NIST homepage: National Institute of Standardard and Technology, 2004. http: //nvd.nist.gov/cvss.cfm (last visited October 2008). [57] M. Dacier, Y. Deswarte, and M. Kaaniche. Models and Tools for Quantitative Assessment of Operational Security. In IFIP SEC’96, pages 177–186, May 1996. [58] D. Dagon, G. Gu, C. Lee, and W. Lee. A Taxonomy of Botnet Structures. In Proc. of the 23 Annual Computer Security Applications Conference (ACSAC’07), pages 325–339, Washington, DC, USA, December 2007. IEEE Computer Society. [59] A. Dardenne, A. van Lamsweerde, and S. Fickas. Goal-directed requirements acquisition. Science of Computer Programming, 20(1-2):3–50, 1993. [60] J. Dawkins and J. Hale. A Systematic Approach to Multi-Stage Network Attack Analysis. In IWIA ’04: Proc. of the 2nd IEEE Int. Information Assurance Workshop, pages 48–56, Washington, DC, USA, 2004. IEEE Computer Society. [61] E. W. Dijkstra. A note on two problems in connexion with graphs. Numerische Mathematik, 1:269–271, 1959. [62] E. W. Dijkstra. A Discipline of Programming. Prentice Hall, Upper Saddle River, NJ, USA, 1976. [63] E. W. Dijkstra and W. H. J. Feijen. A Method of Programming. Addison-Wesley Longman Publishing Co., Inc., Boston, MA, USA, 1988. [64] H. Dreger, A. Feldmann, M. Mai, V. Paxson, and R. Sommer. Dynamic application-layer protocol analysis for network intrusion detection. In USENIXSS’06: Proc. of the 15th Conf. on USENIX Security Symposium, pages 257–272, Berkeley, CA, USA, 2006. USENIX Association. [65] S. T. Eckmann, G. Vigna, and R. A. Kemmerer. STATL: An Attack Language for State-based Intrusion Detection. Journal of Computer Security, 10(1/2):71–104, 2002. [66] ETSI-TS-102-165-1. Part 1: Method and proforma for Threat, Risk, Vulnerability Analysis. European Telecommunication Standardisation Institute (ETSI), v4.2.1, 2006. [67] J. Evers. Hacking for Dollars. ZDNet online news, posted on 6 July 2005. http: //news.zdnet.com/2100-1009_22-5772238.html, accessed Jun 2006. [68] Exploit. Microsoft SQL Server sp replwritetovarbin limited memory overwrite vulnerability. SecurityFocus Symantec Corporation, 2008. http://www.sec-consult.com/files/20081209_mssql-2000-sp_ replwritetovarbin_memwrite.txt, Visited on 24 Jan 2009. [69] J. D. Fernandez and A. E. Fernandez. Scada systems: vulnerabilities and remediation. Journal of Computing Sciences in Colleges, 20(4):160–168, 2005.
288
REFERENCES [70] V. N. L. Franqueira and R. H. C. Lopes. Vulnerability Assessment by Learning Attack Specifications in Graphs. In IAS’07: Proc. of the 3rd Int. Symposium on Information Assurance and Security), pages 161–164, Los Alamitos, CA, USA, August 2007. IEEE Computer Society. [71] V. N. L. Franqueira, R. H. C. Lopes, and P. van Eck. An Evolutionary Approach for Learning Attack Specifications in Network Graphs. Technical Report TR-CTIT-07-40, Centre for Telematics and Information Technology (CTIT), University of Twente, Enschede, The Netherlands, June 2007. [72] V. N. L. Franqueira, R. H. C. Lopes, and P. van Eck. Multi-step Attack Modelling and Simulation (MsAMS) Framework based on Mobile Ambients. Technical Report TR-CTIT-08-44, Centre for Telematics and Information Technology (CTIT), University of Twente, Enschede, The Netherlands, June 2008. [73] V. N. L. Franqueira, R. H. C. Lopes, and P. A. T. van Eck. Multi-step Attack Modelling and Simulation (MsAMS) Framework based on Mobile Ambients. In SAC’2009: Proc. of the 24th Annual ACM Symposium on Applied Computing, pages 66–77, New York, March 2009. ACM Press. [74] V. N. L. Franqueira and P. van Eck. Defense against insider threat: a framework for gathering goal-based requirements. Technical Report TR-CTIT-06-75, University of Twente, December 2006. [75] V. N. L. Franqueira and P. A. T. van Eck. Defense against insider threat: a framework for gathering goal-based requirements. In EMMSAD’07: Proc. of the 12th Int. Workshop on Exploring Modeling Methods in Systems Analysis and Design, pages 193–202, June 2007. [76] V. N. L. Franqueira, P. A. T. van Eck, R. J. Wieringa, and R. H. C. Lopes. A Mobile Ambients-based Approach for Network Attack Modelling and Simulation. In ARES’2009: Proc. of the Forth Int. Conference on Availability, Reliability and Security, pages 546–553, Los Alamitos, March 2009. IEEE Computer Society Press. [77] V. N. L. Franqueira and M. van Keulen. Analysis of the NIST database towards the composition of vulnerabilities in attack scenarios. Technical Report TR-CTIT08-08, Centre for Telematics and Information Technology (CTIT), University of Twente, Enschede, The Netherlands, Feb. 2008. [78] S. Frei, M. May, U. Fiedler, and B. Plattner. Large-Scale Vulnerability Analysis. In LSAD ’06: Proceedings of the 2006 SIGCOMM workshop on Large-scale attack defense, pages 131–138, New York, NY, USA, September 2006. ACM. [79] F. Gallegos. Red teams: An audit tool, technique and methodology for information assurance. Information Systems Control, 2, 2006. Issue: Advanced Audit Technologies and Emerging Audit Techniques. [80] M. R. Garey and D. S. Johnson. Computers and Intractability: A Guide to the Theory of NP-Completeness. Mathematical Sciences. W. H. Freeman, January 1979. [81] D. Geer and J. Harthorne. Penetration Testing: A Duet. In ACSAC’02: Proc. of the 18th Annual Computer Security Applications Conference, page 185, Washington, DC, USA, 2002. IEEE Computer Society. [82] M. Glinz and R. J. Wieringa. Stakeholders in Requirements Engineering. IEEE Software, published by IEEE Computer Society, 24(2):18–20, March/April 2007. [83] D. Gordon, T. R. Stehney, N. Wattas, and E. Yu. Security quality requirements engineering (square): Case study on asset management system, phase ii. Technical Report CMU/SEI-SR-005, Carnegie Mellon Software Engineering Institute, Pittsburgh, PA, USA, May 2005.
289
REFERENCES [84] L. A. Gordon and M. P. Loeb. Managing Cybersecurity Resources: A Cost-Benefit Analysis. McGraw-Hill, first edition, 2006. [85] L. A. Gordon, M. P. Loeb, W. Lucyshyn, and R. Richardson. 2006 CSI/FBI Computer Crime and Security Survey, 2006. http://i.cmpnet.com/gocsi/db_ area/pdfs/fbi/FBI2006.pdf, accessed Jan 2008. [86] N. J. Gunther. Guerrilla Capacity Planning: A Tactical Approach to Planning for Highly Scalable Applications and Services. Springer, 2006. [87] D. Ha, S. Upadhyaya, H. Q. Ngo, S. Pramanik, R. Chinchani, and S. Mathew. Insider threat analysis using information-centric modeling. In Advances in Digital Forensics III, IFIP International Federation for Information Processing, pages 55– 73. Springer, Boston, 2007. [88] S. Hansman. A Taxonomy of Netwrok and Computer Attack Methodologies. B.Sc. Honours Report, University of Canterbury, New Zealand, November 2003. http://www.cosc.canterbury.ac.nz/research/reports/HonsReps/ 2003/hons_0306.pdf, accessed 18 Dec 2008. [89] M. V. Hayden. The Insider Threat to U.S. Government Information Systems, July 1999. Advisory Memoranda NSTISSAM INFOSEC 1-99. [90] R. L. Hays and W. L. Winkler. Statistics: Probability, Inference, and Decision. Thomson Learning, second edition, 1975. [91] L. He and N. Bode. Network Penetration Testing. In EC2ND 2005: Proc. of the First European Conference on Computer Network Defence, pages 3–12, London, 2006. Springer-Verlag. [92] I. Heinz, F. Hartl, and C. Frohlich. Semi-Automatic 3D CAD Model Generation of As Built Conditions of Real Environments using a Visual Laser Radar. In In the Proc. of the 10th IEEE Int. Workshop on Robot and Human Interactive Communication, pages 400–406, Washington, DC, USA, 2001. IEEE Computer Society Press. [93] G. Helmer, J. Wonga, M. Slagell, V. Honavar, L. Miller, and R. Lutz. A Software Fault Tree Approach to Requirements Analysis of an Intrusion Detection System. Requirements Engineering, 7(4):207–220, November 2002. [94] P. Herzog. Open Source Security Testing Methodology Manual. ISECOM: Institute for Security and Open Methodologies, August 2008. version 3 Lite. [95] C. A. R. Hoare. Communicating Sequential Processes. Commun. ACM, 21(8):666–677, 1978. [96] C. A. R. Hoare. Communicating Sequential Processes. Prentice Hall International, second edition, June 2004. Online version updated by Jim Davies of the Oxford University Computing Laboratory, available at http://www.usingcsp. com/cspbook.pdf. [97] G. Hoglund and G. McGraw. Exploiting Software: How to Break Code. AddisonWesley, Pearson Education Inc., 2004. [98] J. Homer, A. Varikuti, X. Ou, and M. A. Mcqueen. Improving Attack Graph Visualization through Data Reduction and Attack Grouping. In VizSec’08: Proc. of the 5th Int. Workshop on Visualization for Computer Security, pages 68–79, Berlin, Heidelberg, 2008. Springer-Verlag. [99] S. H. Houmb. Decision Support for Choice of Security Solution: The AspectOriented Risk Driven Development (AORDD) Framework. PhD thesis, Norwegian University of Science and Technology, Trondheim, November 2007. [100] S. H. Houmb and V. N. L. Franqueira. Estimating ToE Risk Level using CVSS. In ARES’2009: Proc. of the Fourth Int. Conference on Availability, Reliability
290
REFERENCES
[101]
[102]
[103]
[104]
[105]
[106] [107] [108] [109] [110]
[111]
[112]
[113]
[114]
[115]
[116]
and Security, IEEE Conference Proceedings, Los Alamitos, March 2009. IEEE Computer Society Press. S. H. Houmb, V. N. L. Franqueira, and E. A. Engum. Quantifying Security Risk Level from CVSS Estimates of Frequency and Impact. Journal of Systems and Software, 2009. Available online 23 August 2009. S. H. Houmb, V. N. L. Franqueira, and E. Erlend. Estimating Impact and Frequency of Risks to Safety and Mission Critical Systems Using CVSS. In ISSRE 2008 Supplemental Proceedings: 1st Workshop on Dependable Software Engineering, Seattle, US, IEEE CS Conference Proceedings, Washington, US, November 2008. IEEE Computer Society Press. M. Howard, J. Pincus, and J. M. Wing. Measuring Relative Attack Surfaces. In Proc. Workshop on Advanced Developments in Software and Systems Security, December 2003. IE PassView v1.15 - Recover lost passwords stored by Internet Explorer. http: //www.nirsoft.net/utils/internet_explorer_password.html, visited 20 Feb 2009. K. Ingols, R. Lippmann, and K. Piwowarski. Practical attack graph generation for network defense. In ACSAC ’06: Proc. of the 22nd Annual Computer Security Applications Conference on Annual Computer Security Applications Conference, pages 121–130, Washington, DC, USA, 2006. IEEE Computer Society. INMOS. Occam Programming Manual. Prentice Hall Trade, 1984. ISO/IEC-27002. Information technology. Security techniques. Code of practice for information security management, 2005. ISO/IEC-27005. Information technology. Security techniques. Information security risk management, 2008. IT Governance Institute. CobiT 4.0 - Control Objectives for Information and related Technology, 2005. IT Governance Institute. IT Control Objectives for Sarbanes-Oxley, The Role of IT in the Design and Implementation of Internal Control Over Financial Reporting - 2nd Edition, 2006. S. Jajodia, S. Noel, and B. O’Berry. Topological Analysis of Network Attack Vulnerability. In Managing Cyber Threats: Issues, Approaches and Challenges. Springer-Verlag, Germany, 2003. A. Jones and Y. Lin. Application intrusion detection using language library calls. In Proc. 17th Annual Computer Security Applications Conf. (ACSAC’01), pages 442–449, 2001. S. Kandula, D. Katabi, M. Jacob, and A. Berger. Botz-4-sale: surviving organized DDoS attacks that mimic flash crowds. In NSDI’05: Proc. of the 2nd Conf. on Symposium on Networked Systems Design & Implementation, pages 287–300, Berkeley, CA, USA, 2005. USENIX Association. M. Keeney, E. Kowalski, D. Cappelli, A. Moore, T. Shimeall, and S. Rogers. Insider Threat Study: Computer System Sabotage in Critical Infrastructure Sectors, May 2005. U.S. Secret Service and CERT Coordination Center. J. King. The new ground zero in internet warfare. Computerworld, published on April 27, 2009. http://http://acishost.acis.org.co/pipermail/segurinfo/ 2009-April/000108.html, accessed June 2009. J. M. Kleinberg. Authoritative Sources in a Hyperlinked Environment. In In Proc. Ninth Ann. ACM-SIAM Symp. Discrete Algorithms, pages 668–677, New York, 1998. ACM Press.
291
REFERENCES [117] E. J. Kokko, H. E. Martz-Jr., D. J. Chinn, H. R. Childs, J. A. Jackson, D. H. Chambers, D. J. Schneberk, and G. A. Clark. As-Built Modeling of Objects for Performance Assessment. J. Comput. Inf. Sci. Eng., 6(4):405–417, December 2006. [118] C. Kruegel, F. Valeur, and G. Vigna. Intrusion Detection and Correlation - Challenges and Solutions, volume 14 of Advances in Information Security. Springer Verlag, New York, NY, USA, 2005. [119] S. Kumar. Classification and Detection of Computer Intrusions. PhD thesis, Purdue University, Department of Computer Sciences, 1995. [120] A. N. Langville and C. D. Meyer. Google’s PageRank and Beyond: The Science of Search Engine Rankings. Princeton Universty Press, 2006. [121] K. C. Laudon and J. P. Laudon. Essentials of Management Information Systems. Prentice Hall, Upper Saddle River, NJ, USA, fifth edition, 2003. [122] P. T. Leeson and C. J. Coyne. The Economics of Computer Hacking. Journal of Law, Economics and Policy, 1(2):511–532, 2006. [123] R. Lempel and S. Moran. The stochastic approach for link-structure analysis (SALSA) and the TKC effect. Computer Networks, 33(1-6):387–401, 2000. [124] F. Levi and D. Sangiorgi. Controlling Interference in Ambients. In POPL’00: Proc. of the 27th ACM SIGPLAN-SIGACT Symposium on Principles of Programming Languages, pages 352–364, New York, NY, USA, 2000. ACM. [125] W. Li, R. B. Vaughn, and Y. S. Dandass. An approach to model network exploitations using exploitation graphs. Simulation, 82(8):523–541, 2006. [126] R. Lippmann, K. Ingols, C. Scott, K. Piwowarski, K. Kratkiewicz, M. Artz, and R. Cunningham. Validating and Restoring Defense in Depth Using Attack Graphs. In MILCOM’06: Military Communications Conference, pages 1–10, October 2006. [127] R. P. Lippmann and K. W. Ingols. Annotated Review of Past Papers on Attack Graphs. Technical Report ESC-TR-2005-054, MIT Lincoln Laboratory, Masschusetts, USA, March 2005. [128] R. P. Lippmann, K. W. Ingols, C. Scott, K. Piwowarski, K. J. Kratkiewicz, M. Artz, and R. K. Cunningham. Evaluating and Strengthening Enterprise Network Security using Attack Graphs. Technical Report ESC-TR-2005-064, MIT Lincoln Laboratory, Masschusetts, USA, October 2005. [129] P. Liu, W. Zang, and M. Yu. Incentive-based modeling and inference of attacker intent, objectives, and strategies. ACM Trans. Inf. Syst. Secur., 8(1):78–118, 2005. [130] S. Marlow, T. Harris, R. P. James, and S. P. Jones. Parallel generational-copying garbage collection with a block-structured heap. In ISMM’08: Proc. of the 7th Int. Symposium on Memory Management, pages 11–20, New York, NY, USA, 2008. ACM Press. [131] R. A. Martin. Managing Vulnerabilities in Networked Systems. IEEE Computer Society Computer Magazine, 34(11):32–38, November 2001. [132] J. P. McDermott. Attack Net Penetration Testing. In ACM SIGSAC’00: Proc. of the 2000 Workshop on New security Paradigms, pages 15–21, New York, NY, USA, 2000. ACM Press. [133] G. McGraw. Testing for Security During Development: Why We Should Scrap Penetrate-and-Patch. IEEE Aerospace and Electronic Systems, 13(4):13–15, April 1998.
292
REFERENCES [134] N. R. Mead, E. D. Hough, and T. R. Stehney. Security quality requirements engineering (square) methodology. Technical Report CMU/SEI-TR-009, Carnegie Mellon Software Engineering Institute, Pittsburgh, PA, USA, November 2005. [135] V. Mehta, C. Bartzis, H. Zhu, E. M. Clarke, and J. M. Wing. Ranking Attack Graphs. In RAID 2006: Proceedings of the 9th Int. Symposium on Recent Advances in Intrusion Detection, number 4219 in LNCS, pages 127–144. Springer, September 2006. [136] P. Mell, K. Scarfone, and S. Romanosky. A complete guide to the common vulnerability scoring system, version 2.0. Published by FIRST - Forum of Incident Response and Security Teams, June 2007. [137] Merriam-Webster. Online dictionary. http://www.merriam-webster.com. [138] M. Merro and M. Hennessy. Bisimulation Congruences in Safe Ambients. In POPL’02: Proc. of the 29th ACM SIGPLAN-SIGACT Symposium on Principles of Programming Languages, pages 71–80, New York, NY, USA, 2002. ACM. [139] C. Michel and L. Me. ADELE: an attack description language for knowledge-based intrustion detection. In IFIP/SEC’01: Proc. of the 16th int. conf. on Information security: Trusted information, pages 353–368, June 2001. [140] R. Milner. Calculus of Communicating Systems. Lecture Notes in Computer Science. Springer-Verlag, Berlin, Germany, 1980. [141] R. Milner. Pure bigraphs. Technical Report UCAM-CL-TR-614, University of Cambridge, January 2005. [142] J. Mirkovic and P. Reiher. A Taxonomy of DDoS Attack and DDoS Defense Mechanisms. SIGCOMM Computer Communications Review, 34(2):39–53, 2004. [143] R. A. Miura-Ko and N. Bambos. SecureRank: A Risk-Based Vulnerability Management Scheme for Computing Infrastructures. In ICC’07: Proc. of Int. Conf. on Communications, pages 1455–1460. IEEE Computer Society Press, June 2007. [144] G. Modelo-Howard, S. Bagchi, and G. Lebanon. Determining Placement of Intrusion Detectors for a Distributed Application through Bayesian Network Modeling. In RAID’08: Proc. of the 11th Int. Symposium on Recent Advances in Intrusion Detection, volume 5230 of LNCS, pages 271–290. Springer, 2008. [145] MPI Forum. MPI: A Message-Passing Interface Standard, June 2008. Version 2.1, http://www.mpi-forum.org/docs/mpi21-report.pdf, accessed June 2009. [146] J. Mylopoulos, L. Chung, and E. Yu. From object-oriented to goal-oriented requirements analysis. Commun. ACM, 42(1):31–37, 1999. [147] M. A. Najork. Comparing the Effectiveness of HITS and SALSA. In CIKM ’07: Proc. of the sixteenth ACM Conf. on Information and Knowledge Management, pages 157–164, New York, NY, USA, 2007. ACM. [148] S. Nawaz. Security issues in ’Remember Me’ feature. Palisade Magazine: Application Security Intelligence, published by PLYNT (Security Testing Verification & Certification), March 2006. http://palisade.plynt.com/issues/2006Mar/ remember-me-security/, visited 20 Feb 2009. [149] Tenable network security: The Nessus Security Scanner. http://www.nessus. org. Visited 10-July-2008. [150] F. Nielson, H. R. Nielson, R. R. Hansen, and J. G. Jensen. Validating Firewalls in Mobile Ambients. In CONCUR’99: Proc, of the 10th Int. Conf. on Concurrency Theory, pages 463–477, London, UK, 1999. Springer-Verlag. [151] P. Ning and D. Xu. Learning Attack Strategies from Intrusion Alerts. In CCS’03: Proc. of the 10th ACM Conf. on Computer and Communications Security, pages 200–209, New York, NY, USA, 2003. ACM.
293
REFERENCES [152] National Institute of Standards and Technology. http://www.nist.gov//, visited 10-July-2008. [153] NISTIR-7298. Glossary of Key Information Security Terms. NIST, National Institute of Standards and Technology, NISTIR-7298, April 2006. [154] Nmap. Network mapper: Open source licence. [155] S. Noel, M. Elder, S. Jajodia, P. Kalapa, S. O’Hare, and K. Prole. Advances in Topological Vulnerability Analysis. Proc. Cybersecurity Applications and Technology Conference for Homeland Security (CATCH), pages 124–129, March 2009. [156] S. Noel, M. Jacobs, P. Kalapa, and S. Jajodia. Multiple Coordinated Views for Network Attack Graphs. In VIZSEC’05: Proc. of the IEEE Workshops on Visualization for Computer Security, page 12, Washington, DC, USA, 2005. IEEE Computer Society. [157] S. Noel and S. Jajodia. Managing attack graph complexity through visual hierarchical aggregation. In VizSEC/DMSEC ’04: Proc. of the 2004 ACM workshop on Visualization and data mining for computer security, pages 109–118, New York, NY, USA, 2004. ACM. [158] S. Noel and S. Jajodia. Understanding Complex Network Attack Graphs through Clustered Adjacency Matrices. In ACSAC ’05: Proceedings of the 21st Annual Computer Security Applications Conference, pages 160–169, Washington, DC, USA, 2005. IEEE Computer Society. [159] S. Noel and S. Jajodia. Attack graphs for sensor placement, alert prioritization, and attack response. Presented at Cyberspace Research Workshop (part of Air Force Cyberspace Symposium), held in Shreveport, Louisiana, November 2007. [160] S. Noel, E. Robertson, and S. Jajodia. Correlating intrusion events and building attack scenarios through attack graph distances. In ACSAC ’04: Proc. of the 20th Annual Computer Security Applications Conference, pages 350–359, Washington, DC, USA, 2004. IEEE Computer Society. [161] NVD. National Vulnerability Database v2. http://nvd.nist.gov/, visited 10July-2008. [162] R. Ortalo, Y. Deswarte, and M. Kaˆ aniche. Experimenting with Quantitative Evaluation Tools for Monitoring Operational Security. IEEE Trans. Softw. Eng., 25(5):633–650, 1999. [163] X. Ou. A logic-programming approach to network security analysis. PhD thesis, Princeton University, November 2005. [164] X. Ou, W. F. Boyer, and M. A. McQueen. A Scalable Approach to Attack Graph Generation. In CCS ’06: Proc. of the 13th ACM Conf. on Computer and Communications Security, pages 336–345, New York, NY, USA, 2006. ACM. people.cis.ksu.edu/~xou/publications/ccs06.pdf. [165] X. Ou, S. Govindavajhala, and A. W. Appel. Mulval: a logic-based network security analyzer. In SSYM’05: Proc. of the 14th Conf. on USENIX Security Symposium, Berkeley, CA, USA, August 2005. USENIX Association. [166] PA Consulting Group. Process Control and SCADA Security, Good Practice Guide. CPNI - Centre for the Protection of National Infrastructure, UK Security Service. http://www.cpni.gov.uk/Docs/Overview_of_Process_Control_ and_SCADA_Security.pdf, visited 12 Jan 2009. [167] C. Phillips and L. P. Swiler. A Graph-Based System for Network-Vulnerability Analysis. In NSPW ’98: Proc. 1998 workshop on New Security Paradigms, pages 71–79, New York, NY, USA, 1998. ACM Press. [168] Python. Programming language. http://www.python.org/.
294
REFERENCES [169] M. J. Quinn. Parallel Programming in C with MPI and OpenMP. McGraw-Hill Higher Education, July 2003. [170] C. R. Ramakrishnan and R. Sekar. Model-based analysis of configuration vulnerabilities. Journal of Computer Security, 10(1-2):189–209, 2002. [171] M. R. Randazzo, M. Keeney, E. Kowalski, D. Cappelli, and A. Moore. Insider Threat Study: Illicit Cyber Activity in the Banking and Finance Sector, August 2004. U.S. Secret Service and CERT Coordination Center. [172] M. Rausand and A. Hoyland. System Reliability Theory: Models, Statistical Methods, and Applications. John Wiley & Sons, Inc., second edition, 2004. [173] Red Hat Enterprise Linux 4.5.0: Security Guide. Red Hat, Inc., May 2007. http://www.redhat.com/docs/manuals/enterprise/RHEL-4-Manual/ en-US/Security_Guide/, accessed Jan 2008. [174] RedSeal. RedSeal System Inc. http://www.redseal.net/, accessed 16 Sept 2008. [175] C. R. Reeves. Modern Heuristic Techniques for Combinatorial Problems. Alfred Waller, 1993. [176] A. Regev, E. M. Panina, W. Silverman, L.Cardelli, and E. Shapiro. BioAmbients: An abstraction for biological compartments. Theoretical Computer Science, Special Issue on Computational Methods in Systems Biology, 325(1):141– 167, September 2004. [177] E. Rescorla. Security holes... who cares? In SSYM’03: Proc. of the 12th conference on USENIX Security Symposium, pages 75–90, Berkeley, CA, USA, 2003. USENIX Association. [178] R. W. Ritchey and P. Ammann. Using Model Checking to Analyze Network Vulnerabilities. In SP’00: Proc. of the 2000 IEEE Symposium on Security and Privacy, pages 156–165, Washington, DC, USA, 2000. IEEE Computer Society. [179] M. B. Salem, S. Hershkop, and S. J. Stolfo. Insider Attack and Cyber Security, chapter A Survey of Insider Attack Detection Research, pages 69–90. SpringerVerlag, 2008. [180] R. Sawilla and X. Ou. Googling Attack Graphs. Technical Report TM-2007-205, Defense Research and Development Canada, September 2007. [181] R. E. Sawilla and X. Ou. Identifying Critical Attack Assets in Dependency Attack Graphs. In ESORICS’08: Proc. of the 13th European Symposium on Research in Computer Security, pages 18–34, Berlin, Heidelberg, 2008. Springer-Verlag. [182] A. Schaad. A Framework for Organisational Control Principles. PhD thesis, University of York, Department of Computer Science, 2003. [183] A. Schaad and J. D. Moffett. A framework for organisational control principles. In ACSAC ’02: Proceedings of the 18th Annual Computer Security Applications Conference, page 229, Washington, DC, USA, 2002. IEEE Computer Society. [184] S. Schechter, J. Jung, W. Stockwell, and C. McLain. Inoculating SSH Against Address Harvesting. In NDSS’06: The 13th Annual Network and Distributed System Security Symposium, San Diego, CA, USA, February 2006. [185] S. E. Schechter. Toward Econometric Models of the Security Risk from Remote Attack. IEEE Security and Privacy, 03(1):40–44, 2005. [186] B. Schneier. Attack trees: Modeling security threats. Dr. Dobb’s Journal, December 1999. [187] B. Schneier. Secrets and Lies: Digital Security in a Networked World. Wiley Computer Publishing, 2004. [188] B. Schneier. Information Security and Externalities. ENISA Quarterly, 2(4):3–4, January 2007.
295
REFERENCES [189] M. Schumacher, E. Fernandez-Buglioni, D. Hybertson, F. Buschmann, and P. Sommerlad. Security Patterns: integrating security and systems engineering. John Wiley & Sons, Ltd, Wiltshire, GB, first edition, 2006. [190] J. R. Seeley. The net of reciprocal influence: A problem in treating sociometric data. Canadian Jounal of Psychology, 3:234–240, 1949. [191] O. Sheyner, J. Haines, S. Jha, R. Lippmann, and J. M. Wing. Automated Generation and Analysis of Attack Graphs. In SP’02: Proc. 2002 IEEE Symposium on Security and Privacy, pages 273–284, Washington, DC, USA, 2002. IEEE Computer Society. [192] O. Sheyner and J. Wing. Tools for Generating and Analyzing Attack Graphs. In In Proc. of Workshop on Formal Methods for Components and Objects, LNCS 3188, pages 344–371, Germany, 2004. Springer-Verlag. [193] O. M. Sheyner. Scenario graphs and attack graphs. PhD thesis, Carnegie Mellon University, Pittsburgh, PA, USA, 2004. Chair-Jeannette Wing. [194] D. Sieberg. Hackers shift focus to financial gain. CNN online news, posted on 26 September 2005. http://www.cnn.com/2005/TECH/internet/09/26/identity. hacker/, visited Jan 2008. [195] G. Sindre and A. L. Opdahl. Eliciting Ssecurity Requirements by Misuse Cases. In TOOLS-Pacific 2000: Proc. 37th Int. Conference on Technology of ObjectOriented Languages and Systems, pages 120–131, Washington, DC, USA, 2000. IEEE Computer Society. [196] Skybox. Skybox Security Inc. http://www.skyboxsecurity.com/, accessed 16 Sept 2008. [197] Skybox. Skybox view platform. http://www.skyboxsecurity.com/?CategoryID= 238&ArticleID=134, accessed 30 Jan 2009. [198] M. Stamatelatos, G. Apostolakis, H. Dezfuli, C. Everline, S. Guarro, P. Moieni, A. Mosleh, T. Paulos, and R. Youngblood. Probabilistic Risk Assessment Procedures Guide for NASA Managers and Practitioners. U.S. Nasa, Office of Safety and Mission Assurance, August 2002. Version 1.1. [199] M. Stamatelatos, W. Vesely, J. Dugan, J. Fragola, J. Minarick, and J. Railsback. Fault Tree Handbook with Aerospace Applications. U.S. Nasa, Office of Safety and Mission Assurance, August 2002. Version 1.1. [200] J. G. Steiner, C. Neuman, and J. I. Schiller. Kerberos: An Authentication Service for Open Network Systems. In Proc. of the USENIX Winter Conference, pages 191–202. USENIX Association, January 1988. [201] P. Stephenson. Managing digital incidents - a background. Computer Fraud & Security, 2004(12):17–19, December 2004. [202] G. Stoneburner, A. Goguen, and A. Feringa. Risk Management Guide for Information Technology Systems. Technical Report NIST SP 800-30, National Institute Of Standards and Technology, US, July 2002. [203] X. Su, D. Bolzoni, and P. van Eck. A business goal driven approach for understanding and specifying information security requirements. In 11th Int. Workshop on Exploring Modeling Methods in Systems Analysis and Design (EMMSAD2006), pages 465–472. Presses Universitaries de Namur, June 2006. [204] S. Suehring and R. L. Ziegler. Linux Firewalls. Novell Press, US, third edition, 2005. [205] Survey. E-Crime Watch 2006, CSO Magazine and U.S. Secret Service and CERT Coordination Center and Microsoft Corporation, 2006. http://www.cert.org/ archive/pdf/ecrimesurvey06.pdf, accessed Jan 2008.
296
REFERENCES [206] L. P. Swiler, C. Phillips, D. Ellis, and S. Chakerian. Computer-attack graph generation tool. In DISCEX II’01: DARPA Information Survivability Conference and Exposition Conference and Exposition, volume 2, pages 307–321, Washington, DC, USA, June 2001. IEEE Computer Society. [207] S. J. Templeton and K. Levitt. A requires/provides model for computer attacks. In NSPW’00: Proc. of the 2000 Workshop on New Security Paradigms, pages 31–38, New York, NY, USA, 2000. ACM. [208] W. T. Tener. Discovery: An expert system in the commercial data security environment. In Proceedings of the IFIP Security Conference, 1986. [209] T. Tidwell, R. Larson, K. Fitch, and J. Hale. Modeling Internet Attacks. In Proc. of the 2001 Workshop on Information Assurance and Security, pages 54– 59, Washington, DC, USA, June 2001. IEEE Computer Society. [210] H. F. Tipton and M. Krause. Information Security Management Handbook. Auerbach Publications, New York, NY, 6th edition, May 2007. [211] J. A. Tomlin. A new paradigm for ranking pages on the world wide web. In WWW ’03: Proc. of the 12th Int. Conf. on World Wide Web, pages 350–355, New York, NY, USA, 2003. ACM. [212] J. J. Treinen and R. Thurimella. Application of the PageRank Algorithm to Alarm Graphs. In ICICS’07: Proc. of the 9th Int. Conf. on Information and Communications Security, LNCS, pages 480–494. Springer, December 2007. [213] The United States Army Functional Concept for Battle Command. U.S. Army Training and Doctrine Command, April 2007. version 1.0, TRADOC Pam 5253-3. [214] A. Valmari. The State Explosion Problem. In Lectures on Petri Nets I: Basic Models, number 1491 in LNCS, pages 429–528. Springer-Verlag, 1998. [215] W. van der Aalst and K. van Hee. Workflow Management: Models, Methods, and Systems. Cooperative Information Systems. The MIT Press, Massachusetts, USA, 2002. [216] Y. Volkovich. Stochastic Analysis of Web Page Ranking. PhD thesis, University of Twente, Enschede, April 2009. [217] J. Wack, M. Tracy, and M. Souppaya. Guideline on Network Security Testing. NIST (National Institute of Standards and Technology), Special Publication 80042, October 2003. [218] Walton-on-Thames: Insight Consulting. CRAMM User Guide, July 2005. Version 5.1. [219] L. Wang, A. Liu, and S. Jajodia. Using attack graphs for correlating, hypothesizing, and predicting intrusion alerts. Computer Communications, 29(15):2917– 2933, 2006. [220] C. Weissman. Handbook for the Computer Security Certification of Trusted Systems, chapter Chapter 10: Security Penetration Testing Guideline, pages 1–66. Center for Secure Information Technology, Naval Research Laboratory (NRL), US, October 1993. TM-8889/000/01. [221] Weka data mining software. http://www.cs.waikato.ac.nz/ml/weka/. [222] S. M. Welberg. Vulnerability management tools for COTS software - A comparison. Technical Report TR-CTIT-08-15, Centre for Telematics and Information Technology, University of Twente, Enschede, Feb. 2008. [223] M. G. Welz and A. Hutchison. Interfacing trusted applications with intrusion detection systems. In RAID ’01: Proc. 4th Int. Symp. on Recent Advances in Intrusion Detection, LNCS 2212, pages 37–53, London, UK, October 2001. Springer-Verlag.
297
REFERENCES [224] W. E. Wesely, F. F. Goldberg, N. H. Roberts, and D. F. Haasl. Fault Tree Handbook. U.S. Nuclear Regulatory Commission, January 1981. NUREG-0492. [225] R. Wieringa. Design Science as Nested Problem Solving. In DESRIST’09: Proc. of the 4th International Conf. on Design Science Research in Information Systems and Technology. ACM, May 2009. [226] R. Wieringa and J. Heerkens. The methodological soundness of requirements engineering papers: a conceptual framework and two case studies. Requirements engineering, 11(4):295–307, September 2006. [227] R. Wieringa, N. Maiden, N. Mead, and C. Rolland. Requirements engineering paper classification and evaluation criteria: A proposal and a discussion. Requirements Engineering, 11(1):102–107, March 2006. [228] L. Williams, R. Lippmann, and K. Ingols. An Interactive Attack Graph Cascade and Reachability Display. In VizSEC’07: Proc. of the Workshop on Visualization for Computer Security, pages 221–235. Springer-Verlag, October 2007. [229] L. Williams, R. Lippmann, and K. Ingols. GARNET: A Graphical Attack Graph and Reachability Network Evaluation Tool. In VizSec’08: Proc. of the 5th Int. Workshop on Visualization for Computer Security, pages 44–59, Berlin, Heidelberg, 2008. Springer-Verlag. [230] T. Wilson. Stolen Data’s Black Market. Dark Reading, posted on 07 September 2006. http://www.darkreading.com/document.asp?doc_id=103198, accessedSeptember2008, accessed Jan 2008. [231] A. Wool. A quantitative study of firewall configuration errors. Computer, 37(6):62–67, 2004. [232] C. S. Wright. A Taxonomy of Information Systems Audits, Assessments and Reviews. SANS Institute, June 2007. [233] B. Zdrnja. 0-day exploit for Internet Explorer in the wild. SANS Internet Storm Center, 10 December 2008. http://isc.sans.org/diary.html?storyid=5458, accessed Dec 2008. [234] B. Zdrnja. Mass exploits with SQL Injection. SANS Institute, 09 Jan 2008. http://isc.sans.org/diary.html?storyid=3823, accessed Jan 2008. [235] J. Zhang, P. Porras, and J. Ullrich. Highly Predictive Blacklisting. In USENIX Security ’08: Proc. of the 17th USENIX Security Symposium, pages 107–122. USENIX Association, August 2008. [236] C. C. Zou and R. Cunningham. Honeypot-Aware Advanced Botnet Construction and Maintenance. In DSN’06: Proc, of the Int. Conf. on Dependable Systems and Networks, pages 199–208, Washington, DC, USA, 2006. IEEE Computer Society.
298
SIKS Dissertation Series
1998 1998-1 Johan van den Akker (CWI) DEGAS - An Active, Temporal Database of Autonomous Objects 1998-2 Floris Wiesman (UM) Information Retrieval by Graphically Browsing Meta-Information 1998-3 Ans Steuten (TUD) A Contribution to the Linguistic Analysis of Business Conversations within the Language/Action Perspective 1998-4 Dennis Breuker (UM) Memory versus Search in Games 1998-5 E.W.Oskamp (RUL) Computerondersteuning bij Straftoemeting 1999 1999-1 Mark Sloof (VU) Physiology of Quality Change Modelling; Automated modelling of Quality Change of Agricultural Products 1999-2 Rob Potharst (EUR) Classification Using Decision Trees and Neural Nets 1999-3 Don Beal (UM) The Nature of Minimax Search 1999-4 Jacques Penders (UM) The practical Art of Moving Physical Objects 1999-5 Aldo de Moor (KUB) Empowering Communities: A Method for the Legitimate User-Driven Specification of Network Information Systems 1999-6 Niek J.E. Wijngaards (VU) Re-design of Compositional Systems 1999-7 David Spelt (UT) Verification Support for Object Database Design 1999-8 Jacques H.J. Lenting (UM) Informed Gambling: Conception and Analysis of a Multi-Agent Mechanism for Discrete Reallocation. 2000 2000-1 Frank Niessink (VU) Perspectives on Improving Software Maintenance 2000-2 Koen Holtman (TUE) Prototyping of CMS Storage Management 2000-3 Carolien M.T. Metselaar (UVA) Sociaal-Organisatorische Gevolgen van Kennistechnologie; een Procesbenadering en Actorperspectief.
299
SIKS DISSERTATION SERIES 2000-4 Geert de Haan (VU) ETAG, A Formal Model of Competence Knowledge for User Interface Design 2000-5 Ruud van der Pol (UM) Knowledge-based Query Formulation in Information Retrieval. 2000-6 Rogier van Eijk (UU) Programming Languages for Agent Communication 2000-7 Niels Peek (UU) Decision-theoretic Planning of Clinical Patient Management 2000-8 Veerle Coup (EUR) Sensitivity Analyis of Decision-Theoretic Networks 2000-9 Florian Waas (CWI) Principles of Probabilistic Query Optimization 2000-10 Niels Nes (CWI) Image Database Management System Design Considerations, Algorithms and Architecture 2000-11 Jonas Karlsson (CWI) Scalable Distributed Data Structures for Database Management 2001 2001-1 Silja Renooij (UU) Qualitative Approaches to Quantifying Probabilistic Networks 2001-2 Koen Hindriks (UU) Agent Programming Languages: Programming with Mental Models 2001-3 Maarten van Someren (UvA) Learning as problem solving 2001-4 Evgueni Smirnov (UM) Conjunctive and Disjunctive Version Spaces with Instance-Based Boundary Sets 2001-5 Jacco van Ossenbruggen (VU) Processing Structured Hypermedia: A Matter of Style 2001-6 Martijn van Welie (VU) Task-based User Interface Design 2001-7 Bastiaan Schonhage (VU) Diva: Architectural Perspectives on Information Visualization 2001-8 Pascal van Eck (VU) A Compositional Semantic Structure for Multi-Agent Systems Dynamics. 2001-9 Pieter Jan ’t Hoen (RUL) Towards Distributed Development of Large Object-Oriented Models, Views of Packages as Classes 2001-10 Maarten Sierhuis (UvA) Modeling and Simulating Work Practice BRAHMS: A Multiagent Modeling and Simulation Language for Work Practice Analysis and Design 2001-11 Tom M. van Engers (VUA) Knowledge Management: The Role of Mental Models in Business Systems Design 2002
300
2002-01 Nico Lassing (VU) Architecture-Level Modifiability Analysis 2002-02 Roelof van Zwol (UT) Modelling and searching web-based document collections 2002-03 Henk Ernst Blok (UT) Database Optimization Aspects for Information Retrieval 2002-04 Juan Roberto Castelo Valdueza (UU) The Discrete Acyclic Digraph Markov Model in Data Mining 2002-05 Radu Serban (VU) The Private Cyberspace Modeling Electronic Environments Inhabited by Privacy-concerned Agents 2002-06 Laurens Mommers (UL) Applied Legal Epistemology; Building a Knowledge-Based Ontology of the Legal Domain 2002-07 Peter Boncz (CWI) Monet: A Next-Generation DBMS Kernel for Query-Intensive Applications 2002-08 Jaap Gordijn (VU) Value Based Requirements Engineering: Exploring Innovative e-Commerce Ideas 2002-09 Willem-Jan van den Heuvel(KUB) Integrating Modern Business Applications with Objectified Legacy Systems 2002-10 Brian Sheppard (UM) Towards Perfect Play of Scrabble 2002-11 Wouter C.A. Wijngaards (VU) Agent Based Modelling of Dynamics: Biological and Organisational Applications 2002-12 Albrecht Schmidt (Uva) Processing XML in Database Systems 2002-13 Hongjing Wu (TUE) A Reference Architecture for Adaptive Hypermedia Applications 2002-14 Wieke de Vries (UU) Agent Interaction: Abstract Approaches to Modelling, Programming and Verifying Multi-Agent Systems 2002-15 Rik Eshuis (UT) Semantics and Verification of UML Activity Diagrams for Workflow Modelling 2002-16 Pieter van Langen (VU) The Anatomy of Design: Foundations, Models and Applications 2002-17 Stefan Manegold (UVA) Understanding, Modeling, and Improving Main-Memory Database Performance 2003 2003-01 Heiner Stuckenschmidt (VU) Ontology-Based Information Sharing in Weakly Structured Environments 2003-02 Jan Broersen (VU) Modal Action Logics for Reasoning About Reactive Systems 2003-03 Martijn Schuemie (TUD) Human-Computer Interaction & Presence in Virtual Reality Exposure Therapy
301
SIKS DISSERTATION SERIES 2003-04 Milan Petkovic (UT) Content-Based Video Retrieval Supported by Database Technology 2003-05 Jos Lehmann (UVA) Causation in Artificial Intelligence and Law - A modelling approach 2003-06 Boris van Schooten (UT) Development and Specification of Virtual Environments 2003-07 Machiel Jansen (UvA) Formal Explorations of Knowledge Intensive Tasks 2003-08 Yongping Ran (UM) Repair Based Scheduling 2003-09 Rens Kortmann (UM) The Resolution of Visually Guided Behaviour 2003-10 Andreas Lincke (UvT) Electronic Business Negotiation: Some Experimental Studies on the Interaction Between Medium, Innovation Context and Culture 2003-11 Simon Keizer (UT) Reasoning under Uncertainty in Natural Language Dialogue using Bayesian Networks 2003-12 Roeland Ordelman (UT) Dutch Speech Recognition in Multimedia Information Retrieval 2003-13 Jeroen Donkers (UM) Nosce Hostem - Searching with Opponent Models 2003-14 Stijn Hoppenbrouwers (KUN) Freezing Language: Conceptualisation Processes across ICT-Supported Organisations 2003-15 Mathijs de Weerdt (TUD) Plan Merging in Multi-Agent Systems 2003-16 Menzo Windhouwer (CWI) Feature Grammar Systems - Incremental Maintenance of Indexes to Digital Media Warehouses 2003-17 David Jansen (UT) Extensions of Statecharts with Probability, Time, and Stochastic Timing 2003-18 Levente Kocsis (UM) Learning Search Decisions 2004 2004-01 Virginia Dignum (UU) A Model for Organizational Interaction: Based on Agents, Founded in Logic 2004-02 Lai Xu (UvT) Monitoring Multi-Party Contracts for e-business 2004-03 Perry Groot (VU) A Theoretical and Empirical Analysis of Approximation in Symbolic Problem Solving 2004-04 Chris van Aart (UVA) Organizational Principles for Multi-Agent Architectures 2004-05 Viara Popova (EUR) Knowledge discovery and monotonicity
302
2004-06 Bart-Jan Hommes (TUD) The Evaluation of Business Process Modeling Techniques 2004-07 Elise Boltjes (UM) Voorbeeldig Onderwijs; Voorbeeldgestuurd Onderwijs, een Opstap naar Abstract Denken, Vooral voor Meisjes 2004-08 Joop Verbeek(UM) Politie en de Nieuwe Internationale Informatiemarkt, Grensregionale politi¨ele gegevensuitwisseling en digitale expertise 2004-09 Martin Caminada (VU) For the Sake of the Argument; Explorations into Argument-Based Reasoning 2004-10 Suzanne Kabel (UVA) Knowledge-Rich Indexing of Learning-Objects 2004-11 Michel Klein (VU) Change Management for Distributed Ontologies 2004-12 The Duy Bui (UT) Creating Emotions and Facial Expressions for Embodied Agents 2004-13 Wojciech Jamroga (UT) Using Multiple Models of Reality: On Agents who Know how to Play 2004-14 Paul Harrenstein (UU) Logic in Conflict. Logical Explorations in Strategic Equilibrium 2004-15 Arno Knobbe (UU) Multi-Relational Data Mining 2004-16 Federico Divina (VU) Hybrid Genetic Relational Search for Inductive Learning 2004-17 Mark Winands (UM) Informed Search in Complex Games 2004-18 Vania Bessa Machado (UvA) Supporting the Construction of Qualitative Knowledge Models 2004-19 Thijs Westerveld (UT) Using Generative Probabilistic Models for Multimedia Retrieval 2004-20 Madelon Evers (Nyenrode) Learning from Design: Facilitating Multidisciplinary Design Teams 2005 2005-01 Floor Verdenius (UVA) Methodological Aspects of Designing Induction-Based Applications 2005-02 Erik van der Werf (UM)) AI techniques for the game of Go 2005-03 Franc Grootjen (RUN) A Pragmatic Approach to the Conceptualisation of Language 2005-04 Nirvana Meratnia (UT) Towards Database Support for Moving Object data 2005-05 Gabriel Infante-Lopez (UVA) Two-Level Probabilistic Grammars for Natural Language Parsing 2005-06 Pieter Spronck (UM) Adaptive Game AI 2005-07 Flavius Frasincar (TUE) Hypermedia Presentation Generation for Semantic Web Information Systems
303
SIKS DISSERTATION SERIES 2005-08 Richard Vdovjak (TUE) A Model-driven Approach for Building Distributed Ontology-based Web Applications 2005-09 Jeen Broekstra (VU) Storage, Querying and Inferencing for Semantic Web Languages 2005-10 Anders Bouwer (UVA) Explaining Behaviour: Using Qualitative Simulation in Interactive Learning Environments 2005-11 Elth Ogston (VU) Agent Based Matchmaking and Clustering - A Decentralized Approach to Search 2005-12 Csaba Boer (EUR) Distributed Simulation in Industry 2005-13 Fred Hamburg (UL) Een Computermodel voor het Ondersteunen van Euthanasiebeslissingen 2005-14 Borys Omelayenko (VU) Web-Service Configuration on the Semantic Web; Exploring How Semantics Meets Pragmatics 2005-15 Tibor Bosse (VU) Analysis of the Dynamics of Cognitive Processes 2005-16 Joris Graaumans (UU) Usability of XML Query Languages 2005-17 Boris Shishkov (TUD) Software Specification Based on Re-usable Business Components 2005-18 Danielle Sent (UU) Test-Selection Strategies for Probabilistic Networks 2005-19 Michel van Dartel (UM) Situated Representation 2005-20 Cristina Coteanu (UL) Cyber Consumer Law, State of the Art and Perspectives 2005-21 Wijnand Derks (UT) Improving Concurrency and Recovery in Database Systems by Exploiting Application Semantics 2006 2006-01 Samuil Angelov (TUE) Foundations of B2B Electronic Contracting 2006-02 Cristina Chisalita (VU) Contextual Issues in the Design and Use of Information Technology in Organizations 2006-03 Noor Christoph (UVA) The Role of Metacognitive Skills in Learning to Solve Problems 2006-04 Marta Sabou (VU) Building Web Service Ontologies 2006-05 Cees Pierik (UU) Validation Techniques for Object-Oriented Proof Outlines 2006-06 Ziv Baida (VU) Software-aided Service Bundling - Intelligent Methods & Tools
304
for Graphical Service Modeling 2006-07 Marko Smiljanic (UT) XML Schema Matching – Balancing Efficiency and Effectiveness by Means of Clustering 2006-08 Eelco Herder (UT) Forward, Back and Home Again - Analyzing User Behavior on the Web 2006-09 Mohamed Wahdan (UM) Automatic Formulation of the Auditor’s Opinion 2006-10 Ronny Siebes (VU) Semantic Routing in Peer-to-Peer Systems 2006-11 Joeri van Ruth (UT) Flattening Queries over Nested Data Types 2006-12 Bert Bongers (VU) Interactivation - Towards an e-cology of People, our Technological Environment, and the Arts 2006-13 Henk-Jan Lebbink (UU) Dialogue and Decision Games for Information Exchanging Agents 2006-14 Johan Hoorn (VU) Software Requirements: Update, Upgrade, Redesign - Towards a Theory of Requirements Change 2006-15 Rainer Malik (UU) CONAN: Text Mining in the Biomedical Domain 2006-16 Carsten Riggelsen (UU) Approximation Methods for Efficient Learning of Bayesian Networks 2006-17 Stacey Nagata (UU) User Assistance for Multitasking with Interruptions on a Mobile Device 2006-18 Valentin Zhizhkun (UVA) Graph transformation for Natural Language Processing 2006-19 Birna van Riemsdijk (UU) Cognitive Agent Programming: A Semantic Approach 2006-20 Marina Velikova (UvT) Monotone Models for Prediction in Data Mining 2006-21 Bas van Gils (RUN) Aptness on the Web 2006-22 Paul de Vrieze (RUN) Fundaments of Adaptive Personalisation 2006-23 Ion Juvina (UU) Development of Cognitive Model for Navigating on the Web 2006-24 Laura Hollink (VU) Semantic Annotation for Retrieval of Visual Resources 2006-25 Madalina Drugan (UU) Conditional log-likelihood MDL and Evolutionary MCMC 2006-26 Vojkan Mihajlovic (UT) Score Region Algebra: A Flexible Framework for Structured Information Retrieval 2006-27 Stefano Bocconi (CWI) Vox Populi: Generating Video Documentaries from Semantically Annotated Media Repositories 2006-28 Borkur Sigurbjornsson (UVA)
305
SIKS DISSERTATION SERIES Focused Information Access using XML Element Retrieval 2007 2007-01 Kees Leune (UvT) Access Control and Service-Oriented Architectures 2007-02 Wouter Teepe (RUG) Reconciling Information Exchange and Confidentiality: A Formal Approach 2007-03 Peter Mika (VU) Social Networks and the Semantic Web 2007-04 Jurriaan van Diggelen (UU) Achieving Semantic Interoperability in Multi-agent Systems: A Dialogue-Based Approach 2007-05 Bart Schermer (UL) Software Agents, Surveillance, and the Right to Privacy: a Legislative Framework for Agent-enabled Surveillance 2007-06 Gilad Mishne (UVA) Applied Text Analytics for Blogs 2007-07 Natasa Jovanovic’ (UT) To Whom It May Concern - Addressee Identification in Face-to-Face Meetings 2007-08 Mark Hoogendoorn (VU) Modeling of Change in Multi-Agent Organizations 2007-09 David Mobach (VU) Agent-Based Mediated Service Negotiation 2007-10 Huib Aldewereld (UU) Autonomy vs. Conformity: an Institutional Perspective on Norms and Protocols 2007-11 Natalia Stash (TUE) Incorporating Cognitive/Learning Styles in a General-Purpose Adaptive Hypermedia System 2007-12 Marcel van Gerven (RUN) Bayesian Networks for Clinical Decision Support: A Rational Approach to Dynamic Decision-Making under Uncertainty 2007-13 Rutger Rienks (UT) Meetings in Smart Environments; Implications of Progressing Technology 2007-14 Niek Bergboer (UM) Context-Based Image Analysis 2007-15 Joyca Lacroix (UM) NIM: a Situated Computational Memory Model 2007-16 Davide Grossi (UU) Designing Invisible Handcuffs. Formal investigations in Institutions and Organizations for Multi-agent Systems 2007-17 Theodore Charitos (UU) Reasoning with Dynamic Networks in Practice 2007-18 Bart Orriens (UvT) On the Development an Management of Adaptive Business Collaborations 2007-19 David Levy (UM) Intimate Relationships with Artificial Partners 2007-20 Slinger Jansen (UU)
306
Customer Configuration Updating in a Software Supply Network 2007-21 Karianne Vermaas (UU) Fast Diffusion and Broadening Use: A Research on Residential Adoption and Usage of Broadband Internet in the Netherlands between 2001 and 2005 2007-22 Zlatko Zlatev (UT) Goal-Oriented Design of Value and Process Models from Patterns 2007-23 Peter Barna (TUE) Specification of Application Logic in Web Information Systems 2007-24 Georgina Ramrez Camps (CWI) Structural Features in XML Retrieval 2007-25 Joost Schalken (VU) Empirical Investigations in Software Process Improvement 2008 2008-01 Katalin Boer-Sorbn (EUR) Agent-Based Simulation of Financial Markets: A Modular, Continuous-Time Approach 2008-02 Alexei Sharpanskykh (VU) On Computer-Aided Methods for Modeling and Analysis of Organizations 2008-03 Vera Hollink (UVA) Optimizing Hierarchical Menus: A Usage-Based Approach 2008-04 Ander de Keijzer (UT) Management of Uncertain Data - Towards Unattended Integration 2008-05 Bela Mutschler (UT) Modeling and Simulating causal Dependencies on Process-Aware Information Systems from a Cost Perspective 2008-06 Arjen Hommersom (RUN) On the Application of Formal Methods to Clinical Guidelines, an Artificial Intelligence Perspective 2008-07 Peter van Rosmalen (OU) Supporting the Tutor in the Design and Support of Adaptive e-Learning 2008-08 Janneke Bolt (UU) Bayesian Networks: Aspects of Approximate Inference 2008-09 Christof van Nimwegen (UU) The Paradox of the Guided User: Assistance can be Counter-Effective 2008-10 Wauter Bosma (UT) Discourse oriented summarization 2008-11 Vera Kartseva (VU) Designing Controls for Network Organizations: A Value-Based Approach 2008-12 Jozsef Farkas (RUN) A Semiotically Oriented Cognitive Model of Knowledge Representation 2008-13 Caterina Carraciolo (UVA) Topic Driven Access to Scientific Handbooks 2008-14 Arthur van Bunningen (UT) Context-Aware Querying; Better Answers with Less Effort 2008-15 Martijn van Otterlo (UT) The Logic of Adaptive Behavior: Knowledge Representation and Algorithms for the Markov Decision Process Framework in First-Order Domains
307
SIKS DISSERTATION SERIES 2008-16 Henriette van Vugt (VU) Embodied Agents from a User’s Perspective 2008-17 Martin Op ’t Land (TUD) Applying Architecture and Ontology to the Splitting and Allying of Enterprises 2008-18 Guido de Croon (UM) Adaptive Active Vision 2008-19 Henning Rode (UT) From Document to Entity Retrieval: Improving Precision and Performance of Focused Text Search 2008-20 Rex Arendsen (UVA) Geen Bericht, Goed Bericht. Een Onderzoek naar de Effecten van de Introductie van Elektronisch Berichtenverkeer met de Overheid op de Administratieve Lasten van Bedrijven 2008-21 Krisztian Balog (UVA) People Search in the Enterprise 2008-22 Henk Koning (UU) Communication of IT-Architecture 2008-23 Stefan Visscher (UU) Bayesian Network Models for the Management of Ventilator-Associated Pneumonia 2008-24 Zharko Aleksovski (VU) Using Background Knowledge in Ontology Matching 2008-25 Geert Jonker (UU) Efficient and Equitable Exchange in Air Traffic Management Plan Repair using Spender-signed Currency 2008-26 Marijn Huijbregts (UT) Segmentation, Diarization and Speech Transcription: Surprise Data Unraveled 2008-27 Hubert Vogten (OU) Design and Implementation Strategies for IMS Learning Design 2008-28 Ildiko Flesch (RUN) On the Use of Independence Relations in Bayesian Networks 2008-29 Dennis Reidsma (UT) Annotations and Subjective Machines - Of Annotators, Embodied Agents, Users, and Other Humans 2008-30 Wouter van Atteveldt (VU) Semantic Network Analysis: Techniques for Extracting, Representing and Querying Media Content 2008-31 Loes Braun (UM) Pro-Active Medical Information Retrieval 2008-32 Trung H. Bui (UT) Toward Affective Dialogue Management using Partially Observable Markov Decision Processes 2008-33 Frank Terpstra (UVA) Scientific Workflow Design; Theoretical and Practical Issues 2008-34 Jeroen de Knijf (UU) Studies in Frequent Tree Mining 2008-35 Ben Torben Nielsen (UvT) Dendritic Morphologies: Function Shapes Structure
308
2009 2009-01 Rasa Jurgelenaite (RUN) Symmetric Causal Independence Models 2009-02 Willem Robert van Hage (VU) Evaluating Ontology-Alignment Techniques 2009-03 Hans Stol (UvT) A Framework for Evidence-based Policy Making Using IT 2009-04 Josephine Nabukenya (RUN) Improving the Quality of Organisational Policy Making using Collaboration Engineering 2009-05 Sietse Overbeek (RUN) Bridging Supply and Demand for Knowledge Intensive Tasks - Based on Knowledge, Cognition, and Quality 2009-06 Muhammad Subianto (UU) Understanding Classification 2009-07 Ronald Poppe (UT) Discriminative Vision-Based Recovery and Recognition of Human Motion 2009-08 Volker Nannen (VU) Evolutionary Agent-Based Policy Analysis in Dynamic Environments 2009-09 Benjamin Kanagwa (RUN) Design, Discovery and Construction of Service-Oriented Systems 2009-10 Jan Wielemaker (UVA) Logic Programming for Knowledge-Intensive Interactive Applications 2009-11 Alexander Boer (UVA) Legal Theory, Sources of Law & the Semantic Web 2009-12 Peter Massuthe (TUE, Humboldt-Universitaet zu Berlin) Perating Guidelines for Services 2009-13 Steven de Jong (UM) Fairness in Multi-Agent Systems 2009-14 Maksym Korotkiy (VU) From Ontology-Enabled Services to Service-Enabled Ontologies (Making Ontologies Work in e-Science with ONTO-SOA) 2009-15 Rinke Hoekstra (UVA) Ontology Representation - Design Patterns and Ontologies that Make Sense 2009-16 Fritz Reul (UvT) New Architectures in Computer Chess 2009-17 Laurens van der Maaten (UvT) Feature Extraction from Visual Data 2009-18 Fabian Groffen (CWI) Armada, An Evolving Database System 2009-19 Valentin Robu (CWI) Modeling Preferences, Strategic Reasoning and Collaboration in Agent-Mediated Electronic Markets 2009-20 Bob van der Vecht (UU) Adjustable Autonomy: Controling Influences on Decision Making 2009-21 Stijn Vanderlooy (UM) Ranking and Reliable Classification 2009-22 Pavel Serdyukov (UT)
309
SIKS DISSERTATION SERIES Search For Expertise: Going beyond Direct Evidence 2009-23 Peter Hofgesang (VU) Modelling Web Usage in a Changing Environment 2009-24 Annerieke Heuvelink (VUA) Cognitive Models for Training Simulations 2009-25 Alex van Ballegooij (CWI) RAM: Array Database Management through Relational Mapping 2009-26 Fernando Koch (UU) An Agent-Based Model for the Development of Intelligent Mobile Services 2009-27 Christian Glahn (OU) Contextual Support of social Engagement and Reflection on the Web 2009-28 Sander Evers (UT) Sensor Data Management with Probabilistic Models 2009-29 Stanislav Pokraev (UT) Model-Driven Semantic Integration of Service-Oriented Applications 2009-30 Marcin Zukowski (CWI) Balancing Vectorized Query Execution with Bandwidth-optimized Storage 2009-31 Sofiya Katrenko (UVA) A Closer Look at Learning Relations from Text 2009-32 Rik Farenhorst (VU) and Remco de Boer (VU) Architectural Knowledge Management: Supporting Architects and Auditors 2009-33 Khiet Truong (UT) How Does Real Affect Affect Affect Recognition In Speech? 2009-34 Inge van de Weerd (UU) Advancing in Software Product Management: An Incremental Method Engineering Approach 2009-35 Wouter Koelewijn (UL) Privacy en Politiegegevens; Over Geautomatiseerde Normatieve Informatieuitwisseling 2009-36 Marco Kalz (OU) Placement Support for Learners in Learning Networks 2009-37 Hendrik Drachsler (OU) Navigation Support for Learners in Informal Learning Networks 2009-38 Riina Vuorikari (OU) Tags and Self-organisation: A Metadata Ecology for Learning Resources in a Multilingual Context 2009-39 Christian Stahl (TUE, Humboldt-Universitaet zu Berlin) Service Substitution – A Behavioral Approach Based on Petri Nets 2009-40 Stephan Raaijmakers (UvT) Multinomial Language Learning: Investigations into the Geometry of Language 2009-41 Igor Berezhnyy (UvT) Digital Analysis of Paintings 2009-42 Toine Bogers (UvT) Recommender Systems for Social Bookmarking
310