Nucleic Acids Research, 2003, Vol. 31, No. 2 683±689 DOI: 10.1093/nar/gkg154
Finding weak similarities between proteins by sequence pro®le comparison Anna R. Panchenko* Computational Biology Branch, National Center for Biotechnology Information, National Library of Medicine, National Institutes of Health, Building 38A, Room 8N805, 8600 Rockville Pike, Bethesda, MD 20894, USA Received September 4, 2002; Revised and Accepted November 15, 2002
ABSTRACT To improve the recognition of weak similarities between proteins a method of aligning two sequence pro®les is proposed. It is shown that exploring the sequence space in the vicinity of the sequence with unknown properties signi®cantly improves the performance of sequence alignment methods. Consistent with the previous observations the recognition sensitivity and alignment accuracy obtained by a pro®le±pro®le alignment method can be as much as 30% higher compared to the sequence±pro®le alignment method. It is demonstrated that the choice of score function and the diversity of the test pro®le are very important factors for achieving the maximum performance of the method, whereas the optimum range of these parameters depends on the level of similarity to be recognized. INTRODUCTION The observation that structures and functions of proteins can be inferred by protein sequence comparisons led to the fast development of sequence alignment methods. It has been shown that at short evolutionary distances structures and sequences of proteins are very similar and easily aligned by pairwise sequence alignment methods (1,2). For more distantly related proteins, where only certain sequence features or structural motifs are conserved, the similarity between two proteins cannot easily be recognized by pairwise alignment methods. There are different ways to infer the connections between protein sequences in the sequence space; one group of methods tries to relate the two sequences being matched through the third sequence (3,4), while others detect increasingly divergent members of a given family by constructing multiple sequence alignments (5±10). Multiple alignments of related sequences properly translated into position-speci®c score matrices (PSSMs), pro®les or hidden Markov models (HMMs) indeed contain a lot of information about the conservation patterns and statistical properties of protein families. As a result, the sensitivity of methods which use pro®les/HMMs in the database search is shown to be several times higher compared to the pairwise methods (4,11). *Tel: +1 301 435 5891; Fax: +1 301 435 7794; Email:
[email protected]
The aforementioned pro®le search methods compare a single test sequence to a template pro®le, which in some cases can result in missing some weak sequence similarities. For example, if the test sequence and its related sequences are distant from the template family, the template pro®le would not be sensitive enough to recognize the test sequence as belonging to the same template family. To increase the radius of detection of diverse family members one would want to explore the sequence space around the test sequence and compare two groups of sequences or two pro®les to each other. Several methods have been reported lately which align two protein family models with each other. For example, in the progressive and iterative multiple alignment methods two groups of sequences have been compared using the weighted `sum of pairs' score (12,13). This measure can be pretty successful in aligning two closely related families, but fails in other cases since it does not take into account the statistical properties of the sequence groups. More sophisticated measures of comparing two pro®les or HMMs have been proposed recently and proved to be successful in detecting weak similarities between conserved protein regions or for the classi®cation of signal peptides (14,15). In the most recent papers the relative success of pro®le±pro®le alignment methods over sequence±pro®le alignment methods has been reported (16,17). For example, Yona et al. (17) used information theory to derive the pro®le±pro®le similarity score and found that the relative improvement of their pro®le±pro®le comparison method with respect to PSIBLAST is almost the same as the improvement of PSIBLAST compared to BLAST in detecting the SCOP family relationships within one superfamily. Despite the fact that pro®le±pro®le comparison methods have been used successfully in genome annotation, fold recognition and protein classi®cation (18±20), there has been a lack of evidence that pro®le±pro®le scoring schemes outperform sequence±pro®le scoring schemes. To prove the latter, one would need to make a direct comparison of two scoring schemes using the same alignment algorithm, set of parameters and protein family models. This work introduces a new core-based pro®le±pro®le alignment method, which is tested with different similarity measures for comparing two columns of pro®les. The performance of the method is evaluated with respect to sensitivity and speci®city of the database search and the accuracy of obtained alignments using the benchmark of structurally similar protein domains or domains from the same SCOP classi®cation level. Finally, the test procedure enables
684
Nucleic Acids Research, 2003, Vol. 31, No. 2
the systematic analysis of the difference in performance produced by including the test pro®le term in the similarity measure and examines the factors this difference can be attributed to.
MATERIALS AND METHODS A benchmark for comparison of different score functions The essential idea in designing the benchmark is to measure the ability of different score functions to ®nd evolutionary relationships described by SCOP or correctly identify similar structures de®ned by the VAST algorithm. To obtain a representative set of protein domains, ®rst a non-redundant set of 1310 domains has been selected by single linkage clustering based on a BLAST P value of 10e±7 or less (21). Domain boundaries identi®ed using a compactness algorithm (22) are taken from MMDB (23), which is distributed with ENTREZ (http://www.ncbi.nlm.nih.gov/Entrez/). Each selected domain in the list of 1310 domains (list1310) has at least ®ve structure neighbors and its domain de®nition agrees with the SCOP domain de®nition to a threshold of 80% mutual overlap. The list of structure neighbors is distributed with Entrez and structure±structure alignments in this set are computed by the VAST algorithm (24,25) based on complete chains or domains. To select a subset of test protein sequences for the experiments, the domains formed from only a one chain continuous segment are selected from list1310 ensuring that these test domains have at least one VAST neighbor and at least one member from the same SCOP family level in list1310. Trying not to use any information about domain boundaries, the full-length chain sequences are extracted from the corresponding test domains, which are guaranteed not to exceed a length of 250 residues for the purpose of speeding up the search process. As a result, the test set has been reduced to the 47 test sequences listed in the legend to Figure 1. According to the SCOP classi®cation (26) the structures of domains derived from 47 test protein chains spanned four different classes, 36 folds and 41 superfamilies and by this criterion can be considered a diverse sample of protein domains. Test sequences can be found at http:// www.ncbi.nlm.nih.gov/Entrez/ and query/template alignments can be obtained upon request. Fold recognition sensitivity and alignment accuracy To ®nd all relationships between 47 test sequences and their homologous (as de®ned by SCOP) or structurally similar (as de®ned by VAST) domains in list1310, each test sequence was compared against the database of 1310 domain structures using the core-based alignment algorithm (27,28). The true positive rate was calculated as the number of true positives found during the search above some Z-score threshold divided by the overall number of true positives. True positives here were de®ned as domains (out of list1310) with the same fold/ superfamily/family or VAST assignments as a test domain. In cases where the test chain was composed of more than one domain (three of 47 test cases), the true positives for this test entry were identi®ed as true positives for all domains included in the chain.
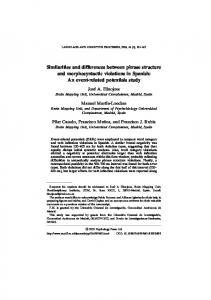
The false positive rate was calculated similarly to the number of false positives found divided by the overall number of false assignments (database size minus number of true positives). The Z-score was measured in terms of the momenta of the score distribution of random sequences with a given composition as a difference between the obtained alignment score and the expected score expressed in units of standard deviation of the random score distribution. To compare the search sensitivity of different methods, another measure, the truncated receiver operating characteristic (ROC), has been used as well (29,30). ROCn was calculated as the sum of the number of true positives found at 1, 2, 3, ¼, n false positive levels (ti) divided by the overall number of true positives in the database (T) (30): ROCn = (SI = 1,¼, n ti)/nT. The distribution of ROC values has been shown to be approximately normal and its standard deviation can be calculated analytically as s2(Rn) = (SI = 1,¼, n (tn + 1 ± ti)2)/n2T2 (30). The accuracy of obtained alignments, namely accuracy of molecular models of the test domains implied by the alignments of their sequences to the structures of the identi®ed template domains, was calculated using the contact speci®city. Contact speci®city is de®ned as the fraction of correctly predicted non-local residue contacts in the molecular model which are also present in the experimental structure of the test domain (31): ACSpc = Ncp/Np. Here Ncp is the number of correctly predicted contacts for residues separated along the Ê chain by at least ®ve peptide bonds and having Ca atoms 12. As can be seen from Figure 2, at around four to six amino acid types per column, the recognition improvement is high enough for all levels of the SCOP hierarchy, as well as structure neighbors, which is consistent with the optimal range of diversity reported earlier (41). More precisely, the desirable range of diversity depends on the level of similarity to be recognized. For example, similarity at the SCOP family level is more easily detected when the informativeness of the pro®le is not too low and diversity is not too high, whereas families encompassing more diverse members are more suitable for detecting the similarity at the SCOP superfamily, fold and VAST levels. Improvement in alignment accuracy To assess different score functions for their ability to produce accurate alignments, the accuracies of models predicted by obtained sequence±pro®le or pro®le±pro®le alignments have
Figure 2. Difference in recognition of VAST structure neighbors or SCOP fold/superfamily/family categories between sequence±pro®le and pro®le± pro®le alignment methods is plotted against the diversity of the test pro®le. Diversity is measured as the average number of independent observations (average number of different amino acid types per column of the alignment). Improvement in recognition is calculated as the average difference in ROC100 statistics between the pro®le±pro®le alignment method with scorefunction 2 and the sequence±pro®le alignment method.
Table 2. Average contact speci®city of alignments between test sequences and template domains detected with Z-score > 7 from the same fold SCOP category is shown for each bin of similarity between test and template domains Identity (%)
Without test pro®le
Score function 1 2
3
0±5 5±10 10±15 15±20 20±25 25±30 30±40 >40
0.19 0.26 0.31 0.34 0.50 0.63 0.74 0.79
0.26 0.33 0.33 0.39 0.54 0.58 0.75 0.79
0.29 0.34 0.38 0.40 0.51 0.60 0.66 0.85
0.16 0.31 0.33 0.40 0.53 0.57 0.75 0.77
Similarity between test and template domains is calculated as the average percent identity in structure±structure alignments, given that the test and template structures are found to be VAST neighbors. For the purposes of comparison between different score functions contact speci®city was averaged only over those test±template pairs found by all four types of score functions.
been calculated. Table 2 shows the contact speci®city values for models based on the detected domains from the same SCOP fold category averaged over different bins of sequence similarity. As can be seen from this table, alignment accuracy strongly depends on the sequence similarity between the test and template domains, which is consistent with the previous observations that accuracy of the alignments decreases with the evolutionary distance (39,42). In our case, contact speci®city ranges from ~0.20 for distantly related pairs to ~0.90 for pairs with >40% sequence identity. To compare the alignment accuracy of models produced with different score functions, contact speci®city values are listed for SCOP folds found by all four tested score functions (Table 2). In other words, additional folds found by pro®le±
688
Nucleic Acids Research, 2003, Vol. 31, No. 2
pro®le score functions are not considered in this analysis. It is clear from this table that the alignment accuracy improves when test pro®le is used in the score calculation. Below 25% of sequence identity between the test and template domains, the improvement is maximum and models obtained with pro®le±pro®le score functions are up to 30% more accurate than the models obtained with the original sequence±pro®le score function. The same pattern is observed with another measure of alignment accuracy, RMSD (not shown). Above this level of similarity all four score functions and, in general, all sequence alignment methods yield accurate alignments. Analysis of the obtained results showed that the pro®le± pro®le alignment algorithm can sometimes detect relationships between different SCOP families that cannot be easily inferred from the conventional sequence analysis. For example, tryptophan biosynthesis enzyme (2tsyA) and OMP-decarboxylase (1dbtA) belong to two different families of the same SCOP superfamily of ribulose phosphate-binding barrels. Although these proteins are very structurally similar and carry the same type of enzymatic activity (lyases), they act on different substrates (EC 4.2.1.20 and EC 4.1.1.23) and do not share signi®cant sequence similarity (11% sequence identity). In order to detect interlinks between these two families, a CD search versus a non-redundant sequence database (43) has been performed and it has been found that sequences detected by both families constitute