sexually-propagated higher organisms (PATERSON et al. 1988, LANDER .... for the recurrent parent (E) genome, hatched bars indicate heter- ozygosity, and ...
Copyright 0 1990 by the Genetics Society of America
Fine Mapping of Quantitative Trait LociUsing Selected Overlapping Recombinant Chromosomes,in an Interspecies Cross of Tomato Andrew H. Paterson,*” Joseph W. DeVerna? Brenda Lanini” and Steven D. Tanksley* *Department of Plant Breeding and Biometry, Cornell University, Ithaca, NewYork 14853, and TCampbell Institute of Research and Technology, Davis, Calqornia 95616 Manuscript received August 18, 1989 Accepted for publication November 24, 1989
ABSTRACT Quantitative trait loci (QTLs) have been mapped to small intervals along the chromosomes of tomato (Lycopersicon esculentum), by a method we call substitution mapping. The size of the interval to which a QTL can be mapped is determined primarily by the number and spacing of previously mapped genetic markers in the region surrounding the QTL. We demonstrate the method using tomato genotypes carrying chromosomal segments from Lycopersicon chmielewskii, a wild relative of tomato with high soluble solids concentration but small fruit and low yield. Different L. chmielewskii chromosomal segments carrying a common restriction fragment length polymorphism were identified, and their regions of overlap determined usingallavailable genetic markers. The effect of these chromosomal segments on soluble solids concentration, fruit mass, yield, and pH, was determined in the field. Many overlapping chromosomal segments had very different phenotypic effects, indicating QTLs affecting the phenotype(s) to lie in intervals of as little as 3 cM by which the segments differed. Some associations between different traits were attributed to close linkage between two or more QTLs, rather than pleiotropic effects of a single QTL: in such cases, recombination should separate desirable QTLs from genes with undesirable effects. The prominence of such trait associations in wide crosses appears partly due to infrequent reciprocal recombination between heterozygous chromosomal segments flanked by homozygous regions. Substitution mapping is particularly applicable to gene introgression from wild to domestic species, and generally useful in narrowing the gap between linkage mapping and physical mapping of QTLs.
C
includesgeneswithundesirableeffects,which suONTINUOUS variation in phenotype, observed for most traits in nature and agriculture,is d u e percede agricultural utilityof resident desirable genes to independent segregation of many different “poly(TANKSLEY a n d HEWITT 1988). In physical terms, 20 genes”whicheachhave asmalleffect (JOHANSSEN cM of the tomato genome represents an average of 1909; NILSSON-EHLE1909; EAST 19 15), together with 12 million base pairs of DNA (GANAL,YOUNGand environmental variation. In thepast half-century, nuTANKSLEY 1989), a quantity beyond the capability of merous investigators have inferred particular polysecurrent systems for manipulatingintactDNA genestooccuratdiscrete“quantitativetraitloci” quences. The resolution of Q T L mapping might be to easily de(QTLs), by fortuitousgeneticlinkage improved by using larger populations (LANDER and tectedmarkers. Densely populatedgeneticlinkage BOTSTEIN 1989),withmorerecombinantchromomaps,basedonputativelyselection-neutralDNA of somes contributing to more accurate placement markers (BOTSTEINet al. 1980), have recently made QTLs. However, incrementalincreases in investment possible the systematicmapping of Q T L s t o -20 yield diminishing returns of new information. centiMorgan (cM) regions throughout the genomes of a Herein, we demonstratesubstitutionmapping, sexually-propagated higher organisms (PATERSONet method for fine mapping of QTLs previously localal. 1988, LANDERa n d BOTSTEIN1989). ized to chromosomal regions, using tomato as a model Study and manipulation of quantitative traits are system. Substitution mapping is analogous to deletion greatlyfacilitated by mappingQTLstoparticular mapping of geneticloci in human (KUNKELet ai. 1986; genomic regions, but resolution of 20 cM is insuffiPAGE 1986), in which altered phenotype is associated cient for many purposes. In plant breeding, for exwith loss of a specific chromosomal region. However, ample, a 20 cM region of an interspecies cross often substitutionmapping utilizesmeiotic recombinants, rather than deletions. By prior Q T L analysis (such as ’ Currentaddress: E. 1. duPontdeNemours,Wilmington, Delaware 19880-0402. that employed in PATERSONet al. 1988), a restriction T h e publication costs of this article were partly defrayed by the payment fragment length polymorphism (RFLP) is identified of page charges. This article must therefore be hereby marked “advertisement” in accordance with 18 U.S.C. 5 1734 solely to indicate this fact. which lies near a Q T L of interest. Different chromoGenetics 124: 795-742 (March, 1990)
736
A. Paterson et al.
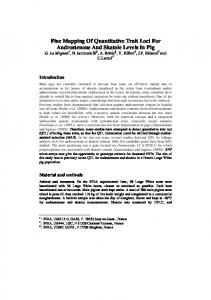
somal segments carrying the RFLPare identified, and their regionsof overlap determinedusing all available genetic markers. Phenotypic effects of each chromosomal segment are determined by Q T L analysis of segregatingprogeny populations. Effects shared by different segments are attributed to QTLs in regions shared by those segments, while effects unique to a segment are attributed to QTLs in a region uniqueto that segment. Consequently, the resolution of substitutionmapping is determined by the number and spacing of geneticmarkers available to distinguish overlapping recombinant segments. For the current study, six genetic stocks were developed. These stocks were heterozygous for 2 to 4 chromosome segments hypothesized to carry QTLs increasing fruit soluble solids concentration. Effects of each recombinant chromosome on soluble solids and other fruittraits were determined, in segregating populations of about 150 self-pollinated progeny from each genetic stock. Many overlapping chromosomal segments had very different phenotypic effects, indicating QTLs affecting the phenotype(s) to lie in intervals ofas little as 3 cM by which the segments differed. Some associations between different traitswere attributed to close linkage between two or more QTLs, rather than pleiotropic effects of a single QTL: in such cases, recombination should separate desirable QTLs from genes with undesirable effects. T h e prominence of such trait associations in wide crosses appears to result from diminished reciprocal exchange, between heterozygous chromosomal segments flanked by homozygous regions. Substitution mapping is particularly applicable to gene introgression from wild to domestic species, and generally useful in narrowing the gap between linkage mapping and physical mapping of QTLs. MATERIALS AND METHODS Construction of genetic stocks: The genetic composition of 237 backcross progeny of L. esculentum cv. UC82B (E; recurrent) X L. chmielmskii accession LA1063 (CL), was determined previously using70 DNA markers spanning 852 cM at intervals averaging 14.3 cM. Together with phenotypic data, this was used to construct a first-generation map of genomic regions affecting soluble solids concentration, mass per fruit and fruit pH (PATERSONet al. 1988). About 20BClindividuals,each carrying different CL segments associated with elevated soluble solids concentration but not with reduced mass per fruit,were selected. [For example, plant #121 (Figure la) carried CL segments on chrs. 1, 2, 5, and 6 which were associated with increased soluble solids,but was free of CLsegments on chromosomes 4, 6, 7 , 9, and 1 1 which were associated with reduced mass per fruit.] From each of these BCl plants, 10 self-pollinated (BCl F2) progeny were grown in the field. Several of the RClF2 familiesshowed partial or complete sterility, and were discarded. From the remaining families,each plant was genotvped. Individuals retaining thetarget CL segments, but carrying a minimal number of nontarget segments, were selected. [For example, plant #12 1.OS carried
I
a) BC1 #121
b) BClF2 #121.08
c ) BC2F1 #121.08.20
FIGURE1 .-Pedigree of a single BCPFl plant, based on genotype at DNA markers. Genotype of an interval is inferred from genotype at markers flanking the interval. Open bars represent homozygosity for the recurrent parent (E) genome, hatched bars indicate heterozygosity, and solid bars are homozygosity for the donor parent (CI,) genome. Dotted bars indicate intervals in which a recombination has occurred, as evidenced by different genotype at adjacent markers. Arrows indicate target regions for substitution mapping.
each of the four target segments from plant #12 1, and was heterozygous at each of three nontarget segments (Figure 1b), making it feasibleto eliminate all ofthe latter by another backcross.] A total of six BClF2 plants, from five different BClfamilies, were selected and backcrossed(asmales) a second time to E. Each plant in the six BCPFl populations (1 2-64 plants each; total -200) was genotyped. From each population, one plant was selected which retained the target CL segments but was free of the nontarget segments. [For example, one of 64 individuals grown from the backcross of 12 1 .OS to E carried each ofthe fourtarget segments, and none of the remaining nontarget segments known (Figure IC).]
Six BC2 individuals with different genotypes, each from a different BC2 population, and derived from five different BCl plants, were used in substitution mapping. These individuals were known to retain two to fourunlinked segments from CL. These segments were characterized in detail, using all available D N A markers polymorphic in this cross. Further, in gaps between markers of 210 cM (based on the et al. 1988), additional markers were BCl map; PATERSON scored (where available) to verify the genotype inferred for the interval. Phenotyping: Self-pollinated progeny (1 25-1 5 1individuals) from six BC2Fl plants (above) were transplanted to the field at Davis, California, on 18 April 1988, in a completely randomized design with 35 cm between plants and 175 cm between rows. Average mass per fruit,soluble solids concentration ('Brix), and fruit pH were determined as described in TANKSLEY and HEWII" (1988). Plant yield was measured as total weight of fruit on each plant, when most fruit were mature.
Fine Mapping of QTLs
Genotyping and linkage analysis: RFLP genotypes were and HEWITT(1 988), determined as described in TANKSLEY except that probes were labeled by random primer extension (FEINBURGandVOCELSTEIN1983). Linkage analysis was performed on a VAX 8530, using MapMaker (LANDER et al. 1987). Quantitative trait analysis: Effects of each CL segment onquantitativetraitswere determined using SAS (SAS Institute 1988), by analysis of variance. The two degrees of freedom for genotype at each locus were partitioned into the additive effect {(CC-EE)/P}, and the dominance deviation {EC-[(CC-EE)/2]}, where EE and CC represent the E and CL homozygotes, and EC the heterozygote. T h e 4 d.f. for two-way interactions between unlinked fragments were partitioned into additive X additive, additive X dominant, dominant X dominant, and dominant X additive effects. Log transformation of fruit size was used to improve normality. To compare recombinant segments which overlap only in a small region, we determined effects at a single marker in the overlapping region, rather thanusing interval analysis at flanking markers (LANDER and BOTSTEIN1989). Most segments showed little recombination, hence underestimation of allele effects due to recombination between marker and QTL (LANDER and BOTSTEIN1989), is small. For an experimentwise confidence level of 95% (e.g., 5 5 % chance of > I false positive in n independent trials), the singlecomparison confidence level x must be such that 1 - (x)" ? 0.05. In substitution mapping, n is the numberof independent segments assayed in a population, since inference is based on genotype at a predetermined point on each segment. For n = 2, x is -97.5%, and for n = 4, x is -99%, for 95% confidence experimentwise. RESULTS
Segregation: Although segregationof some CL segments followed the Mendelian expectation, regions of chromosomes 2,5, and7 showed significant deviations (Figure 2). Such segregational distortion is common in matings across species boundaries (TANKSLEY 1983; ZAMIRand TADMOR 1986; PATERSON et al. 1988), and suggests reduced fitness of particular combinations of factors from the distantly-related parents. By substitution mapping, such factors can be localized to small chromosomal regions. For example, one segment of chromosome 2 shows an excess of heterozygotes (Figure 2b-far right column of data). The segment segregatingabnormally(F) includes the chromosomal region marked by Cab-I, while an overlapping segment (G) is free of this region and segregates normally. Hence, we infer a factor distorting segregation to lie near Cab-I, in the region unique to F. Recombination: Recombination between pairs of markers was generally less in the BC2F2 (herein) than in the BC1 generation (PATERSON et al. 1988). The intervals measured in both studies totaled 134 (+ 10) cMin BC2F2, us. 209 ( f 1 0 ) cMin BCl, a highly significant reduction. The two studies differ, in that biparental transmission of recombinant gametescould be measured in BC2F2, while only paternal transmission could bemeasured inBC1. This difference is unlikely to explain the observed reduction,as we have
737
previously found biparental (F2) transmission to yield a larger recombinationfractionthanpaternal (BC) transmission (PATERSON et al. 1988).However,reduced recombination in regions heterozygous for donor (e.g., CL) chromosomal segments has been previously associated with elimination of much of the donor genome by backcrossing (RICK1969), such as was done to develop the stocks used herein. It may be noteworthy that the only putatively intact chromosome studied, chromosome 5 , showed similar recombination in both generations (44 cM in BC2F2 us. 52 cMin BC1, a nonsignificant difference).In contrast, heterozygous chromosome segments flanked by homozygous regions showed reductions in recombination of fourfold or more in BC2F2 (Figure 2b, 6 cM us. 23 cM for CABI-CD35; Figure 2d, 2 cM us. -15 cM for CD67-TGI 18). We postulate that chiasmata formation may be more commonin homozygous regions, at the expense of recombination in heterozygous segments (see DISCUSSION). QTL allele effects: Small Q T L allele effects reached statistical significance in this study, due to fewer Q T L segregating and a smaller penalty for experimentwise error. Effects of as little as 0.38"Brix and 0.07 pH units reached significance in BC2F2 (Figure 2), us. 0.83"Brix and 0.096 pH in the BC1 (PATERSON et al. 1988). Allele effects on mass per fruit are moredifficult to compare across generations, because these effects are proportional to absolute fruit size (WRIGHT 1968).In absolute units, the smallest effect on mass per fruit to reach significance here was -3.7 g, us. -3.5 g in BC1. In the BC1, with average mass per fruit of 17.5 g, the reduction of 3.5 g represented -20%. However, because average mass per fruit in BC2F2 was 39.5 g, a reduction of 3.7 g represented only -9%, a smaller relative effect. Similarly, a QTL might have different absolute effects, but similar relative effects, in populations with differentaverage mass perfruit. For example, chromosome 2 factors inferred to be common to segments F and G (Figure 2b-also see below), showed additive effects of -8.1 and -4.4 g, respectively. Average mass per fruit of the corresponding populations was 44.6 and 25.7 g, respectively, hence this region reduced fruit mass by -20% in each case. QTL substitution maps: By observing the shared versus unique properties of overlapping recombinant chromosomes, several QTLs could be assigned to small CL intervals bywhich the chromosomes differed. Because each of the five chromosomal regions studied showed effects on more than one trait (Figure 2), substitution mapping also provided evidence useful in evaluatingwhether close linkage or pleiotropy caused these associations. The TG19-TG27 region of chromosome 1 was previously associated with a nonsignificant increase in
738
A. Paterson et al.
Chromosome 7 DOMINANCE DEVIATION
222* 1218'
1667"
n
m
I n 3
c
u
u
mmmK c m m u
r(
m
r
5
I
I
:e:$ e::
WN W "
I
-0.08
29:77:33
0.05
128:68:35
-0.08"
30:81:38
&
(b) Chromosome 2
E-
DOMINANCE DEVIATION
ADDITIVE EFFECT
BRIX
J
0.22
K
0.08
L
0.46"
r ,m
/ i /
m
FT.MASS Y I E L D pH -434" -0,003 -4.R.' -2.3
-486
-7.8**
-972*
BRIX
0.22
FT.MASS E E Y:pEIHC EL : CDC -0.06 183 2.7
36:59:26
-0.03
0.38'
3.5
484
0.04
32:61:33
0.02
0.02
2.1
304
-0.001
34:70:35
m
(e) Chromosome 7 FDDITIVE EFFECT DOMINANCE DEVIATION
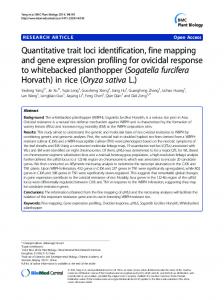
solids of about 0.6"Brix (PATERSONet al. 1988). In the present study, phenotypiceffects were determined for five CL segments which overlapped at TG29 (Figure 2a). A significant additive effect on solids of +0.58"Brix was unique to the only segment (E) carrying the CL region from TG258 to beyond TG27, a distance of at least 2 cM. Reductions of fruit mass and yield were found for three segments (C,D, E), which differ from thetwo segments (A, B) not showing these effects, in that they carry a CL interval of about 3 cM, from TG245-TG255. Significant dominance deviation (but nonsignificant additive effect)for increased yield
I
FIGURE 2."Substitution mapping of QTLs, in 5 genomic regions of L. esculentum X L. chmielewskii BC2F2. (a) Effectsat TG19 linked to different chromosome I recombinants. (b) Effectsat CD35 linked to different chromosome 2 recombinants. (c) Effects at TC32 linked to different chromosome 5 recombinants. (d) Effectsat CD67 linked to different 6 recombinants. chromosome (e) Effects at TG128 linked to different chromosome 7 recombinants. Recombinant chromosome segments are designated A-N, immediately to the right of each segment. Genetic maps of each intact chromosome are presented in upper left of each subfigure (a-e).withBC1 map distances in KOSAMBI(1944) cM (26). Map distances in BC2, averaged over all informative populations, are presented along the uppermost recombinant chromosome of each set (A, F, H, J, M). Some markers were not mapped in BC I , but were used in the present study for detailed characterization of CL recombinant segments: these are presented along the chromosome maps, in the linear order determined from prior mapping in L. esculentum X L. pennellii F S (our unpublished data). Based on genotype at theflanking markers, open intervals are inferred to be homozygous for L. esculentum, solid intervals are segregating for L. chmielewskii in the BC2F2, and dotted intervals contain a recombination site. For each set of recombinant segments, the marker used to determine segment effects is indicated by a vertical line through the corresponding segments. Additive effects and dominance deviations for soluble solids concentration are expressed in "Brix, mass per fruit and plant yieldin grams (g), and pH in original units. * and ** indicate significance at experimentwise error rates of 2 5 % and 2175, respectively. t and indicate significant deviation from expected allele (1:l) and g e n e type (1:2: 1) frequencies, respectively.
is found for segments A, C, D, and E, overlapping in the TG295-TG19 region. T h e effect of segment B is large but not significant; if it also carries the factor, the overlappingregion would exclude TG295. Elevated pH is significant for two segments (B, E) and just shy of significance for two more (C, D). These differ from theonly segment not affecting pH (A), in TG19-TG27, that they carrythe CLintervalfrom about 6 cM. Thus, soluble solids is elevated by one or more CL factor(s) between TG258 and the TG27 end of chromosome 2 , mass per fruit and/or yield are reduced by factor(s) between TG245 and TG255, yield
Fine Mapping of QTLs
of heterozygotes might be increased by factor(s) near TG19,and pHmight beincreased by factor(s) between TG19 and TGl7.Effects of this chromosome 1 region on thesefourtraits are attributed to at least four QTLs, separable by recombination. Chromosome 2 showed no effect on solids in BC1 (PATERSON et al. 1988), but theregion near CD35 was associated with elevated solids in selfed progeny of the BC1 (our unpublished data). This suggested a recessive factor from CL, the donor parent. Each of two CL chromosome 2 segments, (Figure 2b-F, G) which overlap near CD35,reduce fruit mass and yield. Only G significantly affects soluble solids, with an additive effect of +0.38"Brix per CL allele: the dominance deviation of -0.26"Brix is just shy of the significance threshold, but again suggests recessiveness of the CL factor. A factor affecting solids is inferred to lie distal to CD35,in a CL region unique to G. Factors affecting fruit mass and yield are inferred to lie near CD35, where F and G overlap. Effects of this chromosome 2 region on these three traits are attributed to at least two QTLs, separable by recombination. In the BC1 study, the TG32 region of chromosome 5 showed a normal (1:1) ratio of EE homozygotes to heterozygotes, and a nonsignificant increase in solids of 0.52"Brix (PATERSONet al. 1988). In the present study, an intactCL chromosome 5(Fig. 2c; H) showed significant segregationdistortionnear TG32, with only 14 of 138 progeny being CL homozygotes. The same CL chromosome exhibited a dominance deviation of +1.02"Brix near TG32, detected with marginal confidence ( P = 0.05) due to thepaucity of CL homozygotes. The heterozygotes averaged 0.6 "1Brix higher than the E homozygotes ( P < 0.001), giving a more reliable approximation of the effect of this region. Elimination of CL genome at each end of chromosome 5 generated a small segment (I) marked by TG32, which segregated normally, and showed a highly significant additive effect on solids of +0.51 "Brix. Segment H is sufficiently long that effects detected at TG32 could be due todistant QTLs. However, the short segment(I) has a similar effect on solids, suggesting that QTLs accounting for much of the effect lie on segment I. Further,the factor(s) causing segregational distortion appear distinct from factor(s) affecting solids, as the traits have been separated by recombination. Chromosome 6,previously dominated by the massive effects of sp on all traits (PATERSON et al. 1988), carries additionalQTLs revealed after eliminating CL segments which carry sp. Two CLchromosome 6 segments (Figure 2d-J, L), sharing the CD67-TG118 region, share significant reductions in fruit size and yield. A third segment (K) sharing the CD67-TG118 region, also shows a marginally nonsignificant reduction inyield. Ofthesesegments, only L shows a
739
significant additive effect on soluble solids (+0.46"Brix). Segment K shows a significant dominance deviation (+0.3S0Brix) but no additive effect. The apparently different mode of inheritance could indicate different QTLs, perhaps beyond TG118 on L and outside CD14 on K: at present, the segments cannotbe uniquely characterized in theseregions, due tolack of RFLPs. Alternatively, mode of inheritance may be modified by differences in the segments or epistatic relationships beyond the resolution of our data (see below), making it unreliable evidence that the segments carry different QTLs.New markers and more studies of this genomic region are needed. The TG61-TG128region of chromosome 7,previously showing single-allele effects of +0.83"Brix, +0.096 pH units, and -3.7 g (20%) mass per fruit (PATERSON et al. 1988), again affected several traits. Inthepresentstudy, we foundadditive effects of about -10 g (20%) in mass per fruit, greatly reduced yield, and aberrant segregation at TG128 for both segmentsstudied(Figure 2e; M, N). SegmentN, shorter than M at the TG128 end, shows a significant elevation of solids in the CL homozygote: no such effect is exhibited by segment M. N could carry unique CL QTL at the TG61 end, but the solids effect at TG61 in the current study (not shown) was not significant, suggesting that QTLs by which the segments differ lie near TG128.Alternatively, a double crossover in the 18 cM interval between TG128 and TG61 could have eliminated part of M: this cannot presently be verified, due to a lack of RFLPs in the region. In a previous study, both the TG128 and TG61 regions of chromosome 7 persisted through several generations of backcrossing CL to E, with selection for high solids (RICK1974). However, only the TG128 region was shown to actually increase solids (TANKSLEY and HEWITT1988). New markers and additional studies are needed to better understand the effects of chromosome 7 on these traits. Epistasis: Only infrequently were interactions between unlinked genomic regions significant, suggesting that epistasis had little effect on the traits which were studied. Since each population carried from two to four segments, it was possible to test from 1 to 6 two-way interactions between segments in each population. Each ofthese interactionswas partitioned into four contrasts, corresponding to additive X additive, additive X dominant, dominant X additive, and dominant X dominant epistasis. From the total of 25 twoway interactions, one (4%) was significant for solids, five (20%) for fruit mass, and three (12.5%) for pH, at the nominal 0.05 significance level (e.g., not adjusted for experimentwise error). Further, of the 100 possible single d.f. contrasts, four (4%) were significant for solids, ten (10%) formass per fruit, and four (4%) for pH, at the nominal 0.05 level. Only for mass
740
A. Paterson et al.
perfruit were significant interactions consistently more frequent than the random expectation of 5%. Single-locus additivity and dominance appear to explain much of the genetic variation in our populations. Useof more than 150 individuals would provide a more powerful test of epistasis, however previous marker-based studies using larger populations have also detected minimal epistasis (EDWARDS, STUBER, and WENDEL 1987;PATERSON et al. 1988).
SLEY and
HEWITT 1988), will be important in assessing the role of epistasis in quantitative inheritance. However, both the current results and previous evidence (EDWARDS, STUBER,and WENDEL 1987;PATERSON et al. 1988) suggest that some QTLs can function independently of others. This is of major importance in QTL manipulation, and extraction of valuable traits from wild germplasm, as it is far easier to identify and transfer single QTLs than pairs, trios, et cetera. While the present results largely corroborate results from a prior generation in a different environment (PATERSON et al. 1988), it is important to note that DISCUSSION the present results are based on a single-environment test. In a different environment, a particular chroSubstitution mapping reduces the size of the intermosomal segment might have differentphenotypic val to which a QTL can be assigned, by determining effects, due to different expression of the same genetic the phenotypic effects of chromosomal segments with factors, or to expression of different factors. While small differences. Prior mapping of QTLs to-20 cM this might alter our description of particular chrointervals (PATERSON et al. 1988) serves as a starting mosomal segments, the general approach to mapping point, from which QTLs can be mapped with much QTLs would remain valid. Experiments in progress finer resolution. In this study, we were able to assign are investigating environmental sensitivity of QTLs, QTLs to intervals of as little as 3 cM. Resolution of by conducting trials in locally different environments, QTLs may be improved even further, by subsequent and on different continents. study of recombinants in these small intervals. After Mechanics of substitution mapping: The resoluseveral iterations, QTLs might be assigned to intervals tion of substitution mapping is determined primarily sufficiently small for physical mapping and map-based by ability to distinguish overlapping chromosomal segcloning, especiallyin a relatively simple (for higher ments. These segments can be obtained relatively organisms; 555 Mbp, and diploid) genome such as simply. Genotyping about 150 F2 or 300 BC progeny, tomato. enough to establish -20 cM QTL likelihood intervals In some cases, genes with desirable effects (in(PATERSON et al. 1988, LANDER and BOTSTEIN1989) creased solids) mapped to different intervals than as targets for substitution mapping, alsogives 95% genes with undesirable effects (reduced mass per confidence of obtaining a recombinant within any 1 fruit). Close linkage, rather than pleiotropy, appears cM interval. For practical reasons, a single population responsible for trait associations in such cases. Experwas employed both for determining likelihood interiments in progress are studying recombinants in such vals, and as a source of chromosomal segments for regions, to attempt to identify progeny carrying only substitution mapping in later generations. It could be the desirable trait (or, with somewhat less enthusiasm, argued that this constitutes a bias, since the gametic the undesirabletrait), which would verify thatthe array of subsequent generations is influenced by that association had indeed been due to linkage. of the first generation. It is unclear whether this bias Because genetic variation in the BC2F2 populations would have much effect on phenotype: plant breeders had been reduced by eliminating much of the donor almost invariably study differentgenerationsdegenome, small effects previously not significant were scended from a particular population, with reasonable inferred with confidence to indicate QTLs. This supsuccess. ports a model for polygenic trait inheritance wherein To take full advantage of substitution mapping,the the magnitude of effect attributable to different geoverlapping regions of differentchromosomal segnomic regions follows a continuum (SHRIMPTON and ments must be determined as precisely as possible, ROBERTSON 1988). Consistent with this model, we using genetic markers whose relative order is known. foundreductions inmass perfruitnot previously Thus, the resolution at which segments can be distindetected, which had likely been obscured by QTLs of guished is determined by the resolution at which larger effect. As a corollary, small effects deemed markers have beenmapped. The ability toorder nonsignificant in the present experiment may prove closely spaced markers by linkage analysis depends on to represent additionalQTLs of still smaller effect. the size of the largest informative mapping population The QTLs studied herein continue to show pheavailable (for a homosequential genome). Many curnotypic effects in isolation from much of the donor rent linkage maps, based on less than 100 individuals, genome, and show little evidence of epistasis with the can only accurately order markers which are several remaining donor genome. Use of larger populations, and testing of QTLs in multiple backgrounds (TANK- cM apart. Use of larger populations, or recombinant
Fine Mapping of QTLs
inbred strains (HALDANE andWADDINGTON, 1931; BURRet al. 1988),mightpermitonetodetermine orientation of markers as little as 1 cM apart. Physical mapping of genetic markers (COULSON et al. 1988; CANAL, YOUNGand TANKSLEY 1989), should improve resolution of both genetic maps and substitution mapping, to less than 1 cM. Recombinant chromosomes may be assayed either in segregating populations aswe did, or in true-breeding near-isogenic lines which differ only by overlappingrecombinant segments. Making isogenic lines requires several generations of backcrossing and genotyping small populations, but eliminates the need for subsequent genotyping. Such lines can be replicated extensively to detect small effects, and can be tested as heterozygotes by mating to the recurrent parent. Using near-isogenic lines incurs arisk that small donor chromosome segments (independent of thetarget segment) have persisted by chance; such “relics” are randomized in segregating populations, but are confounded with treatment effects in otherwise nearisogenic lines. Several backcrosses, or study of several different lines which are putatively near-isogenic for a segment, should factorout effects of any relics. Recombination shrinkage: Most CL segments showed reduced recombination in the BC2F2, however the only putatively intact CL chromosome (chr. 5) largely retained its BC1 recombinationallength. Each of the most prominent models for meiotic reSZOSTAK combination (MESELSONand RADDING 1975; et al. 1983)requiresingle-strandedexchanges between homologous chromosomes. Such exchanges between the sequence-identical homologs in homozygous regions may morefrequently yield reciprocal exchange than those between the sequence-divergent strands in heterozygous regions. Increased chiasmata formation in homozygotes has beenobserved in a number of plant species (reviewed in GRANT, 1958). In yeast, introduction of 9 restriction site polymorphisms intoa 9-kb intervalreduced reciprocal exchange by about 5076, and increased the frequency of nonreciprocal repair of DNA mismatches (BORTSand HABER, 1987).Mismatch repair might also partly explain the rather high frequency of variants in fruit color which we have observed in these populations. Reduced reciprocal exchange, together with positive interference, might explain both the pronounced recombination shrinkage we found in heterozygous segments, and the minimal shrinkage of a heterozygous intact chromosome. The lower likelihood of a reciprocal exchange in a heterozygous chromosomal segment may be accentuated by positive interference, from more frequent reciprocal exchanges in flanking homozygous regions. When the heterozygous segment represents alargely intact chromosome, such as
74 1
our CL chromosome 5, fewer flanking “preferred sites” would be present, and less shrinkage would be observed. Recombination shrinkage may be particularly pronounced in wide crosses such as we have studied here, where greater sequence-divergence would result in strongerpreferencefor homozygous regions. Such restrictions on genetic exchange might be less pronounced in crosses between less diverse parents, such as elite crop varieties. Recombination shrinkage increases the quantity of DNA and number of genestransmitted as aunit, reducing the precision at which individual genes (or traits) can be selected for. Even without recombination shrinkage, theoretical models suggest that large chromosomal regions may remain intact through numerous meioses (HANSON 1959). Reduced recombination in such regions may contribute greatly tomaintainingtrait associations by “linkage drag” (ZEVEN, KNOTT and JOHNSON 1983) or “genetic hitchhiking” (BIRKYand WALSH1988). This may partly explain why previous efforts to transfer solids from CL to E, with selection against undesirable wild traits (RICK 1974), lostmany CLregions we found to increase and HEWITT 1988). For example, solids (TANKSLEY the small region of chromosome 1 which we found to carry closely linked QTLs for increased solids and reduced fruit mass, would likely have been selected against. Recombinationshrinkage may accountfor many such losses, in attempts to transfer specific attributes from wild to domestic species. Substitution mapping defines regions in which recombination can prevent such losses, and DNA markers identify the rare desirable recombinants. Fine mapping of quantitative trait loci amplifies the utility of DNA markers in study and manipulation of quantitative traits. Distinction of close linkage from pleiotropy, in causing associations of valuable traits with undesirable properties, should invigorate efforts to transfer an abundance of attributes from wild species to domestic strains. Assigning a QTL to a small interval, such as an interval between two RFLP markers which are on a single yeast artificial chromosome et al. 1988), would be a major step toward (COULSON cloning the genetic factor(s) lying at the QTL. Consequently, identification of small target regions for physical manipulation of QTLs may extend the reach of molecular biology into this class of genes fundamental to evolution, agriculture, andmedicine. Wethank MICHAELBRICCS for technicalassistance, and R. CHETELAT, M. GANAL, J. GOFFREDA, E. LANDER, N. LAPITANand S. MCCOUCHfor valuable comments. T h e work was funded by grants from Campbells Institute of Research and Technology, the National Science Foundation, the U.S. Department of Agriculture/ CompetitiveResearch GrantsOrganization,andtheUS-Israel Binational Agricultural Research and Development Fund, to S.D.T.
742
A. Paterson et al. LITERATURECITED
BIRKY, C. W., and J. B. WALSH,1988 Effects of linkage on rates of molecular evolution. Proc. Natl. Acad. Sci. USA 85: 641464 18. BoRTs,R. H., and J. E. HABER, 1987 Meiotic recombination in yeast: alteration by multipleheterozygosities.Science 237: 1459-1465. BOTSTEIN,D., R.L. WHITE, M . SKOLNICKand R. W. DAVIS, 1980Construction of agenetic linkage map in man using restriction fragment length polymorphisms. Am. J. Hum. Genet. 32: 314-331. BURR,B., F. A. BURR,K. H . THOMPSON, M. C. ALBERTSEN and C. W . STUBER,1988Genemapping with recombinantinbreds in maize. Genetics 118: 519-526. J. KIFF,J. SULSTON and Y. KOHARA, COULSON, A,, R. WATERSTON, 1988 Genome linking with yeast artificial chromosomes. Nature 335: 184-1 86. EAST,E. M., 1915 Studies on size inheritance in Nicotiana.Genetics l: 164-176. EDWARDS,M. D., C. W. STUBER and J. F. WENDEL, 1987 Molecular-marker-facilitatedinvestigationsof quantitative-trait loci in maize. I . Numbers, genomic distribution, and types of gene action. Genetics 116: 1 13-1 25. FEINBURG, A. P., and B. VOGELSTEIN,1983Atechniquefor radiolabeling DNA restriction endonuclease fragments tohigh specific activity. Anal. Biochem. 132: 6-13. GANAL, M . W., N. D. YOUNG and S. D. TANKSLEY, 1989 Pulsed field gel electrophoresis and physical mapping of large DNA fragments in the Tm-Sa region of chromosome 9 in tomato. Mol. Gen. Genet. 215: 395-400. GRANT, V., 1958 The regulation of recombinationin plants. Cold Spring Harb. Symp. Quant. Biol. 23: 337-363. HALDANE,B. J. S.,and C. H. WADDINGTON, 1931 Inbreedingand linkage. Genetics 16: 357-374. HANSON,W. D., 1959 Early generation analysis of lengths of heterozygous chromosome segments around a locus held heterozygous with backcrossing or selfing. Genetics 4 4 833-837. JOHANSSEN, W., 1909 Elemente der exakten Erblichkeitsllehre. Fischer, Jena. KOSAMBI,D. D.,1944The estimation of map distances from recombination values. Ann. Eugen. 12: 172-1 75. C. T. CASKEY, A. SPEER,A. P. KUNKEL, L. M., J. F. HEJTMANCIK, MONACO, W. MIDDLESWORTH,A. C.COLLETTI,C. BERTELSON, U. MULLER,M. BRESNAN, F. SHAPIRO,U.TANTRAVAHI,J. SPEER,S. A. LATT, R. BARTLETT,M. A. PERICAK-VANCE, A. D. ROSES,M. W. THOMPSON, P. N. RAY, R. G. WORTON,K. H. FISCHBECK, P. GALLANO, M. COULON,C. DUROS,J. BOUE, G. HAMARD, M. JEANPIERRE, M. LAMC. JUNIEN, J. CHELLY, BERT,J.C. KAPLAN, A. EMERY, H. DORKINS,S. MCGLADE, K. E. DAVIFS,C. BOEHM, B. ARVEILER, C. LEMAIRE, G. J. MORGAN, M. J. DENTON, J.AMOS,M. BOBROW,F. BENHAM, E. BOSWINKEL, C. COLE,V. DUBOWITZ, K. HART,S. HODGSON,L. JOHNSON, A. WALKER, L. RONCUZZI, A. FERLINI,C.NOBILE, G. ROMEO,D. E. WILCOX, N. A. AFFARA, M. A. FERGUSON-SMITH, M. LINDLOF, H. KAARIAINEN, A. DE LA CHAPELLE, v. IONASESCU, C. SEARBY, R. IONASESCU, E. BAKKER,G.-J. B. VAN
OMMEN, P. L. PEARSON, C. R. GREENBERG,L.J. HAMERTON, K. WROGEMANN, A. R. DOHERTY, R. POLAKOWSKA, C. HYSER, S. QUIRK, N . THOMAS, J.F. HARPER,B. T. DARRAS andU. FRANCKE, 1986 Analysis of deletions in DNA from patients with Becket. and Duchenne muscular dystrophy. Nature 322: 73-77. LANDER, E. S., and D. BOTSTEIN,1989 MappingMendelian factors underlying quantitative traits using RFLP linkage maps. Genetics 121: 185-199. LANDER, E. S., P. GREEN, J. ABRAHAMSON, A. BARLOW, M. J. DALY, S. E. LINCOLN and L. NEWBURG, 1987 Mapmaker:An interactive computer package for constructing primary genetic linkage maps of experimental and natural populations. Genomics 1: 174-181. MESELSON,M. S., and C. M . RADDING, 1975 A general model for genetic recombination. Proc. Natl. Acad. Sci. USA 72: 358361. H., 1909 KreuzunguntersuchungenanHaferund NILSSON-EHLE, Weizen. Lund. PAGE,D. C., 1986 Sex Reversal:Deletion mappingthe maleY chromosome. Cold determiningfunction of thehuman Spring Harbor Symp. Quant. Biol. 51: 229-235. D. HEWITT,S. PETERSON, S. E. PATERSON, A. H., E. S. LANDER, J. LINCOLN, andS. D. TANKSLEY, 1988Resolution of quantitative traits into Mendelian factors, using a complete linkage map of restriction fragmentlength polymorphisms. Nature 335: 721-726. RICK,C. M., 1969Controlled introgression ofchromosomes of Solanum pennellii into Lycopersicon esculentum: segregation and recombination. Genetics 62: 753-768. RICK,C. M., 1974 High soluble-solids content in large-fruited tomato lines derived from a wild green-fruited species. Hilgardia 42: 493-510. SAS Institute, Inc., 1988 SAS Users Guide: Statistics. SAS Institute, Cary, N.C. SHRIMPTON, A. E., and A. ROBERTSON,I988The isolation of polygenic factors controlling bristle score in Drosophila melanogaster. 11. Distribution of third chromosome bristle effects within chromosome sections. Genetics 11: 445-459. R.J. ROTHSTEIN,and F. W. SZOSTAK, J. W., T . L. ORR-WEAVER, STAHL,1983 The double-strand-breakrepair model for recombination. Cell 33: 25-35. TANKSLEY, S. D., 1983 Introgression of genes from wild species, and T . J .ORTON,Isozymes in pp. 331-337 in S. D. TANKSLEY Plant Genetics and Breedzng. Elsevier, Amsterdam. TANKSLEY, S. D.,andJ. D. HEWITT,1988 Useofmolecular markers in breeding for soluble solids in tomato-a re-examination. Theor. Appl. Genet. 75: 81 1-823. WRIGHT,S., 1968 Evolutionand the Genetics of Populations. University of Chicago Press, Chicago. 1986 Unequal segregation of nuclear ZAMIR,D., and Y. TADMOR, genes in plants. Bot. Gar. 147: 355-358. ZEVEN, A. C.,D. R. KNOTTand R. JOHNSON,1983 Investigations of linkage drag in near-isogenic lines of wheat by testing for seedling reaction to races of stem rust, leaf rust, and yellow rust. Euphytica 32: 319-327. Communicating editor: B. BURR