Journal of Information Processing Systems, Vol.6, No.4, December 2010
DOI : 10.3745/JIPS.2010.6.4.511
Fingerprint Detection Using Canny Filter and DWT, a New Approach Md. Imdadul Islam*, Nasima Begum*, Mahbubul Alam* and M. R. Amin** Abstract—This paper proposes two new methods to detect the fingerprints of different persons based on one-dimensional and two-dimensional discrete wavelet transformations (DWTs). Recent literature shows that fingerprint detection based on DWT requires less memory space compared to pattern recognition and moment-based image recognition techniques. In this study four statistical parameters - cross correlation co-efficient, skewness, kurtosis and convolution of the approximate coefficient of one-dimensional DWTs are used to evaluate the two methods involving fingerprints of the same person and those of different persons. Within the contexts of all statistical parameters in detection of fingerprints, our second method shows better results than that of the first method. Keywords—Canny Filter, Color Inversion, Skewness, Kurtosis and Convolution
1. INTRODUCTION Discrete wavelet transformation (DWT) transforms a continuous time signal f (t) but the discretization is done only in a and b (a for wavelet dilation and b for translation respectively) and is widely used for image processing [1, 2]. Usually a one-dimensional wavelet transform is used in decomposition and synthesis of voice or data signals, but for image analysis a twodimensional wavelet transform is used, which is much more complicated than the onedimensional case. The DWT is computed by successive low pass and high pass filtering of the discrete time-domain signal (shown in Appendix-A). When a signal is simultaneously passed through a low pass and high pass filter, the output of the low pass filter containing the low frequency content of the signal is called an approximation, which gives the signal identity. The output of the high pass signal on the other hand, is called the details, and provides the tone of the signal as summarized in [3, 4]. For digital sequencing the number of samples at the output of both low pass and high pass filter is equal to the number of samples of the original message. The Fingerprint technique is one of the most reliable biometric technologies as fingerprints preserve universality, uniqueness, permanence, and collectability characteristics for personal identification. Several approaches of fingerprint matching have been proposed in recent literature. One approach is taking the 9th level DWT of the original fingerprint image; from which Manuscript received August 3, 2010; accepted October 29, 2010. Corresponding Author: M. R. Amin * Department of Computer Science and Engineering, Jahangirnagar University, Savar, Dhaka 1342, Bangladesh (
[email protected]) ** Dept. of Electronics and Communications Engineering, East West University, 43 Mohakhali, Dhaka 1212, Bangladesh (
[email protected])
511
Copyright ⓒ 2010 KIPS (ISSN 1976-913X)
Fingerprint Detection Using Canny Filter and DWT, a New Approach
three linear lines can be obtained. The slopes of these lines are then stored as numerical values in a matrix form, which are then used as the template values for the fingerprint image. Fingerprint recognition is performed by comparing the slope values of the input image with the stored template values. This method yields about a 95% recognition rate as explained in [5]. An image based automatic fingerprint matching approach is proposed in [6]. The fingerprint images are matched based on the features extracted in the wavelet domain. The feature vector represents an approximation of the image energy distribution over different scales and orientation. Using this method, about a 95.2% recognition rate is achieved. A hierarchical fingerprint matching system is proposed in [7] that utilized features at three levels- Level 1 (pattern), Level 2 (minutia points) and Level 3 (pores and ridge contours), extracted from high resolution (1,000 ppi) fingerprint scans. Here Gabor filters and wavelet transform are used to automatically extract the Level 3 features and are locally matched using an Iterative Closest Point (ICP) algorithm. This approach focuses on the Level 3 features of the fingerprint as it carries significant discriminatory information and also shows that by employing Level 3 features, a 20% equal error rate (EQR) has been reduced. A combination of features for multi-scale and multi-directional recognition of fingerprints is proposed in [8]. The features include standard deviation, kurtosis, and skewness. This method is applied by analyzing the fingerprints using discrete wavelet transform (DWT). However, this method does not incorporate any image filter to sharpen the pixels. The present paper uses the Canberra distance metric to determine the similarity between the texture classes. The proposed algorithm can detect fingerprints even if they are at some other orientation. Also the approach is very simple compared to the minutia point pattern matching algorithm. Above a 95% recognition rate is achieved using this method. The Canny filter is an edge detection technique based on the first derivative of a Gaussian function, because it is susceptible to the noise present on raw unprocessed image data, so to begin with, the raw image is convolved with a Gaussian filter. The result is a slightly blurred version of the original, which is not affected by a single noisy pixel to any significant degree. The rest of this paper is organized as follows. Sec. II deals with the methodology of the proposed model, Sec. III reveals the results of the paper and finally Sec. IV concludes the entire analysis.
2. METHODOLOGY In this paper we proposed two different methods to detect fingerprints of different persons based on DWT.
2.1 Method 1 Several fingerprints of a person are taken in a random manner (in context of translation and rotation) followed by a two-dimensional DWT. Four filtered signals (level-one (approximation), level-two (horizontal details), level-three (vertical details), and level-four (diagonal details)) A, B, C and D are again transformed at 9 levels DWT and the approximations are stored instead of the original images. The transformed signal matrices Ti,n = [Ai,n Bi,n Ci,n Di,n]T; where n = 1, 2, 3, …, M, and M is the number of stored matrices of user i. To recognize the fingerprint of a person, his image is scanned and the same job is done to determine the matrix Ti,n. Finally, a con-
512
Md. Imdadul Islam, Nasima Begum, Mahbubul Alam and M. R. Amin
volution is made with stored vectors yi of Ti,n and the corresponding vectors of the present scanned image and corresponding convolution vectors vi are stored. Finally skewness, kurtosis and cross correlation co-efficient of normalized yi is taken for both cases (fingerprint of same person and different person). The mathematical equations regarding different models mentioned in this section is given in Appendix-A.
2.2 Method 2 In this method, several fingerprints of a person are taken in a random manner as in the previous method (in context of translation and rotation) then an RGB conversion is performed on them. The contrast of the images is increased using a Canny filter then color inversion is performed on them. Then the same process, as in method 1 is executed. The entire process is shown in the flowchart, as in Fig. 1.
Fig. 1. Flowchart of image processing
513
Fingerprint Detection Using Canny Filter and DWT, a New Approach
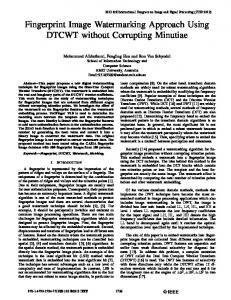
3. RESULTS To begin with, three fingerprints of the same person are taken in a random manner (in context of rotation and translation) and their 9th levels 1-D DWT of approximation A is shown in Fig. 2. Fig. 2(a) is a Method 1case, and Fig. 2(b) is a Method 2 case which follows the flowchart of Fig. 1. The vectors correspond to approximation A of the three images which are designated as y1, y2 and y3. All the curves seem to be very close but Method 2 provides the better result. The convolutions are between (y1, y2), (y2, y3) and (y3, y1) are v1, v2 and v3 respectively and are plotted in Fig. 3, after normalization where three curves merge very closely. In this case, both methods show almost the same performance. Three finger prints of different persons are taken in a random manner. The approximate part A of 2D-DWT of each image is selected, and 9th level 1D-DWT is taken on each approximate vector A from each image. The resulting vectors are shown in Fig. 4. The results and corre-
400
0 0
50 n
1
100
200 100
0.5
0.5
0.5
0
dwt of LP
200
0
100
1
dwt of LP
100
1
300 dwt of LP
200
-100
400
300 dwt of LP
dwt of LP
300
dwt of LP
400
0
0
0 0
50 n
100
-100
0
50 n
-0.5
100
0
50 n
100
(a) Method 1
-0.5
0
50 n
100
-0.5
0
50 n
100
(b) Method 2
Fig. 2. Fingerprints and corresponding 9th level approximations of A for the same person Finger print of Same persons
Finger print of Same persons
1
1.2 convolution of y1 and y2 convolution of y3 and y2 convolution of y1 and y3
0.9 0.8
0.8
0.7 0.6
c onv (y i,y j)
c onv (y i,y j)
convolution of y1 and y2 convolution of y3 and y2 convolution of y1 and y3
1
0.5 0.4 0.3
0.6
0.4
0.2
0.2 0
0.1 0
0
20
40
60 n
80
100
-0.2
120
0
20
40
60
80
100
n
(a) Method 1
(b) Method 2
Fig. 3. Convolution vectors yi and yj for the same person (after normalization)
514
120
140
300
0
0.5
dwt of LP
0.5
0
0.6 0.4
0
50 n
100
-0.5
0
50 n
0
100
100 0
0.2 -0.5
200
0
50 n
-100
100
0
50 n
100
(a) Method 1
10
10
5
5 dwt of LP
400
dwt of LP
1 0.8
1
dwt of LP
dwt of LP
1
dwt of LP
Md. Imdadul Islam, Nasima Begum, Mahbubul Alam and M. R. Amin
0 -5 -10
0
50 n
100
0 -5 -10
0
50 n
100
(b) Method 2
Fig. 4. Fingerprints and corresponding 9th level approximations of A for the different person Finger print of different persons
Finger print of Same persons
1
1.2 convolution of y1 and y2 convolution of y3 and y2 convolution of y1 and y3
0.9 0.8
0.8
0.7 0.6
c on v (y i,y j)
c onv (y i,y j)
convolution of y1 and y2 convolution of y3 and y2 convolution of y1 and y3
1
0.5 0.4 0.3
0.6
0.4
0.2
0.2 0
0.1 0
0
20
40
60 n
80
100
-0.2
120
(a) Method 1
0
20
40
60 n
80
100
120
(b) Method 2
Fig. 5. Convolution vectors of yi and yj for different persons (after normalization)
sponding convolution vectors (in normalized form) are plotted in Fig. 5. Both the methods show wide deviation as is seen from Fig. 4 and Fig. 5. In this section, we also consider three statistical parameters: 1) skewness, 2) kurtosis, and 3) Cross correlation co-efficient of vectors y1, y2 and y3.and an A comparison is made between the two methods on these parameters as is shown in Table 1 and Table 2. All the parameters for same and different person cases are shown in Table 1 for the Method 1cases. The cross correlation-coefficient for the same person case is almost 98% and the different person case is below 89%. The maximum deviation of statistical parameters of three images (for the same person and different person cases) is shown in Table 3 below. We observe from Table 3, that in Method 2, the percentage of deviation from statistical parameters for fingerprints of the same person is much lower than Method 1. On the other hand, the percentage of deviation for the same parameters in method 2 is much higher in the different person case compared to that of Method 1 except for the cross-correlation coefficient. In context of percentage of deviation from statistical parameters, Method 2 is better than Method 1.
515
Fingerprint Detection Using Canny Filter and DWT, a New Approach
Table 1. Comparison of statistical parameters (Method 1) Same person
Different persons
Vectors
Skewness (yi, yj)
y1 and y2
1.3569
3.1339
0.9646
1.3569
3.1339
0.5745
y2 and y3
1.2921
2.7439
0.9810
0.1924
1.2080
0.6532
y1 and y3
1.4195
3.4461
0.9646
0.4879
2.3120
0.8859
Skewness
Kurtosis
Kurtosis Cross correlation co(yi, yj) efficient of yi and yj
Skewness
Kurtosis Cross correlation of yi and yj
Table 2. Comparison of statistical parameters (Method 2) Same person
Different persons
Vectors
Skewness (yi,yj)
y1 and y2
1.0791
2.2164
0.9999
1.0799
2.2176
y2 and y3
1.0793
2.2187
0.9999
1.0568
7.4651
0.8373
y1 and y3
1.0799
2.2176
0.9999
-0.9441
12.5440
0.7414
Kurtosis Cross correlation co(yi,yj) efficient of yi and yj
Cross correlation of yi and yj 0.7919
Table 3. Maximum deviation of Skewness, Kurtosis, and cross correlation Method
Same person
Different persons
Maximum Maximum deMaximum Maximum devia- Maximum deviaMaximum deviation of deviation of viation of Cross deviation of tion of Kurtosis tion of Cross Skewness Kurtosis (dk) correlation (dc) Skewness (ds) (dk) correlation (dc) (ds) Method 1 (Table 1)
8.9750%
20.3767%
1.6718%
85.8206%
61.4538%
35.1507%
Method 2 (Table 2)
0.0741%
0.1037%
0%
187.4248%
82.3214%
11.4535%
4. CONCLUSION This paper makes a comparison of two proposed methods for detection of fingerprints. Method 2 reveals better results in context of all statistical parameters. The results section of this paper considers only three fingerprints in the process of finding similarities and dissimilarities. Before proceeding towards materialization of the model proposed here for real life practicality it has to be tested for thousands of fingerprints. Still there is scope for extension of the paper involving filtering the images using different types of filters used in image processing (here we used only Canny filters) to increase contract so that the edges of the image become sharper and finally, color inversion will produce images of dark lines on a white background. Then the entire previously described analysis can be repeated to observe and compare performance.
REFERENCES [1] [2] [3]
Mário A. T. Figueiredo, and Robert D. Nowak, “An EM Algorithm for Wavelet-Based Image Restoration”, IEEE Trans. Image Processing, Vol.12, No.8, 2003, pp.906-916. Andrew B. Watson, Gloria Y. Yang, Joshua A. Solomon, and John Villasenor, “Visibility of Wavelet Quantization Noise”, IEEE Trans. Image Processing, Vol.6, No.8, 1997, pp.1164-1175. Raghuveer M. Rao and Ajit S. Bopardikar, “Wavelet Transforms: Introduction to Theory and Appli516
Md. Imdadul Islam, Nasima Begum, Mahbubul Alam and M. R. Amin cations”, Pearson Education, Inc., 1st edition, Delhi, 2005. Rafael G. Gonzalez, Richard E. Woods, and Steven L. Eddins, “Digital Image Processing using MATLAB”, Pearson Education, Inc., 1st edition, Delhi, 2004. [5] Wan Azizun Wan Adnan, Lim TZE Siang, Salasiah Hitam, “Fingerprint recognition in wavelet domain”, Jurnal Teknologi, 41(D), Universiti Teknologi Malaysia, Dis. 2004, pp.25-42. [6] M. Tico, P. Kuosmanen, J. Saarinen, “Wavelet domain features for fingerprint recognition”, IEE Electronics Letters, Vol.37, No.1, 4th January, 2001, pp.21-22. [7] Anil K. Jain, Yi Chen, Malter Demirkus,“Pores and Ridges: High-Resolution Fingerprint Matching Using Level 3 Features”, IEEE Transactions on Pattern Analysis and Machine Intelligence, Vol.29, No.1, January, 2007, pp.15-27. [8] K. Thaiyalnayaki, S. Syed Abdul Karim, P. Varsha Parmar, “Finger print recognition using DiscreteWavelet Transforn”, International Journal of Computer Applications (0975-8887), Vol.1, No.24, 2010, pp.96-100. [9] Burrus, C. S.; Gopinath, R. A.; and Guo, H., ‘Introduction to Wavelets and Wavelet Transforms’: A Primer. Prentice Hall Inc., Upper Saddle River, New Jersey, 1998. [10] Aydin, T., Yemez, Y., Anarim, E., and Sankur, B., “Multi-directional and Multi-scale Edge Detection via M-Band Wavelet Transform”, IEEE Trans. Image Processing, Vol.5, No.9, 1996, pp.1370-1377. [11] Mário A. T. Figueiredo, and Robert D. Nowak, “Wavelet-Based Image Estimation: An Empirical Bayes Approach Using Jeffreys’ Noninformative Prior”, IEEE Trans. Image Processing, Vol.10, No.9, 2001, pp.1322-1331. [4]
Md. Imdadul Islam He completed his B.Sc. and M.Sc Engineering in Electrical and Electronic Engineering from Bangladesh University of Engineering and Technology, Dhaka in 1993 and 1998. He has completed the CAS program from Asian Institute of Technology, Thailand in 2001. He has done his Ph.D. at the department of Computer Science and Engineering, J.U., Dhaka, in the field of Network traffic. He worked as an Assistant Engineer in Sheba Telecom (Pvt.) LTD (A joint venture company between Bangladesh and Malaysia, for Mobile cellular and WLL), from Sept'94 to July'96. He has very good field experience in installation of Radio Base Stations and Switching Centers for WLL. He is now working as a Professor, at the department of Computer Science and Engineering, Jahangirnagar University, Savar, Dhaka, Bangladesh. His research field is network traffic; wireless communications, wavelet transform, OFDMA, WCDMA, adaptive filter theory and array antenna systems. He has more than ninety research papers in national and international journals and conference proceedings.
Nasima Begum She received her B.Sc. (Hons.) degree in Computer Science and Engineering from Jahangirnagar University, Savar, Dhaka in 2006. She is studying for her MS at the department of Computer Science and Engineering, Jahangirnagar University, Savar, Dhaka. From January 2007 to January 2010, she was a Lecturer in the Department of Computer Science and Engineering, Manarat International University (MIU), Dhaka-1212, Bangladesh. Since February 2010, she has been working as a Senior Lecturer in the same department. Her research interests include Information and Communication Technology, Wireless Communication, Image Processing and Signal Processing, Artificial Intelligence and Neural Networks and Computer Communication Networks.
517
Fingerprint Detection Using Canny Filter and DWT, a New Approach
Mahbubul Alam He completed his B.Sc. (Hons.) in Computer Science and Engineering from Jahangirnagar University, Savar, Dhaka, Bangladesh in 2006. He received the “Asadul Kabir Gold Medal” for securing the highest grade in the B.Sc. (Hons.) final examination 2006 at Jahangirnagar University. He is now working as a Lecturer, at the department of Computer Science and Engineering, Jahangirnagar University, Savar, Dhaka, Bangladesh from 13th July 2009. His research interests are wavelet transform, wireless communications, adaptive filter theory, artificial intelligence, image processing and machine learning.
M. R. Amin He was born in 1960 in Dinajpur, Bangladesh. He received his B.S. and M.S. degrees in Physics from Jahangirnagar University, Dhaka, Bangladesh in 1984 and 1986 respectively and his Ph.D. degree in Plasma Physics from the University of St. Andrews, U. K. in 1990. He is a Professor of Electronics and Communications Engineering at East West University, Dhaka, Bangladesh. Dr. Amin served as a Post-Doctoral Research Associate in Electrical Engineering at the University of Alberta, Canada, during 1991-1993. He was an Alexander von Humboldt Research Fellow at the Max-Planck Institute for Extraterrestrial Physics at Garching/Munich, Germany during 1997-1999. He was awarded the Commonwealth Postdoctoral Fellowship in 1997. Besides these, he has also received several awards for his research, including the Bangladesh Academy of Science Young Scientist Award for the year 1996 and the University Grants Commission Young Scientist Award for 1996.
518
Md. Imdadul Islam, Nasima Begum, Mahbubul Alam and M. R. Amin
APPENDIX A In wavelet analysis, we often speak of approximations and details. The approximations are the high-scale, low-frequency components of the signal. The details are the low-scale, highfrequency components. Approximations and details of f (t) are evaluated like [3, 9]: The average values of f (t) over corresponding intervals are obtained as, C (m, n) =
d (m, n) =
1
∫
1
∫
2 m ( n +1)
m 2m 2 n
2 m ( n +1)
m 2m 2 n
(A1)
f (t )dt
f (t )ψ ( 2 − m t − n) dt .
(A2)
Let fk(t) be the piece wise constant over the interval of length 2k known as approximation to f(t) expressed as, ∞
f k (t ) =
∑ c(k , l )φ (2− k t − l ) ,
l = −∞
where φ (t ) =
∏ (t − 1 / 2 ) .
(A3)
Again the detail function at level k is expressed as, ∞
g k (t ) = f k −1(t ) − f k (t ) =
∑ d (k , l )ψ (2−k t − l )
.
(A4)
l = −∞
A two level decomposition of a sequence x (n) of 800 samples is shown in Fig.5. At each level, the HP filter produces the sequence of coefficients called detail information, d(i, n), while the LP filter produces a sequence a(i, n) called approximations.
Example 1 Let us consider a function f(t)=e-t/4u(t); where u(t) is a unit step function. The piece wise constant fk(t) and the detail function gk(t) for different values of k are plotted in Fig. 6. A twodimensional discrete wavelet transform is one of the prominent mathematical tools to resolve components of an image for analysis and modification [10, 11]. Let us consider a square and integral function f(x,y) can be expressed as a linear combination of three two-dimensional wavelets – namely, SΦΨ (x, y), SΨΦ (x, y) and SΨΨ (x, y) like,
519
Fingerprint Detection Using Canny Filter and DWT, a New Approach ∞
f ( x, y) =
∞
∞
∞ b (n, p)s (2 −k x − n,2 −l y − p) k φψ
∑ ∑ ∑ ∑
k = −∞ l = −∞ n = −∞ p = −∞ ∞
+
∞
∞
∞
∑ ∑ ∑ ∑
ck (n, p)sψ (2− k x − n,2−l y − p) φ
k = −∞ l = −∞ n = −∞ p = −∞ ∞
+
∞
∞
∞
∑ ∑ ∑ ∑
(A5)
d k (n, p)sψ (2− k x − n,2−l y − p) ,
k = −∞ l = −∞ n = −∞ p = −∞
ψ
where the coefficient bk ( n, p ) , ck (n, p ) and d k ( n, p ) can be evaluated based on [10-12]. The skewness is a measure of the asymmetry of the probability distribution of a real-valued random variable X express as, ⎡⎛ X − μ ⎞3 ⎤ μ E[ X 3 ] − 3μσ 2 − μ 3 ⎟ ⎥= 3 = , 3 ⎢⎝ σ ⎠ ⎥ σ σ3 ⎣ ⎦
γ = E ⎢⎜
(A6)
where μ is the mean and σ is the standard deviation of the random variable X. The kurtosis is a measure of the ‘peakedness’ (the ratio of variance and mean) of the probability distribution of a real-valued random variable which is equal to the fourth moment around the mean divided by the square of the variance of the probability distribution minus 3: μ κ = 4 −3 . σ4
520
(A7)