First Experiments on a new Online Handwritten Flowchart Database Ahmad-Montaser Awal1, Guihuan Feng2, Harold Mouchère1, Christian Viard-Gaudin1 1 IRCCyN/IVC – UMR CNRS 6597 Ecole polytechnique de l’université de Nantes Rue Christian Pauc – BP 50609 – 44306 Nantes CEDEX 3 – France {ahmad-montaser.awal, harold.mouchere, christian.viard-gaudin}@univ-nantes.fr 2 Software Institute, Nanjing University 22 Hankou Road – Nanjing – 210093 – China
[email protected]
ABSTRACT We propose in this paper a new online handwritten flowchart database and perform some first experiments to have a baseline benchmark on this dataset. The collected database consists of 78 flowcharts labeled at the stroke and symbol levels. In addition, an isolated database of graphical and text symbols was extracted from these collected flowcharts. Then, we tackle the problem of online handwritten flowchart recognition from two different points of view. Firstly, we consider that flowcharts are correctly segmented, and we propose different classifiers to perform two tasks, text/non-text separation and graphical symbol recognition. Tested with the extracted isolated test database, we achieve up to 99% and 96% in text/non-text separation and up to 81.3% in graphical symbols recognition. Secondly, we propose a global approach to perform flowchart segmentation and recognition. For this latter, we adopt a global learning schema and a recognition architecture that considers a simultaneous segmentation and recognition. Global architecture is trained and tested directly with flowcharts. Results show the interest of such global approach, but regarding the complexity of flowchart segmentation problem, there is still lot of space to improve the global learning and recognition methods. Keywords: Handwriting, recognition, segmentation, database, bi-dimensional languages.
1. INTRODUCTION Nowadays, devices that rely on digital pen are widely used. PDAs, tablet PCs or electronic white boards are such examples. One of the main purposes is to ease information input. Thus, the emergence of such devices makes it indispensable to develop tools and systems capable of converting handwritten inputs into digital formats. Handwritten text recognition systems have achieved recently significant progress, thanks to developments in segmentation, recognition and language models. Those systems are less powerful when the languages to be recognized have a two dimensional (2D) layout. This is the case for mathematical expressions [1], schemas [4], diagrams [2,3,5,6,7], etc. In this case, it yields to solve the same problems of segmentations, recognition and interpretation but in a 2D context. Resolving bi-dimensional languages recognition problem implies being capable of solving three sub problems: segmentation, symbol recognition and interpretation. Flowcharts are often used to describe algorithms or processes. When drawing a flowchart, graphical symbols, such as circles and arrows are used to represent the control flow. In addition, texts are employed to provide detailed information of each symbol. With the development of digital ink capturing devices, nowadays people can easily input flowchart diagrams into computers. By taking advantage of sketch recognition technology, the inaccurate handwritten information can be translated into more accurate diagrams, so as to be used for further editing and searching operations. The recognition strategy of handwritten texts and handwritten graphics are not the same. Therefore, one critical problem in the recognition of flowcharts is to separate the strokes of texts and graphics, so that they can be sent to the appropriate recognizer. There are many researches focused on the recognition of handwritten diagrams. SketchIT [2] is a sketchbased mechanical system design system, where the sketch can be interpreted and transformed into working geometry. Qi
et al. [3] employ Bayesian conditional random fields to disambiguate the hand drawn organization charts. Feng et al. [4] propose an approach to locate the interspersed symbols from electric circuit diagrams. However, the above researches focus only on the recognition of handwritten graphics, and no texts are included. Tahuti [5] is a sketch recognition prototype for UML class diagrams. Although text recognition is not supported, users are able to enter texts through a virtual keyboard. Yuan et al. [6] uses hybrid SVM-HMM to recognize handwritten flowcharts, and ICA (Independent Component Analysis) is employed to reduce the dimension of features. However, graphic symbols are restricted to be drawn in a single stroke. Moreover, the user is to choose the input mode (text or graphical symbols). Tilak and Ananthakrishna [7] also developed a recognition system for class diagrams in UML. People can add details associated with the symbol in text boxes, i.e. texts and graphics are explicitly distinguished by the user. Our scope in this paper is to push further these constraints by allowing several strokes for a given symbol, and mixing texts and symbols altogether with no explicit separator. In Section two, we introduce the online handwritten flowchart dataset. Then, we propose two scenarios for flowcharts recognition. We suppose first that the segmentation process is correctly achieved, though we focus on isolated symbols recognition. Then, we propose an integral system to perform symbol segmentation as well as symbol recognition.
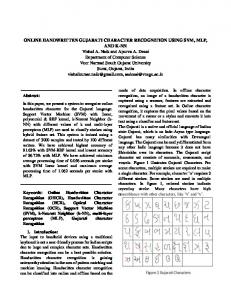
2. FC DATABASE As it is the case in most of recognition systems, it is essential to have a representative database. Such database is important to train, tune, and evaluate the performance of those systems. Since there is no publicly available database of flowcharts, we propose in this paper an online handwritten flowchart database. However, we have started with a small database as a first step towards a more complex representative database. All this data (and those which will be collected later) will be available on-line. 2.1 Flowchart acquisition We have selected seven flowcharts with different complexity. Some of them describe famous algorithms (factorial numbers, bubble sort, neural network training). Others are simple flowcharts that describe some basic operations (square of a number, sum of N numbers, …). Those flowcharts contain six different graphical symbols (Figure 1) that represent basic operations needed in such kind of flowcharts. In addition, descriptive texts are strongly presented in all the parts of a flowchart. Furthermore, text can vary from a simple isolated word, simple phrase, math equations, up to a block of text.
Figure 1 Samples of symbols considered in flowcharts
Members of our research group and students from electrical engineering department have participated in handwriting some or all of those seven flowcharts using the Anoto® pen technology. Figure 2 shows an example of a template
flowchart and the corresponding handwritten one. Writers were given all the freedom to copy the flowchart in any way they want, i.e. it is accepted not to respect the layout of the symbols in the flowchart and there is no constraint in the writing order or direction. In addition, in observing the collected flowcharts, we noticed a grand variety in drawing styles. Some writers tend to draw flowchart operations (process, decision, …) in one stroke, while others draw them in three or more strokes. Others tend to complete arrows heads after finishing all or a big part of the flowchart. This freedom in writing directions and the variety of text and drawing styles present in flowcharts raise significantly the challenge of flowchart recognition. Therefore, we will focus at this stage of our research on the problem of distinguishing between text and non-text (graphical symbols) in the flowchart. Once text is separated from other symbols, the problem of text recognition itself is a more classic problem with many possible solutions to recognize words, phrases, math equations and text blocks. On the other hand, symbol recognition is as well a classic pattern recognition problem, the complexity of which depends on the constraints asked to the user to draw the symbols.
Figure 2 Example of a template flowchart and the corresponding handwritten one
2.2 Corpus of handwritten Flowcharts A total number of 78 flowcharts has been collected. Table 1 shows the constitution of both train and test flowchart databases, writers being different in the two cases. Complementary, we aim at increasing this database up to 200 flowcharts by the date of final paper submission. The database will be soon freely available. Table 1 Constitution of the online handwritten flowchart databases # Writers
# FC
#Symbol
Train
10
60
1287
Test
3
18
409
Currently we do not consider the semantic of flowcharts in recognition. Moreover, there is no standard description of flowcharts that could serve as a semantic ground truth. Therefore, flowcharts have been only labeled at symbol and stroke levels. Another important property of flowcharts is the large amount of texts compared to other symbols. Considering only the problem of separation between text and other symbols, all types of text are labeled as text. Similarly, all types of arrows (down, up, left, ….) are labeled as arrow. As we proposed (see section 4) a global learning schema, it is important to evaluate the performance at symbol segmentation and recognition levels. However, regarding
the complexity of the problem, especially with the presence of different types of text, we will consider evaluation at stroke level. Another advantage of such evaluation is taking into account the large number of strokes in texts comparing to other classes. Table 2 shows the distribution of different symbols and their strokes count in the flowchart database. Table 2 Symbols and strokes distribution in the flowchart database Train
Test
Symbols
Strokes
Symbols
Strokes
Process
160
480
51
167
Terminator
67
90
23
23
Arrow
420
907
131
329
Connection
39
42
10
13
Data Decision
72 75
270 291
23 24
90 118
Text
454
3342
147
1127
Total
1287
5422
409
1867
We can notice from Table 2 that 30% of the components of flowcharts are text. In addition, text strokes presents more than 60% of flowchart total strokes. This fact assures that classic segmentation and recognition methods will have difficulties in resolving this kind of problems. We propose two different scenarios for flowchart recognition. First, we considered that the segmentation step is successfully achieved. Hence, the problem is transformed to an isolated symbol recognition one. However, we keep the definition of our problem as a problem of separation between text and the other symbols even in an isolated way. The isolated symbols database has been extracted from the flowchart database, see Table 2. Secondly, we will try to resolve the whole chain at once. For that, we consider a global architecture that performs a simultaneous segmentation and recognition.
3. ISOLATED SYMBOL RECOGNIZERS Isolated symbols recognition is a classic pattern recognition problem. We present here three approaches for the isolated symbol recognition, the first one is based on a single feature based on the entropy theory, and the last two are based on classical pattern recognition tools. 3.1 Entropy approach Intuitively, graphic symbols are more structural compared with texts. This is because texts are usually composed of several cursive strokes, while the strokes of graphics are less complex. Hence, by evaluating the complexity of constitutional strokes, it is possible to separate texts from graphics. According to the information theory [8], entropy is a measure to evaluate the disorder of signals. The more disorder the signal is, the larger entropy will be. In this paper, the degree of disorder of strokes is measured with the angle of points. For each group of strokes, we first calculate the angles of the re-sampling points. Then the angles are assigned in one of the eight areas, i.e. [0,
π
π π π 3π 3π π π 5π 5π 3π 3π 7π 7π ),[ , ),[ , ),[ , ),[ , ),[ , ),[ , ),[ , π ) respectively. By 8 8 4 4 8 8 2 2 8 8 4 4 8 8
calculating the distribution of the angles in each area, we can get the entropy of strokes according to Eq.(1). n
H = − k ∑ P ( X i ) lo g P ( X i )
(1)
i =1
Table 3 is an example showing the entropy of a graphic symbol and a piece of text. Blue points denote the re-sampling points. Concerning graphic symbol, the angles fall mainly inside the area of [7π 8, π ) , while the distribution of angles of
text is more scattered, leading to a larger entropy. Therefore, when selecting an appropriate threshold, we can correctly separate graphic strokes from texts strokes. Table 3 Example of entropy between graphic symbol and text
π
[0, ) 8
[ , ) 8 4
π π
π 3π [ , ) 4 8
0.00
0.00
4.26
6.38
3π π , ) 8 2
π 5π [ , ) 2 8
0.00
2.44
2.44
0.00
2.13
2.13
8.51
10.64
[
[
5π 3π , ) 8 4
[
7π ,π ) 8
Entropy
2.44
92.68
5.13
14.89
51.06
25.29
3π 7π , ) 4 8
[
The problem is that the entropy will vary with the size of samples under a constant re-sampling technique. The bigger the sample is, the less the entropy will be. The reason lies on that large sample results in dense re-sampling points. The closer the re-sampling points are, the more likely the angle fall inside [7π 8, π ) . More specifically, texts written in large size will achieve smaller entropy. Consequently, it will be difficult to separate it from graphic. In our approach, the re-sampling distance is automatically tuned with respect to the total length of the strokes, namely the longer the stroke, the bigger the re-sampling distance. This new re-sampling technique assures that handwritten symbols with the same information but not the same size have similar distribution of re-sampling points, leading to identical entropies. An example is given in Figure 3. Under a constant re-sampling distance (the first row), the entropy of “text” written in smaller size is 10.95, while the entropy of “text” written in larger size is only 4.26. But when adopting the new re-sampling technique (the second row), the entropy of these two sample are 14.19 and 14.13 respectively, which is very similar.
Entropy = 10.95 (fixed re-sampling distance)
Entropy = 4.26 (fixed re-sampling distance)
Entropy = 14.19 (adaptive re-sampling distance)
Entropy = 14.13 (adaptive re-sampling distance)
Figure 3 Entropy of strokes under different re-sampling techniques However, using the entropy allows only to separate text from the other symbols. In the objective to propose more discriminant classifiers, we propose the use of more powerful classifiers (neural networks and support vector machines). Those classifiers will allow a direct recognition of all six graphical symbols in addition to the capacity of identifying the text in the flowchart. 3.2 Pattern recognition tools Here we present a more classical approaches already used for character or mathematical symbol recognition [10]. In order to adapt it to flowchart specificity, a step of pre-processing is necessary. 3.2.1 Preprocessing of the symbols Firstly, the input signal is normalized to a box centered to the coordination center with a fixed size to avoid writing variety and signal translations in the writing space. Then, the input signal is re-sampled into 30 points adding imaginary points for the trajectory between a stroke and the next one, Figure 4. Then, seven characteristics are extracted for each point reflecting the position, direction, curvature, and a last one to determine whether the point is an original one or an imaginary point. As a result, we obtain a 210 dimension input vector.
Concerning flowchart symbols recognition, there is a specificity that must be taken into consideration. In fact, these features are sensitive to trajectory writing direction and strokes order. This property does not have much impact for text or character recognition because there is a kind of stability due to writing rules learned in our early stages of life. However, this is not the case for graphical symbols even the same symbol can be written in different ways, see Figure 4. This is due to writers habits in drawing which is not necessary learned in a similar way for everyone and, maybe, it depends of the context in which the symbol is written.
Figure 4 Examples of disorder caused by the re-sampling process In order to avoid this instability we will apply a preliminary step consisting in re-ordering the strokes of the input signal before applying the other pre-processing steps. This consists in minimizing the pen-up distance by changing the drawing direction and the stroke order. For example, the case b and c of the Figure 3 will have the same drawing as in the case a. 3.2.2 Neural networks Time delayed neural networks (TDNN) [9] have been proved to have interesting properties of being insensitive to position shifts. The key point of such approach is to train the network with local information of the input signal instead of seeing it as a whole. This kind of classifiers has achieved a good performance not only in recognizing isolated characters 13] and words [9], but also in recognizing mathematical symbols in isolated and global ways [10]. The architecture of the TDNN consists of two main parts. The first part corresponds to several convolution filters, this layer sees the input signal partially by shifting a window, with a weight sharing concept, on the normalized re-sampled input signal. Thus, characteristics are seen locally via the neurons of the next layer. The second part of a TDNN is a classic multi-layer perceptron (MLP) which takes the output of the TDNN as its input. Finally the output neurons number corresponds to the number of desired classes. The whole network is trained with a classic gradient-based backpropagation algorithm. 3.2.3 Support vector machines Support vector machines [11] (SVM) are well known for their discriminate capacity. In spite of their important memory requirement, it is always interesting to compare other classification approach to this kind of reference. In this experiment,
SVMs use a Gaussian kernel (with a standard deviation optimized experimentally) and are combined using a one against all strategy.
4. GLOBAL LEARNING / RECOGNITION APPROACH An online flowchart is input to the system as a set of strokes. So, recognizing a flowchart consists in finding the best possible grouping of those strokes to represent non-text symbols and texts. We adopt a global learning method to train the classifier directly from flowcharts instead of using a pre-trained recognizer from a set of isolated symbols. We use the TDNN described previously as a classifier. In this case, training algorithm takes into account the ground truth of the given flowchart (ideal segmentation and corresponding labels of symbols) and the best current interpretation resulting from a specific segmentation, and corresponding recognized symbols. The advantage is that we can handle situations where the 2D segmentor gives a hypothesis of stroke grouping that does not represent symbols; it is considered as a “Junk” situation. As a consequence, global learning can train the classifier to recognize an additional special class, called: “Junk class”. This same system has been successful used with another 2D language (mathematical expressions) [9]. The system architecture can be briefly described by: • A hypothesis generator: lists a number of possible combinations of strokes.. From a computing perspective, it can be considered as a Dynamic Programming (DP) algorithm, which is well adapted to this kind of decision making problems [12]. However, the key point is that this is not a standard 1D-DP but we adopt an extension to a 2D-DP. To avoid the combinatory explosion of the search space, some constraints are added limiting the maximum number of strokes in one symbol and of the maximum number of hypothesizes. • A symbol recognizer: provides, in addition to the label of each hypothesis, a recognition score that will be used to define the recognition cost measured in a negative log scale. We use the TDNN proposed previously as symbols classifiers with an additional class, to be able to identify junk hypotheses. • Structural analyzer: provides structural information about each hypothesis so that contextual evaluation can be performed. A decision maker: organizes all the symbol hypotheses, and selects the one that minimizes the cost. Currently we do not consider structural and contextual information in this architecture. Therefore, the decision is only based on the cost returned from the symbols classifier avoiding the junk hypothesis. However, it is obvious that this global architecture will be less powerful on recognizing flowcharts comparing to its capacity in mathematical expressions recognition. This is due to the lack of structural and contextual information in the decision making process (there is no language modeling). Nevertheless, experiments show an interesting potential in adopting a global approach in order not only to separate text/non-text and recognize symbols, but also in segmenting flowcharts.
5. EXPERIMENTS AND RESULTS 5.1 Isolated symbol recognizer performance For both classifier, TDNN and SVM, the classifier is trained with the isolated symbols train dataset, Table 2. On the other hand, the separation threshold is tuned based on the training samples for the classifier base on the entropy theory. All classifiers are then tested with the test data set, see Table 2. Table 4 shows that the entropy theory succeeded in separating more than 90% of text and non-text correctly when using an adaptive re-sampling technique. However, the recognition recall rate of symbols drops a lot under a classical resampling technique (with fixed re-sampling distance), especially on texts. On the other hand, using discriminative classifiers improve the separation performance by almost 6%. Another advantage of using TDNN and SVM is that they can easily be extended to recognize graphical symbols. With these two classifiers we achieve 81.3% of correctly recognized symbols (among the 6 symbols). Most of errors come from the terminator and connection classes. The terminator class is mostly mistaken with the process class because of the similarity between the two forms.
Table 4 Isolated classifier performance on text/non-text problem Text vs. non-text (2 classes) Text
Symbols (non-text)
Graphical symbols
Recall rate
Recall rate
(6 Classes)
Entropy theory (classical re-sampling)
128/147=87.07%
240/262=91.60%
--
Entropy theory (adaptive re-sampling)
139/147=94.56%
241/262=91.98%
--
TDNN
141/147=95.92%
253/262=96.57%
81.3%
SVM
146/147=99.32%
249/262=95.04%
81.3%
Recognizer
We see that all three classifiers (with less or more precision) are able to separate text from non-text in a flowchart with lot of success. We trained another TDNN and SVM to the six graphical symbols classifying problem. Thus, we can imagine a two step classifier, where firstly we separate text and graphical symbols, and then recognize the symbols. Table 5 shows the results using those two new symbol classifiers. Table 5 Isolated Classifier performance on graphical symbols problem Recognizer
Graphical symbols (6 classes)
TDNN
84.4%
SVM
87%
We notice from Table 5 a slight improvement on both classifiers specified on graphical symbols recognition. We achieve 84.4% and 87% of symbols correctly recognized using TDNN and SVM classifier respectively. We believe that using a combined classifier could improve even more the graphical symbols classification. However, classifiers combination is out of the scope of this paper. 5.2 Flowchart recognizer performance Due to the lack of structural/contextual information the recognition results are evaluated at stroke level. Thus, the performance is evaluated by the capacity of the system to identify whether a given stroke is correctly assigned to a text/non-text class. We consider two ways to calculate stroke recognition rates. First, we consider only the strokes in correctly segmented symbols as being correctly identified, this case is referred to as “totally” identified. Secondly, we consider strokes correctly identified even if they were not in a correctly segmented symbol, referred to as “partially” identified. In both cases, we consider a text to be correctly segmented even if it represented only a sub-part of a text bloc. This latter case is adopted because most of text blocs contain so many strokes compared to other symbols. Hence, some text blocks would never be correctly segmented due to the limitation of the max number of strokes per hypothesis. Table 6 Stroke recognition rates on flowchart test database Totally
Partially
TextStrokes
Symbol Strokes
TextStrokes
Symbol Strokes
83.3%
41.22%
89.44%
56.62%
Table 6 shows that the global system segments and identifies correctly 83.3% of text from flowcharts. However, it identifies only 41.22% of non-text strokes which represents 45.8% of correctly segmented graphical symbols among which 79.9% of graphical symbols are correctly recognized. This is due principally to the strong similarity between some
sub-symbols (the horizontal upper part of a process for example) which is learned as junk and other symbols (a horizontal arrow for example). We think that adding structural and contextual information to the flowchart recognition process will help to avoid such ambiguities and improve the performance of the global flowchart recognizer.
6. CONCLUSION AND PERSPECTIVE In this paper, we introduced a new flowchart database available freely. Furthermore, we proposed several first results with this database considering one problem in two contexts : the separation of text/non-text strokes in isolated symbols and in a global task. This first results show in one hand that existing tools can easily be adapted to this new problem, but in the other hand that this problem of flowchart recognition is still an open problem. We aim at increasing the size of the flowchart database by the time of final version submission in order to make it more representative.
REFERENCES 1. Blostein D., Grbavec A., “Recognition of mathematical notation”, in Handbook on Optical Character Recognition and Document Image Analysis, Queen's university, World Scientific Publishing Company: Kingston, Ontario, Canada, 557-582 (1997). 2. Stahovich, T., “Sketchit: a sketch interpretation tool for conceptual mechanism design”, Technical report, MIT AI Laboratory, (1996). 3. Qi Y., Szummer M. and Minka T.P., “Diagram structure recognition by bayesian conditional random fields”, In Proceedings of the IEEE International Conference on Computer Vision and Pattern Recognition(CVPR’05), pp.191196 (2005). 4. Feng GH, Viard-Gaudin C., Sun ZX, “On-line hand-drawn electric circuit diagram recognition using 2D dynamic programming”, Pattern Recognition, Vol 42(12): 3215-3223 (2009). 5. Hammond, T. and Davis, R. Tahuti, “A Geometrical Sketch Recognition System for UML Class Diagrams”, In Proceedings of 2002 AAAI Spring Symposium on Sketch Understanding (2002). 6. Yuan ZM, Pan H and Zhang L., “A novel pen-based flowchart recognition system for programming teaching”, Lecture Notes in Computer Science, Vol. 5328, pp. 55-64 (2008). 7. Tilak G. and Ananthakrishnan K., “SketchUML – Sketch based approach to Class Diagrams” In Proceedings of IUI (2009). 8. Shannon C.E., “A mathematical theory of communication”, Bell System Technical Journal, vol. 27, pp. 379-423, 623-656 (1948). 9. Schenkel M., Guyon I. and Henderson D., "Online cursive script recognition using time delay neural networks and hidden Markov models", Mach. Vis. Appl., Special Issue on Cursive Script Recognition 8, 215-223 (1995). 10. Awal A.M, Mouchère H., Viard-Gaudin C., "Towards handwritten mathematical expression recognition", tenth International Conference on Document Analysis and Recognition, Barcelona, Spain, 1046-1050 (2009). 11. Cortes C. and Vapnik V., "Support-vector networks", Machine Learning , 20(3), 273-297 (1995). 12. M. Held, R.M.K., The construction of discrete dynamic programming algorithms, IBM Syst. J. 4(2): 136-147, (1965). 13. Poisson E., Viard-Gaudin C. and Lallican P.M., “Mutli-modular architecture based on convolutional neural networks for online handwritten character recognition”, In proceedings of 9th International Conference on Neural Information Processing, IEEE Neural Network Socieaty, Singapore, (2002).