2013 IEEE 4th Control and System Graduate Research Colloquium, 19 - 20 Aug. 2013, Shah Alam, Malaysia
First Year Performance Monitoring of AmorphousSilicon Grid-Connected Photovoltaic System M. Z. Hussin, Z. M. Zain, A. M. Omar
S. Shaari
Green Energy Research Centre (GERC), Faculty of Electrical Engineering, Universiti Teknologi MARA (UiTM), 40450 Shah Alam, Selangor Darul Ehsan, Malaysia
[email protected]
Faculty of Applied Sciences, Universiti Teknologi MARA (UiTM), 40450 Shah Alam, Selangor Darul Ehsan, Malaysia. modules in PrachinBuri province, and 84 MW Sharp PV modules located in the province of LopBuri, Thailand [7]. For equatorial with fully humid climate [8], Malaysia also has the potential to harvest a lot of energy due to the relatively high irradiance, temperature and humidity; which gives TFPV modules to react better performance because of the advantages of a smaller temperature coefficient. The study aims to evaluate the performance indices of 0.9 kWp a-Si GC system through one-year field test in Malaysia. In addition, the study is able to fulfill the shortage of studies on the GC system's performance using TFPV technology.
Abstract— This paper presents the performance indices with total nominal array power of 0.9 kWp Grid-Connected Photovoltaic (GCPV) system using amorphous-Silicon (a-Si) for the first year of operation in Malaysia. Since operation, a-Si GC system injected into the grid with the total energy production about 1,138.2 kWh. In addition, the annual array yield, final yield, and inverter efficiency were operated at 1,401 kWh/kWp, 1,261 kWh/kWp, and 90.2 %, respectively. The operation of a-Si GC system indicates that the system was operated well with the measured performance ratio at 85 % during the study period. Index Terms - amorphous-Silicon (a-Si); Grid-Connected (GC); Photovoltaic (PV); Performance Indices.
I.
II.
INTRODUCTION
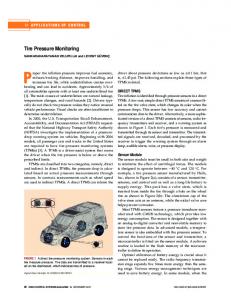
The system is rated at 0.9 kW GC system using a-Si Kaneka K60 PV modules. The picture and specification of a-Si GC system installed at GERC, Universiti Teknologi Mara (UiTM) Shah Alam, Malaysia are presented in Fig. 1 and Table I.
Large-scale applications for solar farm are only beginning to be established in Malaysia's market. More than 69.52MW of solar PV-non individual has been approved for FiA application (2011-2014), but the solar PV's market potential is huge, given the excellent solar resources in Malaysia[1]. In addition, a feed-in tariff (FiT) scheme was introduced by the Government of Malaysia (GoM) has been promoting and encouraging consumers to adopt energy efficiency measures to reduce energy consumption as well as greenhouse gas benefits. The most popular installation comes from crystallineSilicon (c-Si) as the majority in the installation of the GCPV system in Malaysia's environment, compared to the thin-film (TF) PV technology [2]. However, the operation of the irradiance and temperature will remain important factors to be considered. In terms of reliability, it can be said that the c-Si PV technology has been proven in the field testing, which has shown consistently in delivering energy for many years [3]. It can be concluded that the system degradation with the longterm stability test results for the aging factor (median = 0.8 %/yr) [4, 5]. However, TFPV technology has given new attention, and many studies have been dedicated to the development of this technology. Current market trends indicate that the TFPV technology share increasing around the world [6]. In the ASEAN countries, amongst large-scale applications using TFPV technology such as 8.7 MW DuPont Apollo PV
978-1-4799-0552-2/13/$31.00 ©2013 IEEE
SYSTEM DESCRIPTION
Fig. 1. Top view of a-Si GC system (violet color) installed at the GERC, UiTM Shah Alam.
TABLE I. Subject PV technology PV module technology Model Nominal peak power Open circuit voltage Short circuit current Nominal voltage Nominal current Module efficiency
59
SYSTEM SPECIFICATION.
Specification Thin-film (TF) Single-junction amorphous-Silicon (SJ a-Si) Kaneka K60 60 W 92 V 1.19 A 67 V 0.9 A 6.3 %
2013 IEEE 4th Control and System Graduate Research Colloquium, 19 - 20 Aug. 2013, Shah Alam, Malaysia
30
120
25
100
20
80
15
60
(1)
Final Yield;
E Y f = AC P0
Irradiation
(2)
Ambient
Fig. 2. Monthly irradiation and ambient temperature profles.
Reference Yield;
B. Performance Indices - Energy Production
40
40 20
20
0
0 Jun-11
Datasets were taken for one year monitoring period from June 2011 to May 2012. All datasets were extracted from the SMA monitoring system for each 5-minute interval. Datasets have been analyzed to evaluate the performance indices of a-Si GC system under Malaysian outdoor condition.
60
60
AC Energy
DC Energy
Inverter Efficiency
Fig. 3. Monthly energy production and inverter efficiency.
60
Inverter Efficinecy (%)
(8)
80
May-12
LS = Ya − Y f
80
Apr-12
System Losses;
100
Feb-12
(7)
100
Mar-12
Array Capture Losses; LC = Yr − Ya
(6)
120
Jan-12
P = AC × 100% Gi Aa
Energy Production (kWh)
System Efficiency;
Dec-11
(5)
Nov-11
(4)
Oct-11
PV Array Efficiency; P η pv = DC × 100% Gi Aa
In the first-year, the system has generated 1,261 kWh/y of DC energy with the AC energy produced at 1,135 kWh/y, where the conversion efficiency of the inverter was 90.2 %. This means that the daily energy production was 3.11 kWh per day. As shown in Fig. 3, especially in November and December 2011, the output energy production has decreased dramatically, which could be caused by worst weather conditions such as rain.
Sep-11
Performance Ratio; Yf PR = Yr
(3)
Aug-11
Ht G stc
Jul-11
Yr =
η sys
May-12
0 Apr-12
0 Mar-12
5 Feb-12
20 Jan-12
10
Dec-11
40
Ambient Temperature (˚C)
35
140
Jun-11
Array yield;
160
Oct-11
Irradiation (W/m2)
The installation and monitoring systems comply with the standards of MS IEC 1837:2010 [9] and MS IEC61724:2010 [10]. There are several formula will be used in order to assess the performance of the GCPV system according to International Agency Photovoltaic Power System (IEA-PVPS) Program Task 2 [11]. For GC system, the system performance indicator calculated based IEA-PVPS, thus benchmarking this system against other systems, as can be seen in Eq. 1 - 7;
Nov-11
RESEARCH METHODOLOGY
Sep-11
1320 W 400 V 100 V... 320 V 1200 W 92.1%
E Ya = DC P0
RESULTS AND DISCUSSION
A. Irradiance and Temperature From the results obtained, the potential for harvesting solar energy was measured by the average daily irradiation of 4.07 kWh/m2, where the total cumulative irradiation for the entire year was 1,490.1 kWh/m2. In addition, the mean monthly ambient temperature was 31.2°C. An overview of the meteorological data for June 2011 until May 2012 is illustrated in Fig. 2.
Aug-11
III.
IV.
0.9 kWp 5 parallel x 3 series 15 units
Jul-11
Array Nominal array power Array configuration Number of PV module Inverter Max. DC power Max. input DC voltage MPP-voltage Nominal AC power Max efficiency
2013 IEEE 4th Control and System Graduate Research Colloquium, 19 - 20 Aug. 2013, Shah Alam, Malaysia
C. Yields
May-12
Apr-12
Mar-12
Feb-12
Array Efficiency
Fig. 4. Monthly array and final yields.
Irradiation
May-12
Apr-12
80 60 40 20
Fig. 6 plots the monthly basis for the measured array and inverter efficiencies for the first year of operation. The data recorded from the test site reveals that the higher values in array efficiency in the first several months. The annual values of array and system efficiencies were 5.93% and 5.35%, respectively.
Final Yield
Array Capture Losses
May-12
System Losses
Fig. 7. Monthly final yield and overall losses.
61
Apr-12
Mar-12
Feb-12
Jan-12
Jun-11
E. Array And System Efficiencies
Dec-11
0
Fig. 5. Monthly performance ratio and irradiation.
Nov-11
0
100
Oct-11
0
120
Sep-11
20
Final Yield and Losses (h/m)
20
Irradiation
40
140
May-12
40
Apr-12
60
Mar-12
60
Feb-12
80
Jan-12
80
Dec-11
100
Nov-11
100
Oct-11
120
Sep-11
120
Aug-11
140
Jul-11
140
(kWh/m2)
With respect to the performance ratio, the annual performance ratio was 85% which indicates good performance, according to [11], with the highest monthly value by 90% in June 2011, as shown in Fig. 5.
Jun-11
Mar-12
Apart of the performance ratio and efficiency, the capture array and system losses were also analyzed. Fig. 7 describes the monthly irradiation with overall losses of the system during operation. For the annual values, the array capture and system losses were demonstrated at 89.1 h/y and 139.9 h/y, respectively. The system losses demonstrate the larger portion compared to array capture losses due to conversion efficiency of the inverter and AC cabling. However, the array capture losses show marginal increase in array losses each month during operation, and it may be due to the loss of temperature, dirt, DC wiring cable, etc.
D. Performance Ratio (PR)
Performance Ratio (%)
Feb-12
F. Array Capture and System Losses
Final Yield
Performance Ratio
System Efficiency
Fig. 6. Monthly array and system efficiencies.
Jul-11
Array Yield
Jan-12
Dec-11
Nov-11
Oct-11
Sep-11
Aug-11
Jul-11
Jun-11
0
Jan-12
20
Dec-11
4.0 Jun-11
40
4.4
Nov-11
60
4.8
Oct-11
80
5.2
Sep-11
100
5.6
Aug-11
Yields (kWh/kWp)
120
6.0
Aug-11
140
6.4
Jul-11
Array and System Efficiency (%)
For the first year of operation, the annual array and final yield values were measured 1,401 kWh/kWp.y and 1,261 kWh/kWp.y, respectively, as illustrated in Fig. 4.
2013 IEEE 4th Control and System Graduate Research Colloquium, 19 - 20 Aug. 2013, Shah Alam, Malaysia
V.
CONCLUSION
[6]
Under the Malaysian climate, GC system operations in terms of performance in a-Si PV modules have been analyzed. For the entire monitoring period, a-Si GC system has been operating well. In the case of performance indices, the annual values were summarized as follows;
[7]
[8]
DC energy generation AC energy production Array yield Final yield Performance ratio Inverter efficiency Array efficiency System efficiency Array capture loss System losses
= 1,261 kWh/y = 1,135 kWh/y = 1,401 kWh/kWp.y = 1,261 kWh/kWp.y = 85 % = 90.2 % = 5.93 % = 5.35 % = 89.1 h/y = 139.9 h/y
[9]
[10]
[11]
Related to the system's behavior during the first year of operation, we would like to highlight the following; (a) high initial performance ratio during operation, especially in the first outdoor exposure, (b) high initial output for array and system efficiencies in the first exposure, and, the output becomes decreases slowly after several months of operation, and (c) array capture losses, reflecting the slightly increased for each month. However, the performance should be investigated to characterize and evaluate the data for second year in a comparison of performance indices before any conclusions can be drawn. ACKNOWLEDGMENT The authors express deep gratitude to the Green Energy Research Center (GERC) and Universiti Teknologi MARA (UiTM) for providing the funds and facilities for this work. REFERENCES [1] [2]
[3]
[4]
[5]
Sustainable Energy Development Authority, "SEDA Annual Report 2011," 2011. M. Z. Hussin, N. Hasliza, A. Yaacob, Z. M. Zain, A. M. Omar, and S. Shaari, "A Development and Challenges of Grid-Connected Photovoltaic System in Malaysia," in Proceedings of IEEE Control and System Graduate Research Colloquium (ICSGRC), Shah Alam, Malaysia, 2012, pp. 191-196. E. D. Dunlop and D. Halton, "The Performance of Crystalline Silicon Photovoltaic Solar Modules After 22 Years of Continuous Outdoor Exposure," Progress in Photovoltaics: Research and Applications, vol. 14, pp. 53-64, 2006. D. C. Jordan and S. R. Kurtz, "Photovoltaic Degradation Rates— An Analytical Review," Progress in Photovoltaics: Research and Applications, vol. 21, pp. 12-29, 2013. D. C. Jordan, J. H. Wohlgemuth, and S. R. Kurtz, "Technology and Climate Trends in PV Module Degradation," in Proceedings of the 27th European Photovoltaic Solar Energy Conference and Exhibition, Frankfurt, Germany, 2012.
62
K. Ardani and R. Margolis, "2010 Solar Technologies Market Report," National Renewable Energy Laboratory,2011. D. Kruangam, "Solar Photovoltaic Market Investment and Tax Planning in Thailand," in Presented at Taiwan International Photovoltaic Forum and Exhibition, , Taipei World Trade Center (TWTC), Taiwan, 2012. M. Kottek, J. Grieser, C. Beck, B. Rudolf, and F. Rubel, "World Map Of The Koppen-Geiger Climate Classification Updated," Meteorologische Zeitschrift, vol. 15, pp. 259-263, 2006. Department of Standards Malaysia, "MS 1837:2010 - Installation of Grid-Connected Photovoltaic (PV) Systems ", ed. 1st Revision, 2010. Department of Standards Malaysia, "MS IEC 61724:2010 Photovoltaic System Performance Monitoring - Guidelines for Measurement, Data Exchange and Analysis," ed, 2010. IEA-PVPS Task II, "Analysis of Photovoltaic Systems," ed, 2000.