Prepared in cooperation with Portland General Electric ... visit https:/store.usgs.gov. Any use of trade, firm, or product names is for descriptive purposes only and does ..... maximum inflow of 1,000 ft3/s and a minimum capture velocity of 6.3 feet per ...... occurring in conjunction with that of smolt-size fish in the late afternoon.
Prepared in cooperation with Portland General Electric
Fish Behavior and Abundance Monitoring Near a Floating Surface Collector in the North Fork Reservoir, Clackamas River, Oregon, Using Multi-Beam Acoustic Imaging Sonar
Open-File Report 2018–1182
U.S. Department of the Interior U.S. Geological Survey
Cover: Photograph showing North Fork Dam and the floating surface collector on the Clackamas River, Oregon, June 24, 2015. Photograph by Portland General Electric. Used with permission.
Fish Behavior and Abundance Monitoring Near a Floating Surface Collector in North Fork Reservoir, Clackamas River, Oregon, Using Multi-Beam Acoustic Imaging Sonar By Collin D. Smith, John M. Plumb, and Noah S. Adams
Prepared in cooperation with Portland General Electric
Open-File Report 2018-1182
U.S. Department of the Interior U.S. Geological Survey
U.S. Department of the Interior RYAN K. ZINKE, Secretary U.S. Geological Survey James F. Reilly II, Director U.S. Geological Survey, Reston, Virginia: 2018
For more information on the USGS—the Federal source for science about the Earth, its natural and living resources, natural hazards, and the environment—visit https://www.usgs.gov/ or call 1–888–ASK–USGS (1–888–275–8747). For an overview of USGS information products, including maps, imagery, and publications, visit https:/store.usgs.gov. Any use of trade, firm, or product names is for descriptive purposes only and does not imply endorsement by the U.S. Government. Although this information product, for the most part, is in the public domain, it also may contain copyrighted materials as noted in the text. Permission to reproduce copyrighted items must be secured from the copyright owner.
Suggested citation: Smith, C.D., Plumb J.M., and Adams, N.S. 2018, Fish behavior and abundance monitoring near a floating surface collector in North Fork Reservoir, Clackamas River, Oregon, using multi-beam acoustic imaging sonar: U.S. Geological Survey Open-File Report 2018-1182, 28 p., https://doi.org/10.3133/ofr20181182.
ISSN 2331-1258 (online)
Contents Abstract ......................................................................................................................................................... 1 Introduction .................................................................................................................................................... 2 Methods ......................................................................................................................................................... 4 Dam Operations and Environmental Conditions......................................................................................... 4 Imaging Sonars .......................................................................................................................................... 4 Surveillance System .............................................................................................................................. 4 Data Collection ...................................................................................................................................... 5 Data Processing .................................................................................................................................... 5 Data Analysis ......................................................................................................................................... 6 Fish Size and Count .............................................................................................................................. 6 Direction of Fish Travel .......................................................................................................................... 6 Track Characteristics ............................................................................................................................. 7 Evaluating the Fish Track Density near the Floating Surface Collector Entrance .................................. 7 Modeling Predators and Smolts in Front of the Floating Surface Collector ................................................ 7 Results........................................................................................................................................................... 9 Definition of Study Period ........................................................................................................................... 9 Dam Operations and Environmental Conditions......................................................................................... 9 Fish Abundance ....................................................................................................................................... 11 Direction of Travel .................................................................................................................................... 12 Fish Tortuosity and Swimming Velocity .................................................................................................... 15 Timing of Detection .................................................................................................................................. 17 Spatial Fish Distribution............................................................................................................................ 17 Model Selection and Fit ............................................................................................................................ 19 Factors Affecting the Counts of Predators ........................................................................................... 20 Discussion ................................................................................................................................................... 23 Acknowledgments ....................................................................................................................................... 25 References Cited ......................................................................................................................................... 25
Figures Figure 1. Graphic showing Clackamas River Basin showing North Fork Reservoir and Dam, Oregon ........ 2 Figure 2. Orthoimage showing floating surface collector at North Fork Dam, Oregon, 2017 ....................... 3 Figure 3. Photograph of North Fork Reservoir floating surface collector and approximate coverage area of the ARIS® imaging sonar (red cone) in forebay of North Fork Reservoir, Oregon, 2017 ................... 5 Figure 4. Graph of Clackamas River discharge at U.S. Geological Survey hydrological site 14210000 located at Estacada, Oregon, April 19–June 1, 2017................................................................................... 10 Figure 5. Graph showing project and spillway discharge and reservoir elevation at North Fork Dam, Oregon, April 19–June 1, 2017 .................................................................................................................... 10 Figure 6. Graph showing turbidity and water temperature at North Fork Dam, Oregon, April 19–June 1, 2017 .................................................................................................................................. 11 Figure 7. Graph showing daily count of fish on the date of detection using the ARIS® imaging sonar at the floating surface collector at North Fork Reservoir, Oregon, 2017 ............................................ 12 Figure 8. Rose diagram of mean travel directions (in degrees) for smolt-size fish detected using the ARIS® imaging sonar outside the floating surface collector at North Fork Reservoir, Oregon, 2017 ...................... 13
iii
Figure 9. Rose diagram of mean travel directions (in degrees) for predator-size fish detected using the ARIS® imaging sonar outside the floating surface collector at North Fork Reservoir, Oregon, 2017 ........... 14 Figure 10. Diagram of directional travel for smolt-size fish detected in the presence or absence of predator-size fish using the ARIS® imaging sonar outside the floating surface collector at North Fork Reservoir, Oregon, 2017 ............................................................................................................................. 15 Figure 11. Boxplots of the tortuosity index and swimming velocity of fish observed with ARIS® imaging sonar near the entrance to the floating surface collector in the North Fork Reservoir, 2017........................ 16 Figure 12. Graph showing count of fish by hour of detection using the ARIS® imaging sonar at the floating surface collector at North Fork Reservoir, Oregon, April 19–June 1, 2017 ............................... 17 Figure 13. Graph showing the location point density for smolt-size fish detected using the ARIS® imaging sonar outside of the entrance to the floating surface collector at North Fork Reservoir, Oregon, April 19–June 1, 2017 .................................................................................................................... 18 Figure 14. Graph showing the location point density for predator-size fish detected using the ARIS® imaging sonar outside of the entrance to the floating surface collector at North Fork Reservoir, Oregon, April 19–June 1, 2017 .................................................................................................................................. 19 Figure 15. Graph showing the probability of zero-inflation by smolt-size fish abundance and day and night effects for the zero-inflation Poisson model of hourly predator-size fish counts near the entrance to the floating surface collector at North Fork Reservoir, Oregon .......................................................................... 22 Figure 16. Graphs showing the influence of smolt-size fish abundance by day and night for the zeroinflation Poisson model of hourly predator-size fish counts near the entrance to the floating surface collector at North Fork Reservoir, Oregon. .................................................................................................. 23
Tables Table 1. Summary statistics of hourly dam operations and environmental conditions at North Fork Dam, Oregon, April 19–June 1, 2017. ................................................................................................................... 11 Table 2. Mean travel directions and concentration parameter for fish observed using the ARIS® imaging sonar outside of the floating surface collector at North Fork Reservoir, Oregon, 2017. ............................... 12 Table 3. Summary statistics for the tortuosity and swimming velocity of fish observed using the ARIS® imaging sonar outside the floating surface collector at North Fork Reservoir, Oregon, 2017. ..................... 16 Table 4. Model selection results showing the model, the number of parameters, Akaike’s Information Criterion, and the change in AIC from the AIC lowest model (model 2). ...................................................... 21 Table 5. Parameter estimates and summary statistics for the zero-inflation Poisson model of hourly predator-size fish counts near the entrance to the floating surface collector at North Fork Reservoir, Oregon......................................................................................................................................................... 22
iv
Conversion Factors U.S. customary units to International System of Units Multiply foot (ft) acre acre acre gallon (gal) gallon (gal) acre-foot (acre-ft) acre-foot (acre-ft) foot per second (ft/s) cubic foot per second (ft3/s) International System of Units to U.S. customary units Multiply centimeter (cm) millimeter (mm) meter (m) kilometer (km) kilometer (km) hectare (ha) liter (L) meter per second (m/s) milligram (g)
By Length 0.3048 Area 4,047 0.4047 0.4047 Volume 3.785 0.003785 1,233 0.001233 Flow rate 0.3048 0.02832
To obtain meter (m) square meter (m2) hectare (ha) square hectometer (hm2) liter (L) cubic meter (m3) cubic meter (m3) cubic hectometer (hm3) meter per second (m/s) cubic meter per second (m3/s)
By Length 0.3937 0.03937 3.281 0.6214 0.5400 Area 2.471 Volume 0.2642 Flow rate 3.281 Mass 0.000035
To obtain inch (in.) inch (in.) foot (ft) mile (mi) mile, nautical (nmi) acre gallon (gal) foot per second (ft/s) ounce, avoirdupois (oz)
Temperature in degrees Celsius (°C) may be converted to degrees Fahrenheit (°F) as: °F = (1.8 × °C) + 32.
Datums Vertical coordinate information is referenced to the National Geodetic Vertical Datum of 1929 (NGVD 29). Elevation, as used in this report, refers to distance above the vertical datum.
Supplemental Information Concentrations of chemical constituents in water are given in either milligrams per liter (mg/L).
v
Abbreviations AIC
Akaike Information Criterion
ANOVA
analysis of variance
ARIS®
adaptive resolution imaging sonar
CL
confidence limit
CSV
comma-separated values
FSC
floating surface collector
IQR
interquartile range
NOAA
National Oceanic and Atmospheric Administration
NTU
Nephelometric turbidity unit
PGE
Portland General Electric
Project
Clackamas River Hydroelectric Project
SD
standard deviation
SE
standard error
USGS
U.S. Geological Survey
ZIP
zero-inflated Poisson
vi
Fish Behavior and Abundance Monitoring Near a Floating Surface Collector in North Fork Reservoir, Clackamas River, Oregon, Using Multi-Beam Acoustic Imaging Sonar By Collin D. Smith, John M. Plumb, and Noah S. Adams
Abstract An imaging sonar was used to assess the behavior and abundance of fish sized the same as salmonid smolt and bull trout (Salvelinus confluentus) at the entrance to the juvenile fish floating surface collector (FSC) at North Fork Reservoir, Oregon. The purpose of the FSC is to collect downriver migrating juvenile salmonids (Chinook salmon [Oncorhynchus tshawytscha], Coho salmon [Oncorhynchus kisutch], and steelhead [Oncorhynchus mykiss]) at the North Fork Dam and to safely route them around the hydroelectric projects. The objective of the imaging sonar component of this study was to assess the behaviors of both smolt and predator-size fish (smolt [60–250 millimeter] and predator 350–650 [millimeter]) observed near the FSC and to determine if the presence of predator-size fish influenced the abundance of smolt-size fish. An imaging sonar was deployed near the entrance to the FSC during the spring smolt out-migration period. The imaging sonar technology was an informative tool for assessing abundance and spatial and temporal behaviors of both smolt and predatorsize fish near the entrance of the FSC. Both smolt and predator-size fish were regularly observed near the entrance, with greater abundances observed during day than during night. Behavioral differences were also observed between the two fish-size classes, with smolt-size fish traveling straighter with more directed movement, and predator-size fish generally showing more milling behavior. Additionally, the presence of predator-size fish may be effecting the abundance and direction of travel of smolt-size fish, as counts of smolt-size fish were reduced in conjunction with the presence of predator-size fish and a greater proportion of smolt-size fish were observed traveling away from the FSC when predator-size fish were present than when predator-size fish were absent. Results of modeling potential predator-prey interactions and influences indicated that both the number of juvenile fish tracks and photoperiod had the strongest effects on the number of predator fish tracks, with more predator-size fish tracks observed as the number of smolt-size fish tracks increased. Overall, the results indicate that predator-size fish are present near the entrance of the FSC, concomitant with smolt-size fish, and their abundances and behaviors indicate that they may be drawn to the entrance of the FSC because of the abundance of preysized fish found there.
1
Introduction Portland General Electric (PGE) operates the Clackamas River Hydroelectric Project (Project) in northwestern Oregon, which includes a series of powerhouses, dams, reservoirs, and support facilities (fig. 1). The primary purpose of the Project is hydroelectric power generation, but it also is operated to provide flood-risk management, along with water for instream flows for wildlife and opportunities for recreation. In 2008, the National Oceanic and Atmospheric Administration (NOAA) determined that the Project was a limiting factor for upstream and downstream fish passage of anadromous fish stocks in the Clackamas River Basin and mandated a series of Project improvements (National Oceanic and Atmospheric Administration, 2008).
Figure 1. Graphic showing Clackamas River Basin showing North Fork Reservoir and Dam, Oregon. Graphic from Portland General Electric. North Fork Dam is a 63-m-high, thin-shell concrete arch dam on the Clackamas River about 48 km southeast of Portland. The dam, completed in 1958, is owned and operated by PGE. It has a hydraulic capacity of 6,000 cubic feet per second (ft3/s) and two Francis turbine units capable of generating a total of 60 megawatts. During normal operations, all water passing through the dam goes through the powerhouse located in the center of the dam (fig. 2), with the exception of a continuous 43 ft3/s flow that maintains a 3.1-km-long fishway along the northern side of the dam and along the Clackamas River. A spillway with three Tainter gates is on the northern side of the dam but is not used during normal dam operations. The 331-acre North Fork Reservoir created by the dam has a storage capacity of 18,630 acre-ft, and a useable storage capacity of 700 acre-ft. The forebay elevation typically fluctuates ±2 ft during normal weather and project operations.
2
Figure 2. Orthoimage showing floating surface collector at North Fork Dam, Oregon, 2017. The juvenile bypass facility at North Fork Dam was marginally effective at passing salmonid smolts migrating downriver (Federal Energy Regulatory Commission, 2006). The 2008 finding by NOAA spurred the construction of a floating surface collector (FSC) with the goal of improving downstream passage of salmonid smolts at North Fork Dam by collecting fish near the dam and moving them downstream. Surface collection has been shown to be a viable method of attracting salmonid smolts (Sweeney and others, 2007), and floating surface collectors have been used at several high-head dams in the Pacific Northwest, including Upper Baker Lake (National Oceanic and Atmospheric Administration, 2018). As a result of successes at Upper Baker Lake and elsewhere, a FSC was installed in North Fork Reservoir during spring 2015 and evaluated for hydraulic performance throughout much of that year (Christensen and Grant, 2015). The FSC is about 20 × 45 m in size and uses pumps to draw water from the reservoir with a maximum inflow of 1,000 ft3/s and a minimum capture velocity of 6.3 feet per second (ft/s). Fish are guided toward the collector flume (5 m wide × 5.9 m deep) with the use of guidance nets, enter the flume, move past dewatering screens, and then pass directly into a bypass pipe that delivers them into the tailrace of River Mill Dam about 8.2 km downriver. The entrance of the FSC is placed near the center of the reservoir and near the turbine intakes, as fish tended to congregate along the dam, and the dam could be used to congregate and guide fish toward the flume of the FSC. Additional information on FSC operations and performance may be found in Ackerman and Pyper (2017); Ackerman and others (2017); and Wyatt (2017).
3
As part of the evaluation to determine how well the FSC performs at collecting and passing salmonid smolts, there is a need to assess the potential effect that the presence of predatory fish may have on the efficacy of the structure. Reintroductions of bull trout (Salvelinus confluentus) recently have been implemented in the Clackamas River subbasin (U.S. Fish and Wildlife Service and Oregon Department of Fish and Wildlife, 2011; Barry and others, 2014), where they previously had been believed to be extirpated (Shively and others, 2007). As part of this reintroduction project, a total of 2,835 bull trout have been released into the Clackamas River basin between 2011 and 2016 (Barrows and others, 2017). Bull trout are known to inhabit the reservoir where the FSC is located, and they are known predators of juvenile salmonids. In addition to bull trout, rainbow trout (Oncorhynchus mykiss) are the only other known predators of salmonid smolts present in the reservoir, and also could potentially be observed with the imaging sonar. We used an imaging sonar to determine if predator-size fish are present near the collector and to determine if they are interacting with smolt-size fish as they approach the entrance, thereby preventing them from entering and subsequently reducing the number of juvenile salmonids passing into the FSC and ultimately reducing overall collection efficiencies. The study summarized in this report was designed to provide empirical information about the presence, movement, and behaviors of both smolt and predator-size fish near the entrance to the FSC, as well as the potential predator-prey interactions at the FSC, to help inform decisions about collection and passage solutions. Measures of the biological performance were quantified using imaging sonar based on the abundance and behaviors of fish near the FSC. The study was designed to provide information for the following objectives: • To quantify the spatial and temporal distribution and overlap of smolt and predator-size fish near the entrance of the FSC; • To assess how the hourly count of juvenile fish tracks, photoperiod, water clarity, and river flow may influence the number of predators in front of the FSC.
Methods Dam Operations and Environmental Conditions Project discharge, spillway discharge, reservoir elevation, and water temperature data were summarized to document the environmental conditions that fish experienced from April 19 to June 1, 2017. Hourly powerhouse discharge and reservoir elevation data were provided by PGE. Turbidity and water temperature data were collected at the U.S. Geological Survey (USGS) streamgage on the Clackamas River at Estacada, Oregon, and obtained at U.S. Geological Survey (2018). Data were summarized using hourly observations, but mean daily values were plotted to increase clarity in the plots. Water elevation data are presented in feet and discharge is presented in cubic feet per second (ft3/s) according to the local convention.
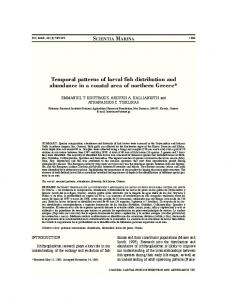
Imaging Sonars Surveillance System We used an adaptive resolution imaging sonar (ARIS®) to collect data on fish movements. The ARIS imaging sonar was operated at 1.8 MHz, with a blanking distance of about 3 m from the camera and a maximum range of about 14 m. The camera was attached to a pole-mounted platform on the western side of the collectors entrance and aimed perpendicular (west to east) to the entrance of the collector (fig. 3). The sonar was lowered to a depth of 1.2 m below water surface and deployed on a rotator to provide precise aiming. ®
4
Figure 3. Photograph of North Fork Reservoir floating surface collector and approximate coverage area of the ARIS® imaging sonar (red cone) in forebay of North Fork Reservoir, Oregon, 2017. Photograph by Landsat, August 11, 2016.
Data Collection The imaging sonar collected data continuously at the entrance of the FSC between April 19 and June 1, 2017, to coincide with the presence of smolts. Data collection was interrupted only when the sonar was repositioned to maximize fish approach viewing or when equipment malfunctioned. All data collected were stored to hard drives for archival and subsequent processing.
Data Processing Signal processing of the raw acoustic signals collected with the ARIS® imaging sonar was analyzed using Echoview® software (version 5.4, Myriax Pty., Ltd., Hobart, Tasmania, Australia). The software is a visualization and analysis program for hydroacoustic data. The Echoview® platform allows the operator to use successive filters to manipulate data to enhance the acoustic signal and remove static objects and noise from acoustic returns (Kang, 2011). Non-stationary acoustic returns are identified as 5
targets within individual camera frames and converted to three-dimensional position and time data that can then be applied to target tracking, which is used to obtain counts and movements of individual fish, along with their associated behavioral and morphometric data (Simmonds and MacLennan, 2005). Unfiltered video footage was observed congruently with tracking of the processed acoustic signals during target tracking to ensure that only fish targets were included in the dataset and target morphometric data was concomitant with target data observed in the video footage. The operational steps used for processing acoustic signals may be found in Adams and Smith (2017).
Data Analysis Summary statistics of fish targets derived from Echoview® (for example, mean length, direction, speed, tortuosity, angle, orientation) were imported into SAS (SAS System for Windows, version 9.3, SAS Institute, Inc., Cary, North Carolina), for subsequent proofing and to merge imaging sonar data with the environmental data. Data were proofed to eliminate non-valid records or records that did not provide measurable morphometric or behavioral data. To consider a fish track as valid, we required that each fish track consisted of at least five pings and had a minimum duration of detection of 0.5 seconds. Target datasets were then exported as comma-separated values files for statistical analysis. It is important to remember the limitations associated with data collected with imaging sonar. For instance, there is no way to identify the species of fish, especially if they are of similar size, and the imaging sonar technology cannot distinguish fish that have entered and exited the field of view multiple times; therefore, the detection duration for each individual fish track within a camera beam was determined by the time a fish was first detected by the camera to the time that the fish exited the camera view.
Fish Size and Count Fish targets were grouped into three size classes to distinguish between smolt-size fish (60–250 mm), predator-size fish (350–650 mm), and upriver-migrating adult salmonids (>650 mm), which included steelhead and coho salmon that entered the reservoir through the fishway. The fish-size thresholds are based on measurements of juvenile salmonid outmigrants collected by the FSC, bull trout collected at the FSC or observed in the fishway, and upriver-migrating adult salmonids observed in the fishway (Garth Wyatt, Portland General Electric, oral commun., 2017). Although they were retained, data for fish 250–350 mm and greater than 650 mm were not included in this analysis.
Direction of Fish Travel To summarize the directions of fish traveling near the FSC, we implemented circular statistics to calculate modes and measures of variability (Mardia and Jupp, 2000) using the circular package for R software (R Core Team, 2014). Tests for randomness were performed to determine if the sample population presented either uniform (random) or directed travel paths. If the data were shown to conform to a Von Mises distribution (Zar, 1999; Pewsey and others, 2013), the Rayleigh z test was performed. Data that were multi-modal or did not follow a Von Mises distribution were subjected to the Rao’s spacing test (Batschelet, 1981). If the P-value was significant (at the α=0.05 level), then it was assumed that the direction of fish travel was non-random. Additionally, we used a Chi-square test to determine if the presence of predator-size fish significantly influenced (at the α=0.05 level) the abundance and general direction of travel (toward or away from the FSC) of smolt-size fish.
6
Track Characteristics Fish-track characteristics were quantified using travel speed and tortuosity variables exported from Echoview®. Travel speed was calculated as the average travel velocity of each individual target. A tortuosity index (τ) was calculated as adapted from Johnson and Moursund (2000):
Sum of Length of a Track Straight Line Track Distance
τ=
(1)
Applying this calculation of tortuosity, a fish traveling in a straight line will have a tortuosity index of 1.0, whereas a fish traveling in a non-linear path will have a tortuosity index of greater than 1.0. For each of the fish track characteristics, an analysis of variance (ANOVA) was used to determine the significance of the differences for fish sizes. Statistical analyses were carried out using R software (R Core Team, 2014). A significance level of α=0.05 was used for all tests.
Evaluating the Fish Track Density near the Floating Surface Collector Entrance The collected point samples for each individual fish track were used to create two-dimensional density plots of unique fish track locations for the volume sampled. The spatial resolution within the view of the camera was about 1 cm, and interpolation of point data was performed using the “akima” package for R software (R Core Team, 2014). The magnitude of the point count is defined as the count of unique observations of each individual fish location within each cell. Datasets for each fish size were used for plotting point location data.
Modeling Predators and Smolts in Front of the Floating Surface Collector To quantify factors affecting the presence of predator-size fish in front of the FSC, we tabulated the number of tracks by predator and smolt-size fish for each hour of sonar footage. We fit a zeroinflated Poisson (ZIP) model to the count data using the “pscl” package and R software (R Core Team, 2014). We chose this modeling approach because of the high frequency of zeros in the dataset, which might be expected given that the sonar sampled a relatively small area upstream of the dam (Zuur and others, 2009). For example, of the 792 hours of camera footage, 78 hours (10 percent of the data) had no predator-size fish counted within the acoustic beam. Given a Poisson distribution, the sample size, and the observed mean number of predator-size fish tracks, we estimated that less than 1 percent of the hourly data should have had zero values. Thus, the high frequency of zeros prompted us to use a zeroinflated Poisson model to assess the factors affecting the absence, and conversely the occurrence and count of predator-size fish tracks upstream of the FSC.
7
The ZIP model consists of two sub models a Poisson model for the count of predators (that is, number of observations in an hour) and a zero-inflation model for the probability of observing an extra zero (that is, predator-size fish are absent) in front of the FSC over and above that expected under the Poisson distribution. Our Poisson count model for the number of tracks for predator-size fish per hour (B) may be expressed as
log(Bˆt ) = β 0 + ∑ β n X n ,t
,
(1)
where
β0 is the intercept, βn are the n coefficients for the Xn set of covariates, and assumes that the number of hourly tracks by the predators upriver of the FSC ( Bˆ t ) are Poisson distributed, whereby the mean is equal to the variance. Our full model included covariates: (1) the square root of the hourly number of smolt-size fish tracked in the sonars’ beam, (2) the photoperiod (day versus night), (3) water turbidity in Nephelometric turbidity units (NTUs), and (4) the total river discharge. We defined day time (1) between 0600 and 1759 and nighttime (0) between 1800 and 0559. Preliminary analyses indicated that a square root transformation was required to linearly transform the relation between the hourly count of predator and smolt-size fish tracks. The hourly number of smolt-size fish tracks ranged from 0 to 1,076, with a mean of 44.9 (sd=77.2). We standardized water turbidity and total river flow in the model to aid in estimation and parameter interpretation. Preliminary model diagnostics revealed low variance inflation factors (