Stringham et al. BMC Bioinformatics 2013, 14:298 http://www.biomedcentral.com/1471-2105/14/298
RESEARCH ARTICLE
Open Access
Flanking sequence context-dependent transcription factor binding in early Drosophila development Jessica L Stringham1†, Adam S Brown2†, Robert A Drewell2,3,4 and Jacqueline M Dresch5,6*
Abstract Background: Gene expression in the Drosophila embryo is controlled by functional interactions between a large network of protein transcription factors (TFs) and specific sequences in DNA cis-regulatory modules (CRMs). The binding site sequences for any TF can be experimentally determined and represented in a position weight matrix (PWM). PWMs can then be used to predict the location of TF binding sites in other regions of the genome, although there are limitations to this approach as currently implemented. Results: In this proof-of-principle study, we analyze 127 CRMs and focus on four TFs that control transcription of target genes along the anterio-posterior axis of the embryo early in development. For all four of these TFs, there is some degree of conserved flanking sequence that extends beyond the predicted binding regions. A potential role for these conserved flanking sequences may be to enhance the specificity of TF binding, as the abundance of these sequences is greatly diminished when we examine only predicted high-affinity binding sites. Conclusions: Expanding PWMs to include sequence context-dependence will increase the information content in PWMs and facilitate a more efficient functional identification and dissection of CRMs. Keywords: Transcription factor, Binding site, Position weight matrix, Enhancer, Cis-regulatory module, Drosophila
Background The control of gene expression during development in Drosophila and other metazoans is tightly directed by cisacting regulatory sequences in the genome. These DNA sequences modulate expression of target genes by binding protein transcription factors (TFs) [1]. Contact between a TF and DNA sequence is mediated through the TF’s DNA binding domain(s) in a sequence dependent manner [2-4]. Each TF has one or more of a variety of different DNA binding domains, including zinc fingers and homeoboxes [5-9]. Significant efforts have been undertaken to comprehend the organization of DNA sequence at known binding regions and further understand how this influences the ability of a TF to bind.
* Correspondence:
[email protected] † Equal contributors 5 Mathematics Department, Harvey Mudd College, 301 Platt Boulevard, Claremont, CA 91711, USA 6 Department of Mathematics, Amherst College, Amherst, MA 01002, USA Full list of author information is available at the end of the article
Our understanding of TF-DNA interactions has been greatly aided by bioinformatic tools developed to analyze DNA sequences obtained from experimental studies focused on identifying TF binding regions. A key approach involves the construction of a position weight matrix (PWM) [10-15]. In PWM-based models, known binding regions for a given TF are first characterized by utilizing experimental data from DNA footprinting assays, yeast one-hybrid assays, chromatin immunoprecipitation-sequencing (ChIP-seq) or protein binding microarrays (PBMs) [2,16,17]. The binding regions are then aligned and trimmed to some minimal sequence length, L, and the frequency at which each nucleotide is observed at each position is recorded in a matrix of dimension 4 × L [18] (Figure 1). Once a PWM is constructed, these models aid in the discovery of de novo binding sites in silico, providing predictions for the location of additional binding regions in the genome, without the need for technically challenging in vitro binding assays [10,14].
© 2013 Stringham et al.; licensee BioMed Central Ltd. This is an open access article distributed under the terms of the Creative Commons Attribution License (http://creativecommons.org/licenses/by/2.0), which permits unrestricted use, distribution, and reproduction in any medium, provided the original work is properly cited.
Stringham et al. BMC Bioinformatics 2013, 14:298 http://www.biomedcentral.com/1471-2105/14/298
Page 2 of 13
HB
CAD
12 6 4 16
3 3 3 29
4 0 0 34
12 0 2 24
38 0 0 0
0 0 0 38
4 0 7 27
22 0 15 1
1 1 2 97
0 0 0 101
1 2 1 97
2 0 0 99
25 1 3 72
16 9 3 73
17 11 71 2
57 2 3 20
61 5 5 11
45 17 10 10
1 25 54 2
8 16 49 9
10 18 52 2
10 3 9 60
KR
KNI
2 0 77 0
57 6 6 10
28 2 4 45
6 68 2 3
15 7 34 23
16 26 18 19
33 11 12 23
38 8 14 19
5 6 11 60
35 7 8 32
Figure 1 Transcription factor binding sequences and position weight matrices. TF consensus binding site sequences for CAUDAL (CAD), HUNCHBACK (HB), KNIRPS (KNI) and KRUPPEL (KR) are shown above the PWM generated from experimentally-verified TF binding regions [30,31]. The height of each of the nucleotide bases reflects the relative likelihood of their presence at that position in the TF binding region.
A host of computational tools have been developed that seek to streamline the discovery of de novo TF binding regions using PWMs [10,14,19,20]. However, a major limitation of PWMs is their potential to lose information content during construction. The lengths of PWMs are often determined based on an optimal alignment between minimal sequences of varying length, potentially eliminating bordering regions crucial to determining a TF’s binding preference [21-23]. Extending PWMs may therefore serve to increase their information content, and thus their predictive power [24]. One limitation resulting from the experimental approaches to isolate TF-bound DNA fragments [25,26], is that there may be additional, but non-contiguous, bases that are fundamentally important to TF binding initiation (or transient TF-DNA binding) which are not represented in the experimental data and therefore not taken into account during traditional PWM construction. A potential explanation for this lack of information content in canonical PWM construction is the omission of secondary binding by TFs with multiple DNA binding domains [2]. For example, in Drosophila the HUNCHBACK TF has two distinct C2H2-type zinc-finger binding domains [9]. If multiple DNA binding domains contact sequences separately then each domain may contribute to the overall binding of the TF. Accordingly, in the case where there are two binding domains, one of the DNA binding regions may be either: a) discarded because it fails to meet minimal fragment size requirements or b) incorporated into a combined alignment along with the sequences representing regions bound by the other binding domain. Either of these scenarios may lower the information content of the PWM. The first
scenario may result in a PWM that does not include all nucleotides necessary for in vivo binding (i.e. a PWM representing the actual binding region may be longer than that which is constructed from the current experimental data). The second, on the other hand, points to an even larger problem in PWM construction: the possibility that a TF may have two different modes of binding, and thus a single unique PWM is insufficient to predict all DNA binding regions, which there has been strong evidence to support in the case of mammalian DNA binding proteins [2]. To address the limitations of PWMs, we align and analyze predicted binding regions for four well-studied TFs in 127 cis-regulatory modules (CRMs) that are essential to direct gene expression along the anterio-posterior axis in early Drosophila development. Our analysis indicates that the current PWMs for all four TFs examined exclude significant biases towards a given base, or bases, in specific positions in the neighboring sequences and that the information content of these PWMs can be improved by including these additional sequences.
Methods Cis-regulatory module and flanking sequences
We identify 114 genes of interest that display a pattern of differential expression along the anterio-posterior axis during Drosophila development at or before stage 5 (all genes and expression data from FlyBase) [27]. In order to compile a database of CRMs, we utilize the REDfly database [28] to search each of the 114 genes and identify all those with in situ-verified CRMs (47 genes, consisting of 127 CRMs). Since we are investigating the flanking region
Stringham et al. BMC Bioinformatics 2013, 14:298 http://www.biomedcentral.com/1471-2105/14/298
Page 3 of 13
(possibly up to 100 bp) of each PWM-predicted TF binding region, and TF binding sites may be predicted within the first or last 100 bps of a given CRM, for each CRM we obtained the entire sequence of the CRM and 100 bp of flanking sequence in each direction. The DNA sequences of both the original CRMs and these extended CRMs are available in the Additional file 1: Dataset S1 and Additional file 2: Dataset S2). To analyze sequence conservation in each CRM we run EvoPrinterHD strict [29] with default settings, specifying four Drosophilid species for comparison: D. pseudoobscura, D. ananassae, D. erecta, and D. sechellia (results shown in Figure 2). Bioinformatic analysis
The PWMs we use for CAUDAL (CAD) [30], HUNCHBACK (HB), KNIRPS (KNI) and KRUPPEL (KR) [31] are as previously described. For our analysis, we run PATSER [14] with default settings (i.e.: the total number of pseudocounts is set to 1 and the background sequence A/T content is 0.3 and C/G content is 0.2). To determine score (ln (p-value)) cutoffs, we first observe the distribution of scores PATSER assigns, using each of the four individual PWMs, to all the known binding regions used to construct each of the original respective PWMs. The cutoffs used are calculated by taking the 75th and 50th percentile cutoff of all these scores, and are referred to as ‘strong’ and ‘weak’ cutoffs respectively. We then run PATSER on each of the original 127 CRMs (excluding flanking regions) with each of the four PWMs to predict binding regions. Only those regions scoring above the respective cutoff are used for further analysis and are referred to as core PWM predicted binding regions (PWM-PBRs). Note that scores are all negative, so ‘scoring above’ refers to PATSER outputting a
ln(p-value) less than or equal to the cutoff. The strong cutoff is more stringent, only predicting binding regions that receive a score less than or equal to that obtained from the top 25% of known binding region scores (108 CAD, 157 HB, 79 KNI, and 18 KR sites), representing binding regions that are most similar to the consensus core binding region for the given TF. The weak cutoff is less stringent, predicting binding regions that receive a score less than or equal to that obtained from the top 50% of known binding region scores (430 CAD, 450 HB, 359 KNI, and 127 KR sites), representing binding regions that are contained in a larger range of similarity to the consensus core binding region for the given TF. One should note that these cutoff scores are TF-specific and are different for each of the four TFs analyzed. In cases where overlapping binding regions were identified, both regions are included in all subsequent analyses. Lists of all the known binding regions for each TF, their corresponding ln(pvalue) obtained using PATSER, and whether they fall into the 75th percentile, 50th percentile, or neither are available in the Additional file 3: Table S1. Statistical analysis
For each TF we aggregate the core PWM-PBRs predicted by PATSER along with a fixed number, n, of bps of flanking sequence on each side, obtained from the 127 extended CRMs with the core PWM-PBR in the center and n bps on each side. When binding sites are found on the reverse complement strand, we use the reverse complement sequence for analysis. Since each core PWM-PBR is exactly the same length (L) as the PWM associated with the given TF, each sequence of DNA in the list is the same length. This allows us to compute the frequency of each
A
B
Caudal ln(p) < -7.04
Hunchback ln(p) < -7.53
Kruppel ln(p) < -8.36
Knirps ln(p) < -7.10
EvoPrinterHD conservation
Figure 2 Conserved sequence beyond known TF binding regions. PATSER predicted binding regions for CAD, HB, KNI and KR are shown above EvoPrinterHD conservation predictions (see Methods for details) for sub-sections of the A) Even-Skipped Stripe 5 CRM (bases 276 to 494) and B) Paired Stripe 2P CRM (bases 800 to 1000). The height of each rectangle indicating a predicted binding region is proportional to its strength.
Stringham et al. BMC Bioinformatics 2013, 14:298 http://www.biomedcentral.com/1471-2105/14/298
Page 4 of 13
HB
KNI
90
90
80
80
70
70
60
60
50
50
40
40
30
30
20
20
10
10
0 −25
−20
−15
−10
−5
ABCDEFG
5
10
15
20
25
0 −25
−20
−15
−10
−5
ABCDEFGH
5
10
15
20
25
−20
−15
−10
−5
ABCDEFGH
5
10
15
20
25
90
700
80 600
70 500
60 400
50
40
300
30 200
20 100
10
0 −25
−20
−15
−10
−5
Figure 3 (See legend on next page.)
ABCDEFG
5
10
15
20
25
0 −25
Stringham et al. BMC Bioinformatics 2013, 14:298 http://www.biomedcentral.com/1471-2105/14/298
Page 5 of 13
(See figure on previous page.) Figure 3 Sequence conservation surrounding HB and KNI DNA binding sites. Graphs on the left and right sides correspond to results from HB and KNI respectively. In each case, the top pair of graphs were generated from sites filtered by the weak ln(P) cutoff score and the bottom graphs by the strong ln(P) cutoff score (see Methods for details). The x-axis of each graph is the position relative to the consensus binding site, with nucleotides in the core binding site marked with letters and the neighboring 25 bp on each side marked numerically by their position relative to the boundaries of the core binding region. In each upper graph, the y-axis indicates the Chi-squared value from a test in which the null hypothesis is an expected ratio at each nucleotide position of T (0.3), A (0.3), C (0.2), and G (0.2). Chi-squared values shown have been capped at 90 for clarity. Colored bars indicate statistical significance and are based on the lower-bounds of the α-value (Chi-squared values) for 0.05 (7.815, gray), 0.01 (11.345, yellow) and 0.001 (16.266, red). For example, the HB binding region statistically significantly varies from the genome-wide nucleotide distribution one and two bps downstream of the core binding site in the weak cutoff graph, but not in the strong cutoff graph. Each lower graph depicts the frequency of A (green), C (dark blue), G (light blue), and T (purple) at each position.
base (A/C/G/T) at each position (from –n to L + n). These frequencies are shown for n = 25 (50 total bases beyond the L bases in the original PWM) in the case of both strong and weak cutoff scores in Figures 3 and 4 (bottom bars on each graph) and are listed in the Additional file 4: Table S2. For each TF and cutoff score, given the list of PBRs (including flanking regions on both sides of the core PWMPBRs), we run a Chi-squared test on each position with the null hypothesis that at any given location, the distribution of A/C/G/T is exactly the same as the genome-wide distribution [32], A(0.3):C(0.2):G(0.2):T(0.3). We note here that the overall nucleotide frequency in the 127 extended CRMs, A(0.2845):C(0.2155):G(0.2155):T(0.2845) is not significantly different from the genome-wide distribution (χ2 test, p-value > 0.95). We analyze the results of these tests at three different confidence levels α = 0.05, α = 0.01 and α = 0.001. We choose more than one confidence level to control the familywise error rate for multiple comparisons. A simple Bonferroni correction leads to a corrected alpha value obtained by dividing alpha by the number of Chisquared tests (ie: in the n = 25 case, α = 0.05/50 = 0.001 is the Bonferroni corrected value corresponding to α = 0.05). Thus, although the three alpha values stated can be interpreted without a Bonferroni correction, α = 0.001 can also be interpreted as a Bonferonni corrected alpha corresponding to α = 0.05. The Chi-squared values obtained are shown for n = 25 in Figures 3 and 4 (top bars on each graph) and actual values for each nucleotide are in the Additional file 4: Table S2. Note that in Figures 3 and 4, the color-coding corresponds to the smallest alpha value of those analyzed in which the null hypothesis is rejected.
nucleotide bias (-9 to -1 relative to the core PWM-PBR) for use in a JASPAR alignment search [33]. The top 5 Drosophila melanogaster TFs that give similarity scores to this PWM (similarity scores > 86%) are manually annotated for expression pattern in early (stages 1-5) embryos [34]. Testing predictions for expanded HB PWMs
Software availability
When expanding the HB PWM, we use a 2-step process. First, we choose an initial cutoff score and predict and align all binding sites using the original core PWM as described in ‘Bioinformatic Analysis’. The PWM-PBRs identified with the original core PWM using this initial cutoff score are then extended by including flanking regions of interest (ranging from -25 to +25). An extended PWM is constructed from the base frequencies of these extended PWM-PBRs. Next, PATSER is used with the extended PWM to determine the score for each of the extended PWM-PBRs constructed from the set of predicted HB binding sites with the initial cutoff score. Computing the percentiles of these scores, in the same way as is described for the original PWM analysis in ‘Bioinformatic Analysis’, we obtain a secondary cutoff score. Lists of the extended PWM-PBRs, their corresponding ln(p-value) obtained using PATSER with the corresponding extended HB PWM, and whether they fall into the 0th, 25th, 50th or 75th percentile are available in the Additional file 5: Table S3. We run Patser again with the extended PWM and secondary cutoff score on the IAB7b CRM, which contains one known functional HB binding site [35]. This allows us to then compare the location of the predicted binding sites obtained using extended HB PWMs of varying lengths to the known HB binding site to determine which PWMs result in the lowest number of false positive and false negative predictions.
The web application that is used to run this analysis is freely available for non-commercial use at: drewell.sites. hmc.edu/projects/sequence_context_grapher.html.
Analyzing expanded PWMs using ChIP-seq datasets
JASPAR database search
Using the alignment produced by the bioinformatic analysis for the ‘weak’ (50th percentile) cutoff described above, a single PWM was constructed from a portion of the flanking sequence of HB showing statistically significant
To analyze the predictive power of the extended PWMs, we first choose initial cutoff scores representing the 25th and 50th percentile scores and generate PWM-PBRs for each of the four TFs as described in ‘Bioinformatic Analysis’. We then extend those core PWM-PBRs (core) to include the core and all highly significant (χ2 test, α
0 PBRs 0 0 3024 3068 5 2 3038 3068 25 25 3061 3068 0 0 2851 3142 19 7 2976 3142 25 25 2972 3142 0 0 289 307 18 16 300 307 25 25 296 307 0 0 6816 7579 11 0 7079 7579 25 25 7210 7579
KR
True Positive Rate 0.9857 0.9902 0.9977 0.9074 0.9472 0.9459 0.9414 0.9772 0.9642 0.8993 0.9340 0.9513
CAD
TF
PWM Type
CAD CAD CAD HB HB HB KNI KNI KNI KR KR KR
Core Extended Full Length Core Extended Full Length Core Extended Full Length Core Extended Full Length
HB
KNI
Left Extension Right Extension ChIP Peaks Total ChIP Peaks with > 0 PBRs 0 0 3025 3068 5 2 2995 3068 25 25 3031 3068 0 0 2311 3142 19 7 2580 3142 25 25 2558 3142 0 0 249 307 18 16 270 307 25 25 286 307 0 0 4486 7579 11 0 5760 7579 25 25 6647 7579
Full
Extended
Core
Full
Extended
Core
Full
Extended
Core
Full
Extended
0.5
Core
Full
Extended
Core
Full
Extended
Core
Full
Extended
Core
Full
Extended
Core
0.84
0.55
KR
True Positive Rate 0.9860 0.9762 0.9879 0.7355 0.8211 0.8141 0.8111 0.8795 0.9316 0.5919 0.7600 0.8770
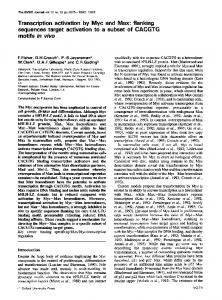
Figure 7 Position Weight Matrix extension enables high fidelity identification of Predicted Binding Regions in ChIP-seq peaks. Three different PWMs were constructed for CAD (red), HB (blue), KNI (green), and KR (purple) respectively, corresponding to; the core PWM-PBR (core), a region encompassing the core PBR and all statistically significant flanking sequence context-dependent biases (extended), and the core with 25 bp of flanking sequence on each side (full). For each individual PWM, PATSER was run on filtered ChIP-seq peaks using a low stringency (A, corresponding to the 25th percentile) or high stringency (B, corresponding to the 50th percentile) primary cutoff and then a secondary cutoff score corresponding to the 0th percentile (see Methods for full details). Charts depict the true positive rate (defined as the number of ChIP-seq peaks for which the PWM predicts > 0 binding regions divided by the total number of ChIP-seq peaks). Statistical significance of divergence in true positive rate of expanded PWMs from the corresponding core type PWM is indicated with asterisks (Two-tailed Fisher exact test, * denotes P-value < 0.05, ** denotes P-value < 0.0001).
Stringham et al. BMC Bioinformatics 2013, 14:298 http://www.biomedcentral.com/1471-2105/14/298
Page 10 of 13
sequences for each TF. The three different PWMs correspond to: the core PWM-PBR (core), a region encompassing the core PBR and all statistically significant flanking sequence context-dependent biases (extended), and the core with 25 bp of flanking sequence on each side (full). Comparison of the ability of each of the three PWMs to correctly identify at least one binding site in individual ChIP-seq peaks for each TF reveals that in each case, with the exception of the CAD PWM at low stringency (see Methods for details), the extended PWMs significantly outperform the core PWMs (Figure 7). There are many potential reasons for the fact that all four TFs exhibit context-dependent biases within their extended binding regions, including specific interactions dependent on the physical constraints of the TF contacting DNA, nucleosomes or co-factors. To address the possibility that cofactors may in fact be recruited to these neighboring sequences we investigate a cluster of context-dependent sequence exhibiting strong statistical significance (the -9 to 1 bp region relative to the HB core PBR, Figure 8a) for
additional TF binding sites. Alignment of the PWM corresponding to the -9 to -1 DNA region to all PWMs available in the JASPAR database identifies putative binding sites for other Drosophila TFs (see Methods for details). Of the top five binding sites, ranked according to their binding motif’s similarity to the PWM constructed from the -9 to -1 HB region, only two (su(H) and sd) correspond to TFs expressed in the early embryo (Figure 8b). None of the top five ranked TFs are known to have any functional interaction with HB, suggesting that secondary sequence context-dependence is not sufficiently explained by co-factor binding alone. A further testable explanation for the fact that all four TFs exhibit context-dependent biases at their extended binding regions may be that these TFs have multiple DNA binding domains, each of which contacts different nucleotides independently [2], but together act to increase the TF’s binding affinity for target sequences. If this is the case, these secondary DNA binding domains may enhance, but not replace the function of the primary, canonical binding domain in the TF protein. To assess this
A
B Hit #
Sym
Gene
Expression
% Similarity
1
Su(H)
Suppressor of Hairless
Brain, Hindgut, Ventral Ectoderm
89.27
2
sd
Scalloped
Faint ubiquitous
88.57
3
br_Z1
Broad Spliceisoform1
None
88.42
4
br_Z3
Broad Spliceisoform3
None
87.76
5
br_Z4
Broad Spliceisoform4
None
87.76
WebLogo
Figure 8 Predicted transcription factor binding sites in sequence adjacent to the core HB binding region. A. HB has a region of context conservation extending from the core PBR downstream from the -1 to -9 base positions. Using the weak ln(P) cutoff score alignment, a PWM was generated of this region and subjected to a JASPAR alignment search (see Methods for details). B. The top 5 hits are shown with WebLogo representations of their PWMs. Of the 5, only su(H) and sd are expressed in the early embryo, with organ specific and weak ubiquitous expression respectively.
Stringham et al. BMC Bioinformatics 2013, 14:298 http://www.biomedcentral.com/1471-2105/14/298
Page 11 of 13
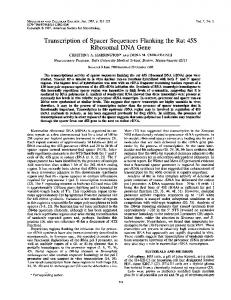
[2], we investigate the binding domains of each of the four Drosophila TFs. HB has two groups of C2H2-type zinc fingers, separated by over 350 amino acids, while KR has only one group of fingers (Figure 9). This may explain the stark difference between the significance profiles at flanking sequences neighboring defined PWM-PBRs for HB and KR (Figures 3 and 4). In addition, it may reveal a relationship between the predicted binding strength and number of context-dependent biases for each TF. One model is that the group of four zinc-fingers in the center of HB form the core DNA-binding domain (capable of binding to the PWM-PBR), while the other group of two auxiliary zincfingers form a secondary binding domain (capable of binding neighboring sequences) with less contribution to the overall binding stability (Figure 9). There is some experimental evidence to support this model, as the highly conserved multi-zinc finger TF CTCF has been shown to contact DNA nucleotides at least 12 bp (and possibly up to 40 bp) apart at the human c-myc promoter [41]. In comparison, the single group of zinc-fingers in KR form a single DNA binding domain which can only bind the core PWM-PBR and directly adjacent sequences (Figure 9). CAD also has only one binding domain (a homeobox), potentially explaining CAD's lower level of secondary sequence context-dependence, when compared to HB or KNI. Of the four TFs, KNI is the most puzzling, exhibiting secondary sequence context-dependency while having only a single annotated binding domain (Figure 9). One potential explanation may be that, unlike in the case of KR where the two zinc fingers are only six amino acids apart, the two C4-type zinc fingers in KNI are separated by 17 amino acids. This increased separation may in fact allow
hypothesis, we compare the binding regions predicted by PATSER using both strong and weak cutoff scores (see Methods). While many of the nucleotide position biases persist at either cutoff score, we find a general decrease in the number and significance of context-dependent biases for all four TFs when we only consider strong sites (Figures 3 and 4 and Additional file 4: Table S2). For example, context-dependent biases within 15 bp of the KNI PWM-PBR are greatly reduced when we only consider strong sites - of the 12 enriched biases found with the weak cutoff, only one remains (Figure 3). The range of decrease across the four TFs is variable (Figures 3 and 4). Overall, these results suggest two separate binding regimes: (1) if a TF has secondary, non-contiguous binding, stronger core binding regions may overcome a paucity of context-dependent biases in the flanking sequences, whereas weaker core binding regions may depend more heavily on these biases; (2) if a TF exhibits contiguous biases, these biases may simply suggest a larger canonical core binding region. However, in some cases, there are nucleotides that are found to be significant only when the strong cutoff score is used. For example, two new biases are detected at +20 and -23 relative to the KNI PWM-PBR (Figure 3). This finding supports a hypothesis that strong and weak core binding regions may in fact have two different functional roles that allow the TF to bind in a different mode, again posing the question of whether it is valid or not to represent a TF binding with one unique PWM [2]. To address the possibility that the presence of secondary sequence context-dependence in the case of a particular TF is due to the TF having multiple binding domains, as previously shown for a large number of mammalian TFs
273
332
Homeobox
CAD 1
427
733-757
269-291 325-344
C2H2-type Zinc Fingers
HB
1
758 240-262 297-319
2
705-727
78
nuclear receptor
KNI 1
429 NR C4-type Zinc Fingers 5-25
42-66 250-272
306-328
C2H2-type Zinc Fingers
KR
1
502 222-244
278-300
334-354
Figure 9 DNA-binding domains in CAD, HB, KNI and KR transcription factors. CAD has a single homeobox domain (green), HB and KR have multiple C2H2-type zinc-finger domains (orange), and KNI has two nuclear receptor C4-type zinc fingers (purple).
Stringham et al. BMC Bioinformatics 2013, 14:298 http://www.biomedcentral.com/1471-2105/14/298
the two zinc fingers to act as functionally distinct DNA binding domains, as is the case for HB.
Conclusions Taken together these data suggest that current PWMs may not be optimal to explain the complexity of TF binding. Although we only test four TFs in this study, we demonstrate that all four TFs exhibit context-dependent biases towards given nucleotides both contiguously with the defined minimal binding region and non-contiguously in flanking DNA sequences, thus providing a foundation for this to be explored more broadly. An additional intriguing question for future study will be to investigate if the contextdependent bias persists at predicted TF binding regions in other genomic regions that are not characterized as CRMs. By taking these secondary context-dependencies into account, we propose that the information content of PWMs can be expanded in many cases. This expansion would not only provide better predictions of true TF binding regions in the genome, but may also help improve estimates of relative binding affinities at specific sites, allowing one to understand the molecular basis for the difference between weak and strong binding sites. The ability to identify novel CRMs and decipher the sequence organization at CRMs relies heavily on a concrete understanding of TF binding preferences. Improving the information content of PWMs and our comprehension of TF binding events will contribute to these continued efforts. Availability of supporting data
The data sets supporting the results of this article are included within the article (and its Additional file 3: Table S1, Additional file 4: Table S2 and Additional file 5: Table S3, Additional file 1: Datasets S1 and Additional file 2: Datasets S2, and Supporting legends.)
Additional files Additional file 1: Dataset S1. DNA sequences of the original CRM (Dataset S1). The original CRM folder (Dataset S1) contains the 127 FASTA files for the CRMs we used. Additional file 2: Dataset S2. DNA sequences of the extended CRMs (Dataset S2). The extended CRM folder (Dataset S2) contains those same 127 CRMs, extended by including the neighboring 100 bp both up- and downstream of the CRM. The extended CRM FASTA filenames are identical to the original, but with a ‘ + ’ appended to the filename (i.e., the original Kr_4.fasta file in File S1 has a corresponding Kr_4 + .fasta file in File S2). Additional file 3: Table S1. PATSER scores for predicted binding regions. Each sheet contains a list of the sequences in predicted binding regions for a particular TF. Sequences are ordered by their ln(p‐value), as computed by PATSER (see Methods for details). The scores highlighted in yellow indicate those scoring at or above (with ln(p‐value) less than or equal to) those included in the 75th percentile (strong cutoff sites). The scores highlighted in green indicate those scoring at or above (with ln(p‐ value) less than or equal to) those included in the 50th percentile (weak cutoff). Recall that the 75th and 50th percentile cutoff scores are specific for each TF and thus vary from sheet to sheet.
Page 12 of 13
Additional file 4: Table S2. Nucleotide frequencies in flanking sequences neighboring predicted binding regions. Each sheet corresponds to a particular TF and cutoff percentile (labeled as weak or strong, see Methods). The column labeled ‘position’ assigns alphabetic values to the consensus core PWM-predicted binding regions (PWM‐PBRs) and numeric values to the neighboring flanking sequences, ranging from ‐25 to ‐1 upstream and from 1 to 25 downstream. The next four columns, labeled ‘A’, ‘C’, ‘G’, and ‘T’, contain the frequency observed for each nucleotide at the specified position when all PWM-PBRs are considered for that particular TF and cutoff percentile. The column labeled ‘chi‐squared’ contains the corresponding chi-squared value for each position. Additional file 5: Table S3. PATSER scores for extended PWM-PBRs. Each sheet contains a list of the sequences in the extended PWM-PBRs for a particular initial cutoff score and length of flanking region. Sequences are ordered by their ln(p-value), as computed by PATSER using the corresponding extended HB PWM (see Methods for details). The scores highlighted in yellow indicate those scoring at or above (with ln(p-value) less than or equal to) those included in the 75th percentile (strongest cutoff sites). The scores highlighted in green indicate those scoring at or above (with ln(p-value) less than or equal to) those included in the 50th percentile (strong cutoff sites). The scores highlighted in orange indicate those scoring at or above (with ln(p-value) less than or equal to) those included in the 25th percentile (weak cutoff sites). The scores highlighted in blue indicate those scoring at or above (with ln(p-value) less than or equal to) those included in the 0th percentile (weakest cutoff sites). This includes all sites detected with the initial cutoff score. Recall that the 0th, 25th, 50th and 75th percentile cutoff scores are specific for each initial cutoff score and length of flanking region and thus vary from sheet to sheet. Additional file 6: Table S4. True and false positive results for extended PWM-PBRs on ChIP-seq peaks. Each sheet corresponds to a particular TF. The name of the TF, the total number of ChIP-seq peaks, and the number of scrambled peaks used for the analysis are listed in the first column. In the other columns, each row corresponds to a PATSER run for the given TF, ChIP-seq peaks and scrambled peaks. The primary and secondary cutoff percentiles used, as well as the number of nucleotides extended to the left (upstream) and right (downstream) of the core PWM-PBR are listed. The results of each run are shown as the number of ChIP peaks containing at least one predicted binding site, which is used to calculate the true positive rate, and the number of scrambled ChIP peaks containing at least one predicted binding site, which is used to calculate the false positive rate. The last column contains the ratio of true positive to false positive. To highlight settings in which the sensitivity increased in at least one of the extended PWM-PBRs compared to the core, we have highlighted those true positive rates in green, to highlight settings in which the specificity increased in at least one of the extended PWM-PBRs compared to the core, we have highlighted those false positive rates in pink, and to highlight settings in which the ratio of true to false positives increased in at least one of the extended PWM-PBRs compared to the core, we have highlighted those ratios in yellow. Competing interests The authors declare that they have no competing interests. Authors’ contributions JLS created the web application, ran all bioinformatic and statistical analyses, and tested expanded HB PWMs. ASB compiled the 127 CRMs, ran the EvoPrinterHD analysis, performed the JASPAR database search, and analyzed each TF’s binding domain(s). The manuscript was written by JLS, ASB, RAD and JMD, and the overall project was conceived and guided by RAD and JMD. All authors read and approved the final manuscript. Acknowledgments The research in this paper was supported by funding to R.A.D. from the National Institutes of Health (GM090167), the National Science Foundation (IOS-0845103) and Howard Hughes Medical Institute Undergraduate Science Education Program grants (520051213 and 52006301) to the Biology department at Harvey Mudd College. J.M.D. was funded as a Teaching and Research Postdoctoral Fellow, supported in part by NSF Grant DMS-0839966, and through research funds provided by Amherst College.
Stringham et al. BMC Bioinformatics 2013, 14:298 http://www.biomedcentral.com/1471-2105/14/298
Author details 1 Computer Science Department, Harvey Mudd College, 301 Platt Boulevard, Claremont, CA 91711, USA. 2Biology Department, Harvey Mudd College, 301 Platt Boulevard, Claremont, CA 91711, USA. 3Department of Biological Sciences, Mount Holyoke College, South Hadley, MA 01705, USA. 4 Department of Biology, Amherst College, Amherst, MA 01002, USA. 5 Mathematics Department, Harvey Mudd College, 301 Platt Boulevard, Claremont, CA 91711, USA. 6Department of Mathematics, Amherst College, Amherst, MA 01002, USA. Received: 29 May 2013 Accepted: 24 September 2013 Published: 4 October 2013 References 1. Ptashne M: Gene regulation by proteins acting nearby and at a distance. Nature 1986, 6081:697–701. 2. Badis G, Berger MF, Philippakis AA, Talukder S, Gehrke AR, Jaeger SA, Chan ET, Metzler G, Vedenko A, Chen X, et al: Diversity and complexity in DNA recognition by transcription factors. Science 2009, 324:1720–1723. 3. Mitchell PJ, Tjian R: Transcriptional regulation in mammalian cells by sequence-specific DNA binding proteins. Science 1989, 245:371–378. 4. Ptashne M, Gann A: Transcriptional activation by recruitment. Nature 1997, 6625:569–577. 5. Jolma A, Yan J, Whitington T, Toivonen J, Nitta KR, Rastas P, Morgunova E, Enge M, Taipale M, Wei G, et al: DNA-binding specificities of human transcription factors. Cell 2013, 152:327–339. 6. Kadonaga JT: Regulation of RNA polymerase II transcription by sequencespecific DNA binding factors. Cell 2004, 116:247–257. 7. Mlodzik M, Fjose A, Gehring WJ: Isolation of caudal, a Drosophila homeo box-containing gene with maternal expression, whose transcripts form a concentration gradient at the pre-blastoderm stage. EMBO J 1985, 4:2961–2969. 8. Rothe M, Nauber U, Jäckle H: Three hormone receptor-like Drosophila genes encode an identical DNA-binding finger. EMBO J 1989, 8:3087–3094. 9. Sommer RJ, Retzlaff M, Goerlich K, Sander K, Tautz D: Evolutionary conservation pattern of zinc-finger domains of drosophila segmentation genes. Proc Natl Acad Sci USA 1992, 89:10782–10786. 10. Bailey TL, Bodén M, Buske FA, Frith M, Grant CE, Clementi L, Ren J, Li WW, Noble WS: MEME SUITE: tools for motif discovery and searching. Nucleic Acids Res 2009, 37:W202–W208. 11. Berg OG, von Hippel PH: Selection of DNA binding sites by regulatory proteins: statistical-mechanical theory and application to operators and promoters. J Mol Biol 1987, 193:723–743. 12. Djordjevic M, Sengupta AM, Shraiman BI: A biophysical approach to transcription factor binding site discovery. Genome Res 2003, 13:2381–2390. 13. Hertz GZ, Hartzell GW 3rd, Stormo GD: Identification of consensus patterns in unaligned DNA sequences known to be functionally related. Comput Appl Biosci 1990, 6:81–92. 14. Hertz GZ, Stormo GD: Identifying DNA and protein patterns with statistically significant alignments of multiple sequences. Bioinformatics 1999, 15:563–577. 15. Morozov AV, Havranek JJ, Baker D, Siggia ED: Protein-DNA binding specificity predictions with structural models. Nucleic Acids Res 2005, 33:5781–5798. 16. Whitington T, Frith MC, Johnson J, Bailey TL: Inferring transcription factor complexes from ChIP-seq data. Nucleic Acids Res 2011, 39:e98. 17. Zhu LJ, Christensen RG, Kazemian M, Hull CJ, Enuameh MS, Basciotta MD, Brasefield JA, Zhu C, Asriyan Y, Lapointe DS, et al: FlyFactorSurvey: a database of Drosophila transcription factor binding specificities determined using the bacterial one-hybrid system. Nucleic Acids Res 2011, 39:D111–D117. 18. Gershenzon NI, Stormo GD, Ioshikhes IP: Computational technique for improvement of the position-weight matrices for the DNA/protein binding sites. Nucleic Acids Res 2005, 33:2290–2301. 19. Matys V, Kel-Margoulis OV, Fricke E, Liebich I, Land S, Barre-Dirrie A, Reuter I, Chekmenev D, Krull M, Hornischer K, et al: TRANSFAC and its module TRANSCompel: transcriptional gene regulation in eukaryotes. Nucleic Acids Res 2006, 34:D108–D110. 20. Sandelin A, Alkema W, Engstrom P, Wasserman W, Lenhard B: JASPAR: an open-access database for eukaryotic transcription factor binding profiles. Nucleic Acids Res 2004, 32:D91–D94.
Page 13 of 13
21. Aerts S: Computational strategies for the genome-wide identification of cis-regulatory elements and transcriptional targets. Curr Top Dev Biol 2012, 98:121–145. 22. Van Loo P, Marynen P: Computational methods for the detection of cisregulatory modules. Breifings Bioinformatics 2009, 10:509–524. 23. Van Nimwegen E: Finding regulatory elements and regulatory motifs: a general probabilistic framework. BMC Bioinforma 2007, 8(6):S4. 24. Stormo GD: Maximally efficient modeling of DNA sequence motifs at all levels of complexity. Genetics 2011, 187:1219–1224. 25. Boyle AP, Song L, Lee BK, London D, Keefe D, Birney E, Iyer VR, Crawford GE, Furey TS: High-resolution genome-wide in vivo footprinting of diverse transcription factors in human cells. Genome Res 2011, 21:456–464. 26. Landt SG, Marinov GK, Kundaje A, Kheradpour P, Pauli F, Batzoglou S, Bernstein BE, Bickel P, Brown JB, Cayting P, et al: ChIP-seq guidelines and practices of the ENCODE and modENCODE consortia. Genome Res 2012, 22:1813–1831. 27. McQuilton P, St Pierre SE, Thurmond J, Consortium F: FlyBase 101--the basics of navigating FlyBase. Nucleic Acids Res 2012, 40:D706–D714. 28. Gallo SM, Gerrard DT, Miner D, Simich M, Des Soye B, Bergman CM, Halfon MS: REDfly v3.0: Toward a comprehensive database of transcriptional regulatory elements in drosophila. Nucleic Acids Res 2011, 21:456–464. 29. Odenwald WF, Rasband W, Kuzin A, Brody T: EVOPRINTER, a multigenomic comparative tool for rapid identification of functionally important DNA. Proc Natl Acad Sci USA 2005, 102:14700–14705. 30. Noyes MB, Christensen RG, Wakabayashi A, Stormo GD, Brodsky MH, Wolfe SA: Analysis of homeodomain specificities allows the family-wide prediction of preferred recognition sites. Cell 2008, 133:1277–1289. 31. Ho MC, Johnsen H, Goetz SE, Schiller BJ, Bae E, Tran DA, Shur ASA JM, Rau C, Bender W, Fisher WW, et al: Functional evolution of cis-regulatory modules at a homeotic gene in Drosophila. PLoS Genet 2009, 5:e1000709. 32. Herold J, Kurtz S, Giegerich R: Efficient computation of absent words in genomic sequences. BMC Bioinforma 2008, 9. doi:10.1186/1471-2105-1189-1167. 33. Portales-Casamar E, Thongjuea S, Kwon AT, Arenillas D, Zhao X, Valen E, Yusuf D, Lenhard B, Wasserman WW, Sandelin A: JASPAR 2010: the greatly expanded open-access database of transcription factor binding profiles. Nucleic Acids Res 2010, 38:D105–D110. 34. Tomancak P, Beaton A, Weiszmann R, Kwan E, Shu S, Lewis SE, Richards S, Ashburner M, Hartenstein V, Celniker SE, et al: Systematic determination of patterns of gene expression during Drosophila embryogenesis. Genome Biol 2002, 3:RESEARCH0088. 35. Starr MO, Ho MC, Gunther EJM, Tu Y-K, Shur AS, Goetz SE, Borok MJ, Kang V, Drewell RA: Molecular dissection of cis-regulatory modules at the Drosophila bithorax complex reveals critical transcription factor signature motifs. Dev Biol 2011, 359:290–302. 36. MacArthur S, Li XY, Li J, Brown JB, Chu HC, Zeng L, Grondona BP, Hechmer A, Simirenko L, Keränen SV, et al: Developmental roles of 21 Drosophila transcription factors are determined by quantitative differences in binding to an overlapping set of thousands of genomic regions. Genome Biol 2009, 10:R80. 37. Siggers T, Duyzend MH, Reddy J, Khan S, Bulyk ML: Non-DNA-binding cofactors enhance DNA-binding specificity of a transcriptional regulatory complex. Mol Syst Biol 2011, 7:555. 38. Borok MJ, Tran DA, Ho MC, Drewell RA: Dissecting the regulatory switches of development: lessons from enhancer evolution in Drosophila. Development 2010, 137:5–13. 39. Mihaly J, Barges S, Sipos L, Maeda R, Cleard F, Hogga I, Bender W, Gyurkovics H, Karch F: Dissecting the regulatory landscape of the Abd-B gene of the bithorax complex. Development 2006, 133(15):2983–2993. 40. Zhou J, Ashe H, Burks C, Levine M: Characterization of the transvection mediating region of the abdominal-B locus in Drosophila. Development 1999, 126(14):3057–3065. 41. Filippova GN, Fagerlie S, Klenova EM, Myers C, Dehner Y, Goodwin G, Neiman PE, Collins SJ, Lobanenkov VV: An exceptionally conserved transcriptional repressor, CTCF, employs different combinations of zinc fingers to bind diverged promoter sequences of avian and mammalian c-myc oncogenes. Mol Cell Biol 1996, 16(6):2802–2813. doi:10.1186/1471-2105-14-298 Cite this article as: Stringham et al.: Flanking sequence contextdependent transcription factor binding in early Drosophila development. BMC Bioinformatics 2013 14:298.