Email: {qzhu,mgoncalv,rshen,fox}@vt.edu. Abstract. The current .... information science. .... included seventeen volunteers from a graduate level Information Storage and ... Technology Interactive Digital Educational Library, www.citidel.org).
1
Visual Semantic Modeling of Digital Libraries Qinwei Zhu, Marcos André Gonçalves, Rao Shen, Edward A. Fox Department of Computer Science Virginia Tech Blacksburg, VA 24061, USA Email: {qzhu,mgoncalv,rshen,fox}@vt.edu Abstract. The current interest from non-experts who wish to build digital libraries (DLs) is
strong worldwide. However, since DLs are complex systems, it usually takes considerable time and effort to create and tailor a DL to satisfy specific needs and requirements of target communities/societies. What is needed is a simplified modeling process and rapid generation of DLs. To enable this, DLs can be modeled with descriptive domain-specific languages. A visual tool would be helpful to non-experts so they may model a DL without knowing the theoretical foundations and the syntactic details of the descriptive language. In this paper, we present a domain-specific visual DL modeling tool, 5SGraph. It employs a metamodel that describes DLs using the 5S theory. The output from 5SGraph is a DL model that is an instance of the metamodel, expressed in the 5S description language. Furthermore, 5SGraph maintains semantic constraints specified by the 5S metamodel and enforces these constraints over the instance model to ensure semantic consistency and correctness. 5SGraph enables component reuse to reduce the time and effort of designers. 5SGraph also is designed to accommodate and integrate several other complementary tools reflecting the interdisciplinary nature of DLs. Thus, tools based on concept maps to fulfill those roles are introduced. The 5SGraph tool has been tested with real users and several modeling tasks in a usability experiment, and its usefulness and learnability have been demonstrated.
1. INTRODUCTION The interest from non-experts who wish to build digital libraries (DLs) is strong worldwide. However, since DLs are complex systems, it is difficult to create and tailor them to satisfy specific needs and requirements of target communities (for generality, referred to herein as “societies”). What is needed is a simplified modeling process involving descriptive domain-specific languages [1], and rapid generation of DLs. In such languages, models are made up of elements representing concepts, rules, and terminology that are part of the domain world, as opposed to the world of code or of generic modeling languages (e.g., UML [2]). A visual tool should be helpful to non-experts so they may model a DL without knowing the theoretical foundations and the syntactic details of the descriptive languages. Thus, we present a domain-specific visual modeling tool, 5SGraph, aimed at modeling DLs. 5SGraph is based on a metamodel that describes DLs using the 5S theory [3]. The output from 5SGraph is a DL model that is an instance of the metamodel, expressed in the 5S description language (5SL) [4]. 5SGraph presents the metamodel in a structured toolbox, and provides a top-down visual building environment for designers. The visual proximity of the metamodel and instance model facilitates requirements gathering and simplifies the modeling process. Furthermore, 5SGraph maintains semantic constraints specified by the 5S metamodel and enforces these constraints over the instance model to ensure semantic consistency and
1
correctness. 5SGraph enables component reuse, to reduce the time and efforts of designers. 5SGraph also is designed to be flexible and extensible, able to accommodate and integrate several other complementary tools (e.g., to model societal relationships, scenarios, or complex digital objects), reflecting the interdisciplinary nature of DLs. 5SGraph has been tested with real users and several modeling tasks in a usability experiment [5] and its usefulness and learnability have been demonstrated. This paper is organized as follows. Section 2 provides background on theory, language, and approach. Section 3 describes 5SGraph: its design, functionality, key features, and visualization properties. Section 4 presents design, measures, and results of a usability experiment to evaluate the tool. Section 5 covers semantic modeling of DL constructs with concept maps. Section 6 concludes the paper.
2. Background Recognizing the difficulties in understanding, defining, describing, and modeling complex DLs, and building upon work launched in 1999 [7], Gonçalves, Fox, et al. have proposed and formalized the 5S (Streams, Structures, Spaces, Scenarios, and Societies) theory of DLs [3]. The many definitions in [3] unambiguously specify key characteristics and behaviors of DLs. This enables automatic mapping from 5S models to actual implementations as well as the study of qualitative properties of these models (e.g., completeness, consistency, etc.) [6]. In order to model a DL, a designer has to describe: 1) the kinds of multimedia information the DL supports; 2) how that information is structured and organized; 3) different logical and presentational properties and operations of DL components; 4) the behavior of the DL; and 5) the different societies of actors and managers of services that act to carry out the DL behavior. To accommodate these, Gonçalves and Fox proposed 5SL, for declarative specification and generation of DLs based on 5S [4]. It is a high-level, domain-specific language, which: 1) raises the level of abstraction in DL specification and modeling by offering abstractions for the domain at hand; and 2) shows how DL design issues may be combined in a coherent framework that enriches, extends, and customizes classical models for databases, information retrieval, and hypertext. 5SL is an XML realization of the 5S model, addressing interoperability and reuse in its design. Table 1 summarizes, for each of the ‘S’ models: the formal definition and the objective of the model. Table 1. 5S/5SL overview. Model Streams
Formal definition Sequences of arbitrary types
Structures
Labeled directed graphs
Spaces
Sets of objects and operations on those objects that obey specific constraints Sequences of events that modify states of a computation in order to accomplish some functional requirement Sets of communities and relationships (relations) among them
Scenarios Societies
Objective within 5SL Describe properties of the DL content such as encoding and language for textual material or particular forms of multimedia data Specify organizational aspects of the DL (e.g., structural /descriptive metadata, hypertexts, taxonomies, classification schemes) Define logical and presentational views of several components. Detail the behavior of the DL services Define managers, responsible for running DL services; actors, that use those services; and relationships among them
2
3
Table 2 shows the set of concepts/primitives and sub-languages and notations used in the implementation of each ‘S’ model within 5SL. Table 2. 5SL primitives and implementation. Model Streams Model Structures Model
Primitives
Text; video; audio; picture; software program Collection; catalog; hypertext; document; metadata; organization tools
Spaces Model
User interface; index; retrieval model
Scenarios Model
Service; event; condition; action
Societies Model
Community; service managers; actors; relationships; attributes; operations
5SL implementation
MIME types XML and RDF schemas; Topic maps ML (XTM) MathML, UIML, XSL Extended UML sequence diagrams; XML serialization XML serialization
3. The 5SGraph Modeling Tool 3.1 Functionality With 5SL, a DL designer does not need to be an expert in software engineering or information science. The designer only needs to have a clear conceptual picture of the needed DL and be able to transform the conceptual picture to 5SL files. This greatly reduces the burden on designers, speeds up the building process, and increases the quality of the DLs built. However, 5SL has its own problems and limitations: 1. The designer must understand 5SL well enough to be able to write a 5SL file and to correctly use it to express his/her ideal digital library. 2. The 5SL file, which describes a DL, consists of five sub-models (Stream model, Structural model, Spatial model, Scenarios model, and Societal model). Although all of the five sub-models are expressed in XML, they use different sets of concepts and have different semantics. Thus, the 5SL specification is compatible and extensible, because many existing standard formats can be used within the 5SL language. Yet, to build one DL, the designer needs to understand the five or more different semantic specifications that are required to express the system. 3. When large and complex digital libraries are to be built, it is very hard even for experts to manually write those XML files without any assistance from a tool. 4. It is very difficult to obtain the big picture of a DL just from a huge set of XML files. This may cause trouble for maintenance, upgrade, or even understanding of an existing system. 5. A number of semantic constraints exist between (inter-model constraints) and within (intra-model constraints) the sub-models. Designers need extra effort to ensure consistency in the whole model. Reflecting on the above mentioned disadvantages of 5SL, we consider the following four functions of a modeling tool based on the 5S/5SL framework to be essential: To help DL designers to 1) understand the 5S model quickly and easily; 2) build their own DLs without difficulty.; 3) transform their models into complete,
3
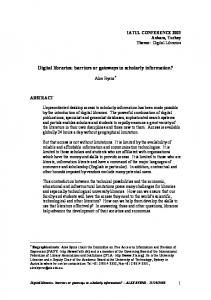
correct, and consistent 5SL files automatically; 4) understand, maintain, and upgrade existing DL models conveniently. Accordingly, our 5SGraph modeling tool supports these functions as it provides an easy-to-use graphical interface. It automatically generates desired 5SL files for the designer. Since visualization often helps people understand complex models, 5SGraph is able to load and graphically display DL metamodels. The visual model shows the structure and different concepts of a DL and the relationship among these concepts. 5SGraph also provides a structured toolbox to let the designer build a DL by manipulation and composition of visual components (see Figure 1). The structured toolbox provides all the visual components of the metamodel, and shows the structural relationships among these components. The visualization thus provides guidance while the designer is building the model. The designer only needs to deal with a graphical interface and pull visual components together. It is not required to memorize the details of the syntax and semantics of 5SL. Cognitive load is reduced. Typing effort and typing errors are reduced. Furthermore, correctness and consistency can be automatically guaranteed by 5SGraph; thus it yields correct and consistent 5SL XML files according to the visual model built by the designer. As such, 5SGraph eliminates the disadvantages of working with raw 5SL.
Figure 1. 5SGraph sample interface with structured toolbox (bottom part) and workspace (upper part); figure shows modeling of collections for the CITIDEL project (www.citidel.org).
The concept of metamodel is very important to assure flexibility. The metamodel describes a generic DL. The model for a specific DL is an instance of the metamodel, which in our case is a domain-specific metamodel, i.e., specific to the domain of building DLs. Since the 5S framework is still under development, it is expected that more changes and additions will be made in the future, especially to 5SL. Fortunately, when given a new metamodel, the tool can be used with future versions of the 5S model as well.
3.2 Key Features. Some of the major features of the tool include:
4
5
•
Flexible and extensible architecture 5SGraph is a domain-specific modeling tool. Thus, the model is made up of elements that are part of the domain world, not the whole entity world. 5SGraph is tailored to accommodate a certain domain metamodel: for 5S. Methods that are appropriate only to 5S can be used to optimize the modeling process. Reuse in such a specific domain is realistic and efficient, because the models in that domain have many characteristics in common. The 5SL language extensively uses existing standards. The reason is that the specification of a DL involves many sub-domains, and there are various standard specifications for each sub-domain. There also are many well-developed tools for those sub-domains. For example, metadata is an important element in 5S. Several existing metadata editors can be used to view and edit metadata. Another example concerns the scenario part of 5S. A specific scenario can be modeled and described by UML sequence diagrams, so existing UML modeling tools can be used for this purpose [8]. The 5SGraph tool should not “re-invent the wheel”. Therefore, the tool is designed to be a super-tool, which means it provides an infrastructure based on the 5S model and calls existing tools as needed. In the interest of brevity, however, except for our new work that is discussed in Section 5, this paper focuses on how 5SGraph helps with modeling a DL, rather than on how 5SGraph calls other tools to create customized components. •
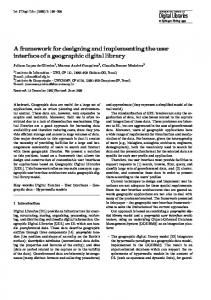
Reuse of components and sub-models In 5SGraph, component reusability means that components designed in one user model can be saved and reused in other user models. Reusability saves time and effort. There are components that are common for different DL systems. For example, many DLs share the same data formats, and the same descriptive metadata standards. The components representing the Stream Model or the metadata in the Structural Model can be built once and reused in different DLs. When a new component is needed, the user does not need to build a component from scratch. He/she loads a similar component and spends relatively less time by making minor changes to customize the loaded component (see Figure 2). Of course, not all components are designed to be reusable. A reusable component should be self-contained and independent. •
Synchronization between the model and the metamodel There are two views in the tool. One is for the toolbox (metamodel); the other is for the user model. These two views are related through the type/instance relationships between components in the toolbox and components in the user model. When a user selects an instance component in the workspace (user model), 5SGraph is able to synchronize the view of the toolbox by showing a visible path from the root to the corresponding type of selected component (see Figure 1). The convenience of synchronization is that: 1) The user does not need to manually search all the components in the toolbox to find the correct type component; and 2) The tool helps the user focus on the most important relationships of the type components. The child components that can be added to the current component are within easy reach.
5
•
Enforcing of semantic constraints Certain inherent semantic constraints exist in the hierarchical structure of the 5S model. These constraints in 5S are divided into two categories. Value constraints specify the range of possible values of an element, while association constraints define the relationships among different components. Examples of such constraints include: 1. The streams used in the definition of a digital object (document) are predefined in the Stream Model. 2. A collection consists of different kinds of documents. A catalog describes a collection, since a catalog collects all the administrative or descriptive metadata that apply to the digital objects in the collection. A catalog, therefore, is dependent on a collection. 3. The services that the actor (a member of the Society Model) uses or a manager (another member of the Society Model) runs can be drawn only from the services already defined in the Scenario Model.
Figure 2. Reuse of models before and after loading.
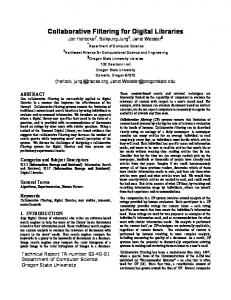
The 5SGraph tool is able to manage these constraints. For example, an actor only can use services that have been defined in the Scenario Model. This is specified in the metamodel, where the SubNodes part of actor contains the Datatype ‘Services’ (not shown in the figure), which means only existing instances of Services can become child nodes of an actor. The declaration of an actor, Teacher, is shown in Figure 3(a). In order to associate actors with the services they use, the designer browses back to the Scenario Model to select services: metadata search, multi-scheme browsing, profile filtering, browsing, cataloguing, focused crawling, lesson plan building, and lesson plan customized browsing (this one with four scenarios: unordered and ordered browsing, guided path, and slide show — as supported by the VIADUCT manager). When the designer browses back to Actor in the Scenario Model in the metamodel, he/she finds that the created set of services are automatically added into the metamodel under the node “Actor” (see Figure 3(b), structured toolbox), allowing him/her to connect the defined services with the actors that use them. In the example, Learner is connected to all but two services (focused crawling, run by the “crawlifier” manager, and lesson plan building, used only by teachers).
6
7
Figure 3. Enforcing semantic constraints in the CITIDEL system. See (top) teacher as actor and (bottom) learner services.
4. Evaluation We conducted a pilot usability test regarding 5SGraph. The questions to be answered were: 1) Is the tool effective in helping users build DL models based on the 5S theory? 2) Does the tool help users efficiently describe DL models in the 5S language? 3) Are users satisfied with the tool? Participants of this preliminary test included seventeen volunteers from a graduate level Information Storage and Retrieval class, or from the DL research group of Virginia Tech. We choose participants who have basic knowledge of DLs and have the motivation to create DLs. These types of people are some of the target users of the tool. Three representative tasks with different levels of difficulty were selected: Task 1: build a simple model of a Technical Report Digital Library using reusable model components. The difficulty level of this task is low. Its purpose is to help the participants to get familiar with 5S and the 5SGraph tool. Task 2: finish an existing partial model of CITIDEL (Computing and Information Technology Interactive Digital Educational Library, www.citidel.org). The difficulty level of this task is medium.
7
Task 3: build a model of NDLTD (Networked Digital Library of Theses and Dissertations, www.ndltd.org) from scratch. The difficulty level of this task is high. The procedures were as follows: 1) the participant was asked to read some background documents about 5S and the modeling methodology; 2) the participant was given an introductory presentation on 5SGraph; 3) the participant was given a description of task 1 and we recorded how he/she completed it; 4) after the participant finished each task, he/she was given the next task description immediately; 5) after the participant finished all the tasks, he/she was given a questionnaire form to fill out.
4.1 Measures We use the following test measures: Effectiveness o Completion rate: percentage of participants who complete each task correctly. o Goal achievement: extent to which each task is achieved completely and correctly. • Efficiency o Task time: time to complete each task. o Closeness to expertise: minimum task time divided by task time. • Satisfaction Satisfaction is measured using a subjective 10-point bipolar rating scale, where 1 is the worst rating and 10 is the best rating. After each participant finishes all three tasks, he/she is given a questionnaire and asked to rate the overall learnability, effectiveness, and satisfaction based on his/her observation. PreUnderstanding refers to the participant’s understanding of 5S before using the tool. Post-Understanding refers to the participant’s understanding of 5S after using the tool. Table 2 summarizes the results for all three tasks. •
4.2 Results Table 2. Overall Performance Results for Three Tasks Completion Rate (%) Mean Task Time (min) Mean Closeness to Expertise Mean Goal Achievement (%)
Task 1 100 11.3 0.483 97.4
Task 2 100 11.4 0.752 97.4
Task 3 100 15.1 0.712 98.2
8
9
30 25 20 15 10 5 0 1
2
3
4
5
6
7
8
9
1
11
1
1
1
15
1
17
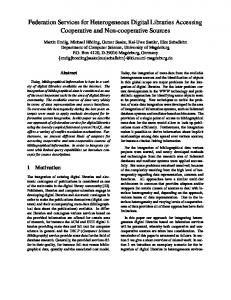
Task1t ime ( min) Task2 t ime (min) Task3 t ime (min)
Figure 4. Task Time
• • •
Effectiveness: The high completion rate and the high goal achievement rate prove the effectiveness of 5SGraph (see Table 2). Efficiency: Most participants finish tasks in less than 20 minutes (see Figure 4); the generated 5SL files are incredibly accurate. Closeness to Expertise reflects the learnability of the tool (see Table 2, Figure 5). There are three observations, which have been confirmed statistically (t test with 0.05). a. Observation 1: the mean Closeness to Expertise in task 2 is significantly greater than that in task 1. b. Observation 2: the mean Closeness to Expertise in task 3 is significantly greater than that in task 1. c. Observation 3: the mean Closeness to Expertise in task 3 is not significantly different from that in task 2. 1 0 .9 0 .8 0 .7 0 .6 0 .5 0 .4 0 .3 0 .2 0 .1 0 1
2
3
4
5
6
7
8
9
10 11 12 13 14 15 16 17
Task1 Task2 Task3
Figure 5. Closeness to Expertise
It appears that the tool is easy to learn and use. A short task such as task 1 is enough for users to become familiar with the tool. User proficiency is quite close to expert performance level after they use the tool the first time. In fact, there are some participants (#9 and #10) with good computer skills who achieved a completion speed
9
very close to the expert’s in tasks 2 and 3. Observation 3 indicates that users have similar performance in tasks 2 and 3. The reason may be that users have become highly familiar with the tool after task 1. The remaining difference between the participants and the expert may be due to other factors, e.g., familiarity with the tasks, typing speed, reading speed, and skill in using computers. The average rating of user satisfaction is 9.1 and the average rating of tool usefulness is 9.2. From these numbers, it appears that our participants are satisfied with the tool and consider it useful for building DLs based on 5S. In addition to providing a satisfaction rating, participants rate their understanding of 5S theory before and after using the tool. Mean values of their rating are shown in Figure 6. Statistical analysis (t test with 0.05) shows that the mean value of post-understanding is greater than that of pre-understanding. The tool appears helpful to increase understanding of 5S. Post
Pre
0.0
2.0
4.0
6.0
8.0
10.0
Understanding of 5S Theory
Figure 6. Pre and Post understanding of 5S.
5. Semantic Modeling of Digital Libraries with Concept Maps 5SGraph can already capture many DL conceptual properties and inter-model constraints, but a number of explicit inter- and intra-model relationships and properties (e.g., relationships among actors and service managers, between managers and their defined operations, the temporal order of events in scenarios) still need to be captured to create a complete 5SL specification useful for generation of a final DL implementation. As argued before, these are to be captured using external “plugin” software tools, which can be called within 5SGraph as needed. 5SGraph thus acts like a “conductor” that organizes and guides the whole DL development process. However if each complementary tool uses its own set of abstractions, graphical notations, and operations we will have a similar problem to one mentioned before regarding the use of different syntaxes and semantics within the 5SL sub-models. What is desired is a set of tools that use common principles, abstractions, notations, and operations. We are developing such complementary software tools based on “Concept Maps” (CMs) [9]. Concept maps are conceptual tools for organizing knowledge and representing concepts and relationships as node-link diagrams. The nodes are labeled with descriptive text, representing concepts, and the links are labeled with relationship types. This approach has a number of advantages including: 1. Simplicity and intuitiveness CMs harness the power of our vision to understand complex information “at-aglance”. They have been used to generate ideas (brain storming, etc.), to design complex structures, to communicate complex ideas (such as concepts of DLs), to aid learning by explicitly integrating new and old knowledge, and to assess understanding or diagnose misunderstanding.
10
11
2.
Natural integration with the 5S framework The underlying model of a CM is a labeled directed graph, which in terms of 5S defines exactly a “Structure”. Besides being natural to model DL structures such as metadata formats and classification schemes, CMs also can capture the relationships of the Societies Model. Moreover, with few extensions (e.g., multilabels in relationships to express dynamic scenario events1, enumeration of labels to simulate temporal sequencing) they can be used to model scenarios. 3. Amenability to formalization The basic notions of concepts and relationships are more amenable to formalization in terms of precise constructs (such as semantic networks, topic maps, and ontologies) than the notions of higher level but more ambiguous and informal design models such as UML class and sequence diagrams [10, 11]. In consonance with the formal nature of 5S, this can be used to formally prove properties of the final 5SL model such as correctness and completeness. Figure 7 shows a CM modeling of a portion of the society sub-model of the CITIDEL system (www.citide.org). That model shows a teacher interacting with a lesson plan building manager to create instructional material for students. The lesson plan builder is composed of three managers for other services: Searching, Browsing, and Binding. All the operations defined in those managers are incorporated by the Builder, which also can define its own operations. Operations have parameters and return types. Different colors are given to different types of concepts (i.e., actors, service managers, operations) based on different level of hierarchical importance. We used the CM editor of the GetSmart system developed by the Artificial Intelligence Lab at the University of Arizona [12] to produce the maps. GetSmart can export a map into a tailored XML format. We have extended GetSmart to extract the hierarchical information embedded in the Societal CMs and produce the corresponding 5SL-Society XML file that then can be incorporated or imported by 5SGraph. We plan to implement similar extensions for the other ‘S’s.
6. Conclusions and Future Work A domain-specific visual modeling tool (5SGraph), built for the purpose of modeling and building DLs based on the 5S model, is presented in this paper. This work on 5SGraph is an important part of a large project that aims at rapid DL design and generation based on a formal theoretical framework. Such generation may be facilitated if designers are able to describe their DLs using domain-specific description languages as the first step, but such advantages can be compromised if the language is too complex. 5SGraph reduces the difficulties of this step for digital librarians. To the best of our knowledge, there has been no other similar modeling tool in this area developed for this purpose. Having recently decoupling the current concept map editor from GetSmart to become a stand-alone tool, we can use it to incorporate the necessary extensions and constraints to complement the design of other ‘S’ models. We will integrate the standalone tool with 5SGraph, improve its interface and interactions mechanisms, use it in educational settings to teach about DLs, and perform more tests, especially with more librarians as participants. 1
In more formal terms, to extend CMs to be multigraphs.
11
Figure 7. Concept map for a component of society sub-model of CITIDEL.
Acknowledgments Thanks are given for the support of NSF through its grants: IIS-9986089, IIS-0002935, IIS0080748, IIS-0086227, DUE-0121679, DUE0121741, and DUE-0136690. The second author is supported by CAPES, 1702-980.
References 1. Kieburtz, R.B. et al.: A Software Engineering Experiment in Software Component Generation, Proc. of 18th Int. Conf. on Software Engineering, pp. 542-553, Berlin, (1996). 2. Booch, G., Rumbauth, J., and Jacobson, I.: The Unified Modeling Language User Guide, Addison-Wesley, Reading, Massachusetts, USA (1999) 3. Gonçalves, M. A., Fox, E. A., Watson, L.T., and Kipp, N.: Stream, Structures, Spaces, Scenarios, Societies (5S): A Formal Model for Digital Libraries, Virginia Tech CS Tech. Rep., TR-03-04, http://eprints.cs.vt.edu/archive/00000646 (re-submitted after revision from an earlier version, for publication in ACM Transactions on Information Systems) 4. Gonçalves, M. A., Fox, E. A.: 5SL – a language for declarative specification and generation of digital libraries. JCDL 2002: 263-272, Portland, Oregon (2002) 5. Zhu, Q.: 5Sgraph: A Visual Modeling Tool for Digital Libraries. Master Thesis. Virginia Tech. http://scholar.lib.vt.edu/theses/available/etd-11272002-210531/ (2002) 6. Gonçalves, M. A. Digital Libraries: formal theory, language, design, generation, quality, and evaluation. PhD Dissertation proposal. CS Dept., Virginia Tech, 2003. 7. Fox, E. A., From Theory to Practice in Digital Libraries: 5S and Educational Applications (NDLTD, CSTC), Keynote at NSF-CONACyT Workshop on Digital Libraries, Albuquerque NM, July 7-9, 1999, http://www.ndltd.org/pubs/conacyt99.doc 8. Tigris.com, ArgoUML: design tool with cognitive support. http://argouml.tigis.org (2002) 9. Novak, J.D.: learning, creating, and using knowledge: concept maps as facilitative tools in schools and corporations, Lawrence Erlbaum and Associates: Mawah, NJ, (1998) 10. Gaines, B.R., Shaw, M.L.G.: Concept maps as hypermedia components, International Journal of Human-Computer Studies, vol. 41, pp. 59-107 (1995) 11. Eden, A. H.: A Theory of Object-Oriented Design, Journal of Information Systems Frontiers, vol. 4. No. 4, pp. 179-191, (2002) 12. Marshall, B., Zhang, Y., Chen, H., Lally, A., Shen, R., and Fox, E.: Convergence of knowledge Management and E-learning: The GetSmart Experience, accepted for publication at JCDL’03, Houston, Texas, May 27-31 (2003)
12