Flexible, Low-overhead Event Logging to Support Resource Scheduling Jan Stoess University of Karlsruhe Germany
Volkmar Uhlig IBM T.J. Watson Research Center New York
[email protected]
[email protected]
Abstract Flexible resource management and scheduling policies require detailed system-state information. Traditional, monolithic operating systems with a centralized kernel derive the required information directly, by inspection of internal data structures or maintaining additional accounting data. In systems with distributed or multi-level resource managers that reside in different subsystems and protection domains, direct inspection is unfeasible. In this paper we present how system event logging — a mechanism usually used in the context of performance analysis and debugging — can also be used for resource scheduling. Event logs provide accumulated, preprocessed, and structured state information independent of the internal structure of individual system components or applications. We describe methods of low-overhead data collection and data analysis and present a prototypical application to multiprocessor scheduling of virtual machines.
data, (ii) analysis of accumulated data, and (iii) a scheduling decision and optionally a resource re-allocation. Many scheduling algorithms base their scheduling decisions on analysis of the past to extrapolate future behavior. In this paper we describe how simple event logging, commonly used for performance analysis and debugging, can be used for data accumulation as a basis for scheduling decisions. Instead of having a scheduler gather the data in an ad-hoc manner, we explicitly decouple the problem of accumulating scheduling information, and propose to use event logging as a generic solution. Logging is a ideal method for scalable and unified data collection; additional configuration mechanisms keep the logging overhead minimal while preserving the expressiveness of an integrated scheduler. In remainder of the paper, we first present related work (Section 2), and then describe the design of our lowoverhead data collection facility (Section 3). We then present our implementation and prototypical application to multiprocessor virtual machine scheduling (Section 4). We finally present a performance evaluation (Section 5) and concluding remarks (Section 6).
1 Introduction
2 Related Work
Flexible resource management requires detailed information on system state. Today’s complex and distributed system structure that includes a hypervisor, multiple operating systems, middle-ware stacks, and applications renders the traditional centralized scheduler unfeasible. The three common approaches for overcoming scheduling limitations are to either incorporate further scheduling policies into the kernel, to restrict scheduling of the operating system and perform scheduling completely at application level, or to ignore the problem altogether. Extensible scheduler components that incorporate information from all involved parties when needed are the most flexible solution. Furthermore, schedulers must give feedback to components to adapt or reallocate resources. Starting from that design point, one can derive three basic functions for a scheduler: (i) accumulation of resource usage
The two most common approaches to support scheduling in operating systems are pure in-kernel systems and pure application-based systems. A structure where the kernel performs all scheduling decisions, like done in traditional UNIX- or Windows-based systems, leads to an entangled kernel with bulky and inefficient abstractions, and global scheduling policies whose extension inevitably affects the whole system [3, 4]. Pure application-level resource scheduling, found in user-level thread libraries [2] or vertically structured kernels [7], counteracts the one-fitsit-all approach of monolithic kernels. However, it solves the problem for individual applications only, and does not address resource management that spans multiple applications or protection boundaries. Two-level approaches attempt to combine two scheduling layers, by providing a kernel- and an application-level scheduler, and mechanisms
such as scheduler activations [3] or shared memory [10] to propagate scheduling-relevant events between them. However, these approaches are processor-specific and focused on two specific layers of scheduling only.
3 Design The increasing number of layers, components, and subsystems in modern operating system structures requires resource scheduling to be modular and extensible; schedulers must be able to perform decisions across component boundaries, and they must be adaptable to different requirements and environments. We thus model them as independent components, for instance residing in separate software modules or protection domains. This, however, raises the question how a scheduler can be provided with resource usage information, which arises in subordinate (from the viewpoint of scheduling) but distributed (from the viewpoint of modularization) components. We therefore decouple the problem of accumulating scheduling data from other scheduler functions and propose to use event logging as a generic solution. An instrumentation mechanism records resource data in the components and stores it within log buffers held in main memory (Figure 1). The buffers are shared with the resource scheduler, which analyzes the records when it performs its allocation decisions. Event-logs are an ideal mechanism for low-overhead, low-footprint data collection, and their canonical, unified form renders them suitable for various scheduling problems, resources, and subsystems. Logging is asynchronous and separates data accumulation from data analysis; it is up to the scheduler to perform the analysis often enough to ensure timeliness and accuracy – a requirement we consider easy to fulfill, since scheduling logs are usually small.
ec ru os eR
re lu de hc S
Code CPU0 CPU1
…
contr ol
CPU0 CPU1 …
log
Component
Figure 1. The logging facility records scheduling characteristics in per-component, perprocessor buffers shared with resource schedulers. In addition to our basic logging system, we introduce several scheduling-specific mechanisms to pre-process log data in-place, at acquisition time. Via dynamic instrumentation, we allow the resource scheduler to reduce the actual accumulation of statistics to the subset essential for the
scheduler’s allocation strategies. Furthermore, as scheduling is directly related to accounting, our system incorporates a scheduler-managed mechanism to associate accounting information with resource usage records. We finally provide a set of filtering mechanisms, which eliminate irrelevant or overly accurate data at runtime, before it pollutes the log files. The logging facility collects all records within designated, per-processor, per-component log buffers held in main memory. For efficiency reasons, we share the log buffers directly with the scheduler, rather than to incorporate copy-out or double-buffering techniques. We use a lock-free synchronization scheme that does not rely on costly inter-processor synchronization operations in the frequently invoked log event handlers.
3.1
Instrumentation and Log Control
Many performance analysis and debugging tools offer the flexibility of instrumenting arbitrary kernel and userlevel code; in some cases they even let the users define the actions that should be taken when an instrumentation point is reached [5, 11]. This is typically achieved by loading user-specified code into the instrumented component – a mechanism that inevitably induces a number of severe safety problems, and requires complex and restrictive countermeasures to overcome them [5, 6]. For resource scheduling as a mandatory part of the system, safety requirements are tight. Moreover, resource scheduling relies on well-defined pieces of information, and less on dynamically specified traces or instrumentation points. Our system refrains from overly extensible mechanisms, and is limited to predefined control and data flow. The definition of events and the data to be logged is done at compile time. Typical scheduling events are, for example, changes of a characteristic such as the length of the run-queue, or accesses to scheduling-related resources such as the processor. The according log entries for scheduling are event identifiers, resource principal identifiers, usage counters, or time stamps.
ecr rel uo ude … se hc RS
CPU0 CPU0
Event 1
…
specify logfile select events
Event 2
leu do M
Figure 2. Flexible but safe log control using predefined events and entries, and distinct log buffers. Since accumulation of all possible scheduling data at the same time is inefficient and unnecessary, we allow the
scheduler to choose only a subset from all possible control and data flows at run-time (Figure 2). Dynamic instrumentation allows for enabling only those log handlers, whose recordings are relevant for the scheduler’s allocation strategy. Similarly, a configuration interface allows for selecting only those of all potential log entries for recording, which are required by the scheduler. More specifically, the interface allows the scheduler to freely choose, on a per-event base, size and entry types to be emitted into the log files.
3.2
Log Data Processing
A major characteristic of scheduling information is its dynamic nature. Fluctuations in workloads come along with variations in and quick staleness of log data. A second characteristic is its tight relation to accounting; records on resource usage that lack information on originating principals are often useless. Our facility addresses these problems by introducing a set of scheduling-specific mechanisms to preprocess the data flow in-place. Pre-processing does not only help reducing the amount of data recorded; it can also speed up the time spent analyzing the data. Accounting Scheduling policies typically associate resource usage to an accountable entity for later evaluation when (re-)allocating resources to the entities. Typical entities are threads for processor-related resources, addressspaces for memory resources, and so on. To account log data to different entities, we introduce a new first-class construct: an accounting domain. For the log handlers, an accounting domain is merely an identifier for the principal accessing a resource that can be emitted to the log file upon request. A management interface enables the scheduler to freely choose different (or common) identifiers for different resource principals in the system. As an example, a scheduler can denote the same identifier for several addressspaces belonging to a single application, which combines the accounting of resource consumptions and charges it to the same accounting domain. This approach can be regarded as a basic adoption of the resource container concept in [4]. Routing Data Flow A simple technique to further process log data is to group log data semantically. We implemented a mechanism to route data from different characteristics and domains to distinct log files (Figure 2). Explicit logging of event and domain in the log files is then dispensable, which saves space in the log files and simplifies the analysis. In detail, our facility maps each pair of event and accounting domain to a distinct log file. Binding events and domains to log files is left to the scheduler, allowing it to establish separate or shared log buffers according to its own requirements.
Our scheme allows for a variety of alternative log file structures. A global log, used by all events and domains, could maintain a global history of characteristics for a given resource. A per-event, per-domain log, in contrast, could hold a history of the domains’ resource demands. Filtering Data Flow by Accounting Domains Accounting domains enable the scheduler to establish associations between resource principals and the accounted entities reported to the log files. Each domain can be considered as a pool of resource principals the scheduler considers to be “equal” in accounting. Our logging facility defines an implicit filter mechanism that ignores all events that reflect state changes internal to an accounting domain. We implement this filter by having the log mechanism check if changes in resource consumption take place within or across accounting domains, and letting it disregard the internal changes. As an example, if two threads reside in the same domain, context-switches between these threads are not regarded as processor release and access. Rather, the same domain continues to access the processor, and the log facility ignores the event altogether. Event Counting Another technique that for data aggregation is to count the times a particular event has occurred, instead of logging each event separately. While there are scheduling characteristics whose access counters are only available in a cumulative form, counting can also be used as a specific mechanism to reduce data flow [1]. Our facility provides a simple realization of event counters – a cyclic additive log file with only one entry. Event-Based Sampling Finally, our logging infrastructure features an event sampling mechanism based on thresholds. The thresholds act as a filter for log events: the number of events equal to the threshold must be reached, before a log entry is made. Like all log controls, the threshold configuration is exported to the scheduler application, allowing it to modify the thresholds according to its own demands. Resource usage can highly differ between different resource principals. We therefore employ one threshold per event and accounting domain, to allow for monitoring resource usage in pace of the principal-specific fluctuations.
3.3
Scalability and Sharing
Performance analysis and debugging facilities often copy out log data, or use double-buffering for sharing logs [1, 5, 14]. We instead share the logs directly with the scheduler, and memory-map all log buffers into the scheduler’s address-space. The nature of scheduling-relevant logs is that entries become stale quickly and can be overwritten.
Thus, the size of scheduling data is generally small compared to performance traces, and direct sharing is a practical and efficient approach that reduces both cache footprint and space requirements. In order to preserve independence between processors, we use per-processor log buffers; we further employ separate sets of buffers for each component. The configuration interface allows the scheduler to define the log files within each buffer; each log file has a configurable size and consists of selectable fixed-size entries, which eases the log analysis compared to global or variable-sized logs. We assume that there are non-concurrent log producers for each of the log files, and provide no synchronization between writes. However, to allow for a flexible scheduler design, we do not require separate analysis processes for each processor or component. We therefore provide a scheme for synchronizing reads with concurrent writes. Since interprocessor locks are costly, we do not force the log producer to acquire a lock while performing its write accesses. Instead, we let reads and writes run unsynchronized but enable the reading analysis process to detect concurrent accesses and resolve potential conflicts. Our facility adapts a scheme described in [13], which relies on valid bits for maintaining consistency. Instead of using valid bits for each log entry row, we use the log file’s current log index to detect a potential read-write race condition. After parsing a log file, the analysis process verifies that the current index has not changed by checking it against a local copy. In case of a mismatch, it restarts the analysis of that file since it may have read inconsistent data. This solution trades higher cost in the uncommon case of concurrent analysis and logging for lower overhead by avoiding valid bit maintenance in the frequently executed log operation.
4 Implementation To evaluate our approach, we have implemented a prototype logging facility within a real-world, virtual machine environment. Our environment (Figure 3) consists of four major parts: the L4 µ-kernel as the small, privileged hypervisor [9]; several device driver modules running at userlevel; the application workload running within virtual machines (VMs) [8, 12]; a scheduler application responsible for processor allocation to VMs and drivers. The software stack runs on a medium-scale (up to 8 way) IA-32 architecture based multiprocessor. Logging Implementation Since our logging facility only relies on instrumenting code points known at compile-time, we can prepare these points for later instrumentation. This simplifies the transferring of control to and from the log handlers (compared to the processing required for arbitrary code instrumentation [11]).
VM
VM
VM
DISK
NET
User
Scheduler
Level
Kernel-
L4 hypervisor /
Level
Hardware
CPU
μ-kernel
…
CPU
CPU
Figure 3. Virtual machine environment We use a method similar to the alternative input() function in the Linux 2.6 kernel. At each of the instrumentation points, we enhance the source code by a small assembler macro (Figure 4) that performs two tasks: First, it inserts sequence of no-op instructions, to leave room for later control transfer to the logging handler. The handlers are included as functions in the component’s source code. Enable Event
Code
Backpointer
patc h
… …
0xf010207
…
n ac s
push %ebp lea , %ebp call *%ebp pop %ebp nop nop … nop
Disable Event
Figure 4. Dynamic logging instrumentation. If the invoked logging code function includes further arguments, the macro inserts additional no-op place holders. Furthermore, the macro instructs the linker to save the start and end address of the no-op sequence in a back-pointer list. This back-pointer list stores the instrumentation addresses on a per-characteristic base. The instant the scheduler enables logging of a characteristic, the facility parses the list of back-pointers to the no-op sequences. At each instance, it patches call, push, and pop instructions to transfer control and arguments to and from the handler. We implemented the log configuration interface as a set of scheduler-accessible control registers. Each log file is represented by a control register, which contains all associated meta-data such as the memory buffer reserved for logging, the location of the next log entry within the buffer, and the entries to be stored in the log file. The control registers are co-located with the actual log buffers, in the shared log area; the complete area is mapped read-writable to the scheduler’s address-space(s). Our log data routing mechanism is implemented via pointer tables, indexed by event and accounting domain identifier. Each pointer denotes a log control register. During accumulation, the log handler dereferences the pointer corresponding to the given event and domain. It then parses the register and performs the log
Prototypical Scheduler Application We have implemented a prototype scheduler responsible for allocation of processors to virtual machines. It implements a basic affinity scheduling policy, which relies on interaction patterns between application VMs and device drivers; drivers are associated with a particular processor. For demonstration we gathered those patterns both from the hypervisor and from the device driver modules. The hypervisor provides the scheduler with inter-VM communication statistics, recorded by instrumenting the IPC path. The driver modules provide interaction patterns based on memory segments shared with client VMs. Upon completion of driver requests, the driver retrieves the number of references to shared driver memory, based on access bits in the page tables. Our prototype scheduler initially programs the logging facilities, using their control interfaces. The hypervisor is programmed to use VM-local log buffers of 512 bytes size, whereas the device drivers use a global 4 KByte log buffer of for all VMs. Whenever a new VMs is started, the scheduler chooses a distinct log-domain number and passes the number to the hypervisor and the device drivers. To calculate the actual affinity values, the scheduler maintains a per-driver data structure that holds the scheduling statistics derived from the logs. Each data structure consists of two counter vectors holding the clients’ IPC interactions and references to shared memory. To calculate the two counters from the logs, the scheduler periodically polls communication and shared memory log buffers, and increments the perdomain correspondent counters appropriately. The counter vectors finally yield a matrix of client-to-driver transactions, reflecting the affinity between applications and device drivers.
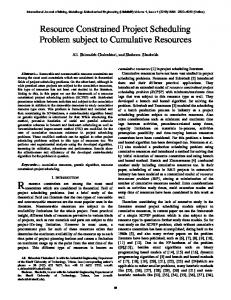
5 Performance We conducted several experiments to evaluate our approach with regard to efficiency and scalability. We considered the basic costs as relevant, as well as the overall effects of logging and and log analysis on application performance. We did not include an analysis on the efficiency of our prototype scheduler, since we considered it to go beyond the scope of this work. To determine the costs and scalability of logging, we measured the performance of instrumenting the IPC path in L4. IPC is the most frequently used kernel operation; our L4 version therefore offers an optional assembler path for common IPC types as an alternative to the standard path written in C. To cover both cases, we have developed an assembler and a C version of our instrumentation code. We conducted our measurements on a IBM eServer xSeries 445 with 8
hyper-threaded 2.2 GHz Intel Xeon CPUs and 4 GBytes cache-coherent shared memory. We compared a native version of L4 against our modified version with logging support. We enabled logging only for IPC, and disabled all other characteristics. To create “logging load”, we used a parallel IPC micro-benchmark that creates distinct pairs of communicating threads running concurrently on different CPUs, which results in simultaneous CPU-local sequences of message transfers1 . The benchmark measures IPC roundtrip time per CPU for different message sizes, and both for cross- and intra-address space IPCs. Since transfer times are short, the benchmark conveys messages repeatedly for each size. To investigate the scalability of our logging facility, we ran the benchmark with one, four, and eight thread pairs (respectively CPUs), and compared the results against each other. Figure 5 lists the results averaged over the respective number of CPUs and message sizes in cycles, for the assembler IPC path and for the standard C path. We compared the following three configurations: “native” The unmodified kernel version without support for logging. “off“ The instrumented version, but with the log handler disabled at runtime. “ipc“ Logging an entry of 8 bytes consisting of the IPC partner and a time stamp.
Time (cycles)
operation based upon the particular configuration.
2000 1500 1000 500
Intra AS ASM
Cross AS C
ASM
C
native off ipc
148 148 148 148 148 148 148 148 148 148 148 148 Number of Processors
Figure 5. Costs of parallel log operations on the IPC path (assembler and C-version), intra- and cross address spaces, for different numbers of CPUs To evaluate the overall effects of logging on applicationperformance, we determined how gathering client-anddriver interaction for use by our scheduler affects the actual device throughput. We used a driver providing access to a hard disk and a client VM that accesses the disk using the driver’s virtual disk interface. In order to eliminate I/O processing we let the device driver export a 256 MByte RAM disk, rather than a real hard disk. The driver interface is based on a shared memory segment comprising four memory pages. To generate disk load, we ran the 1 We
did not measure sending inter-processor messages, since L4’s inter-processor messaging systems is not very different to the local, except that it uses inter-processor interrupts to synchronize processors. Also, to avoid hardware interferences, we did not make use of hyper-threading.
Postmark benchmark in the client VM, on the RAM disk by the driver. Postmark simulates the workload of an electronic mail server, by creating a large pool of continuously changing files. We again tested both the assembler and the C-version of the IPC path. For each test, we ran the postmark benchmark five times and obtained mean and standard deviation. We measured throughput results for the three different configurations already used in the IPC microbenchmark, plus three new configurations that evaluate the costs of analyzing log files and the costs of logging shared memory interaction:
Throughput (MB/s)
“analysis“ Logging is supported but disabled; the scheduler is invoked every 20 milliseconds but performs its calculations on empty buffers. “ipc+shm3“ Logging and analyzing both IPC and shared memory usage, but the latter only on every third event, via a log sampling threshold of 3. “ipc+shm1“ Logging and analyzing both IPC and shared memory usage on every single event. ASM 70 60 50 40 30 20 10 0
C
native off analysis ipc ipc+shm3 ipc+shm1
Figure 6. Disk throughput with various log configurations (assembler and C-version of the L4 IPC path). The CPU was saturated during all tests. In general, the results are promising; disabled logging does not have significant overhead. The absolute overhead of emitting log data is small, in the range of a few 100’s of cycles, and can be optimized for critical cases such as IPC. Furthermore, logging scales well with the number of processors. Even in a scenario not bound to I/O processing, application throughput decreases only insignificantly by 1-2 percent for logging IPC or for analyzing scheduling events. Only with shared memory, where reading page table bits incurs external acquisition costs, throughput decreases noticeably. In this case, sampling can be used to reduce the logging overhead.
6 Conclusion and Future Work In this paper, we presented event-logging as a generic and efficient mechanism to supply resource schedulers that run in separate protection domains with the required but remote scheduling information. We see our work as a starting point to develop resource managers that accommodate
the future of operating systems with its heterogeneous system components, without sacrificing extensibility, scope, or policy-richness. Logging is a simple enough mechanism that existing schedulers can easily be adapted to this alternative scheme.
References [1] Jennifer M. Anderson, Lance M. Berc, Jeffrey Dean, Sanjay Ghemawat, Monika R. Henzinger, Shun-Tak A. Leung, Richard L. Sites, Mark T. Vandevoorde, Carl A. Waldspurger, and William E. Weihl. Continuous profiling: Where have all the cycles gone? In Proceedings of the sixteenth ACM Symposium on Operating systems principles (SOSP), pages 357–390. ACM Press, October 1997. [2] Thomas Anderson, Edward Lazowska, and Henry Levy. The performance implications of thread management alternatives for sharedmemory multiprocessors. In Proceedings of the 1989 ACM conference on Measurement and modeling of computer systems (SIGMETRICS), pages 49–60. ACM Press, May 1989. [3] Thomas E. Anderson, Brian N. Bershad, Edward D. Lazowska, and Henry M. Levy. Scheduler activations: Effective kernel support for the user-level management of parallelism. In Proceedings of the thirteenth ACM Symposium on Operating systems principles (SOSP), pages 95–109. ACM Press, October 1991. [4] Gaurav Banga, Peter Druschel, and Jeffrey C. Mogul. Resource containers: A new facility for resource management in server systems. In Proceedings of the fourth USENIX Symposium on Operating systems design and implementation (OSDI), pages 45–58. USENIX Association, February 1999. [5] Bryan Cantrill, Michael W. Shapiro, and Adam H. Leventhal. Dynamic instrumentation of production systems. In Proceedings of the USENIX annual technical conference), pages 15–28. USENIX Association, June 2004. [6] Peter Druschel, Vivek S. Pai, and Willy Zwaenepoel. Extensible kernels are leading OS research astray. In Proceedings of the sixth IEEE workshop on Hot Topics in Operating Systems (HotOS), pages 38– 42. IEEE Computer Society Press, May 1997. [7] Ian M. Leslie, Derek McAuley, Richard Black, Timothy Roscoe, Paul T. Barham, David Evers, Robin Fairbairns, and Eoin Hyden. The design and implementation of an operating system to support distributed multimedia applications. IEEE Journal of Selected Areas in Communications, 14(7):1280–1297, 1996. [8] Joshua LeVasseur, Volkmar Uhlig, Jan Stoess, and Stefan G¨otz. Unmodified device driver reuse and improved system dependability via virtual machines. In Proceedings of the sixth USENIX Symposium on Operating systems design and implementation (OSDI). USENIX Association, December 2004. [9] Jochen Liedtke. On µ-kernel construction. In Proceedings of the fifteenth ACM Symposium on Operating systems principles (SOSP), pages 237–250. ACM Press, December 1995. [10] Brian D. Marsh, Michael L. Scott, Thomas J. LeBlanc, and Evangelos P. Markatos. First-class user-level threads. In Proceedings of the thirteenth ACM Symposium on Operating systems principles (SOSP), pages 110–121. ACM Press, October 1991. [11] Ariel Tamches and Barton P. Miller. Fine-grained dynamic instrumentation of commodity operating system kernels. In Proceedings of the fourth USENIX Symposium on Operating systems design and implementation (OSDI), pages 117–130. USENIX Association, February 1999. [12] Volkmar Uhlig, Joshua LeVasseur, Espen Skoglund, and Uwe Dannowski. Towards scalable multiprocessor virtual machines. In Proceedings of the third Virtual Machine Research and Technology Symposium, pages 43–56. USENIX Association, May 6–7 2004. [13] Robert W. Wisniewski and Luis F. Stevens. A model and tools for supporting parallel real-time applications in unix environments. In Proceedings of the first IEEE Real Time Technology and Applications Symposium, pages 126–133. IEEE Computer Society, May 1995. [14] Karim Yaghmour and Mchel R. Dagenais. Measuring and characterizing system behaviour using kernel-event logging. In Proceedings of the USENIX annual technical conference, pages 13–26. USENIX Association, June 2000.