rapid communications Focused Microarrays as a Method to Evaluate Subtle Changes in Gene Expression S. Druyan,1 J. E. de Oliveira,2 and C. M. Ashwell3 Department of Poultry Science, North Carolina State University, Raleigh 27695-7608 ABSTRACT Recent studies using microarray technologies for the chicken have reported information regarding the effects of specific experimental treatments on gene expression levels often resulting in large gene lists and limitations on the statistical significance levels detected. In most cases, with these limitations, along with thresholds of ±2-fold differences in expression levels, that are used to create these gene lists, much of the biological information may have been overlooked. In this study, a focused 70-mer oligonucleotide microarray was developed to address the apparent limits of detection and issues with multiple testing resulting from the use of microarrays that include only a single spot (probe) for each gene. Gene expression was assayed across the development of the chicken embryonic heart from d 7 to 20 of incubation. When using a mixed-model approach and ANOVA with Bonferroni correction for multiple testing, including replicates within the focused array significantly increased the sensitivity with which differences could be detected across sample groups, as compared with single-spot data. By incor-
porating replication into the focused array, 50 genes were detected as being differentially expressed in the embryonic heart across the time points sampled. This compares with only 7 genes detected as being differentially expressed when a more typical, less statistically stringent single-spot analysis is conducted. Based on our observations, the use of focused microarrays allows for the thorough investigation of gene expression patterns, with detection of significant changes in gene expression of ±7%. This limit of detection is far superior to that of real-time PCR, which is able to detect significant changes in expression from ±33 to 55%, depending on the specific application. The ability to detect small differences in expression will allow investigators to identify subtle effects that have perhaps been overlooked in many prior assays, including single-spot arrays. Subtle shifts in gene expression are exactly those that occur during embryonic development, nutritional manipulation, and the initial stages of disease before clinical signs appear.
Key words: bioinformatics, microarray analysis, gene expression, embryonic development 2008 Poultry Science 87:2418–2429 doi:10.3382/ps.2007-00513
INTRODUCTION The draft chicken genome was completed and published in 2004, granting the chicken the honor of being the first farm animal to have its genome sequenced (Lamont, 2006; Siegel et al., 2006). The available genome sequence provides the opportunity to fully implement modern genomic technologies, with great precision, and to accumulate data on the expression patterns of all genes (Siegel et al., 2006). Among the latest tools being developed for chicken are microarrays. Oligonucleotides or cDNA are spot©2008 Poultry Science Association Inc. Received December 19, 2007. Accepted June 17, 2008. 1 Current address: Institute of Animal Science, Agricultural Research Organization, The Volcani Center, PO Box 6, Bet Dagan 50250, Israel. 2 Current address: Provimi Research and Innovation Centre, Lenneke Marelaan 2, Sint-Stevens Woluwe, B1932, Belgium. 3 Corresponding author:
[email protected]
ted (probes) onto nylon filters or glass slides and hybridized with a target made from an RNA population of interest. Microarray technology provides several advantages for analyzing large populations of genes (Schena et al., 1995). The greatest advantage is that a large number of genes can be measured in a single assay (Spielbauer and Stahl, 2005). Several groups have assembled microarrays containing subsets of chicken cDNA sequences. Affymetrix (Santa Clara, CA) has constructed a GeneChip Chicken Genome array covering nearly 33,000 transcripts, corresponding to more than 28,000 chicken genes (Antin and Konieczka, 2005). The GeneChip also contains probe sets for detecting 684 viral transcripts. A 13,000-feature cDNA chip has been generated at the Fred Hutchinson Cancer Research Center (Seattle, WA) through the combined efforts of researchers at the Fred Hutchinson Cancer Research Center, the University of Delaware (Newark, DE), and the Roslin Institute (Roslin, Midlothian, UK; Burnside et al., 2005). A 1,152
2418
FOCUSED MICROARRAY ANALYSIS OF GENE EXPRESSION
chick embryo cDNA array (Jaszczak et al., 2006) and a 5,000 cDNA chicken immune DNA array (Smith et al., 2006) are also available from ARK-Genomics (Roslin, Midlothian, UK). An 8,000-feature metabolic-somatic system chip, a 7,000-feature neuroendocrine-reproductive system chip, and the 14K Del-Mar Chicken Integrated Systems chip are also available (Cogburn et al., 2004). One limitation of all of these array formats is in their sensitivity for detecting differences in gene expression. Many of these arrays contain only a single spot or replicate for each gene in the array and require significant numbers of technical or biological replicates to detect statistically significant differences. We have designed a focused array that contains 320 specifically chosen long oligonucleotides, enabling the accurate measurement of key genes and pathways of interest to several research groups at North Carolina State University. The array was customized for a large replication number and provides a valuable, cost effective resource for the investigation of expression patterns in selected genes. Gene ontology data and tentative consensus sequence information are provided for each 70-bp oligonucleotide at the National Center for Biotechnology Information (NCBI) Gene Expression Omnibus (GEO) archive, accession number GLP6043. The objective of the present study was to develop a proper analytical method to find differentially expressed genes by using our focused array with its large number of replications per gene. We have selected a representative data set to show the investigation of changes in the expression patterns of genes in the developing chick heart from the stage at which it is readily discernible and removed [embryonic day (E)7] through pipping (E20) as an example of the application of this array method. The expression patterns in the heart through this period of development reflect the patterns of genes involved in cardiac growth, cardiac capacity, and the preparation for hatching. These patterns are not expected to be large in magnitude, as are most microarray experiments, because there has been no experimental manipulation, hormone or drug treatment, or disease challenge, as in the majority of prior works.
MATERIALS AND METHODS Tissue Sampling Chicken embryos were obtained from broiler line eggs. Four times during incubation [E7, E15, E19 (internal pipping), and E20 (external pipping)], 8 embryos were killed and the heart was immediately removed, immersed in RNA-Later (Applied Biosystems-Ambion, Foster City, CA) according to the manufacturer’s protocol, and stored at −80°C.
RNA Isolation Total RNA was isolated from each tissue sample (8 from every time point) by using a single-step, modi-
2419
fied acid guanidinium thiocyanate-phenol-chloroform extraction method (Chomczynski and Sacchi, 1987). Briefly, 100 mg of heart tissue was homogenized in RLT buffer (Qiagen, Valencia, CA). The homogenate was then extracted with acidic (pH 4.2) phenol-chloroformisoamyl alcohol (125:24:1). The resulting mixture was separated by centrifugation, yielding an upper aqueous phase, which was then decanted and extracted with chloroform-isoamyl alcohol (49:1), yielding an upper phase containing total RNA. The RNA was precipitated by addition of an equal volume of 100% isopropanol for 2 h and subsequent centrifugation. The RNA pellet was washed with 75% ethanol and then resuspended in diethylpyrocarbonate-treated water. Concentration and quality of the RNA were determined by measuring the absorbance at 260 nm (Nanodrop, NanoDrop Technologies, Wilmington, DE), and RNA were monitored for integrity by agarose gel electrophoresis. Only RNA of sufficient purity, having an absorbance ratio of A260:280 >1.85, was considered for use.
Array Procedure and Processing Microarrays were manufactured at North Carolina State University by using 70-bp oligonucleotides manufactured by Operon Biotechnologies Inc. (Germantown, MD) and obtained in a 384-well plate format. The sequence of each oligo was based on the 70mer database generated by TIGR (The Institute for Genomic Research) and currently maintained by the Gene Index Project (http://compbio.dfci.harvard.edu/ tgi/tgipage.html) for the chicken. Oligos were resuspended in array spotting solution and printed (spotted) on UltraGAPS Amino-Silane Coated Slides (Corning Inc., Acton, MA) to produce all the slides used in this study. The slides were printed by using a VersArray Chipwriter Compact Arrayer (Bio-Rad Inc., Waterloo, Ontario, Canada), using 4 slotted pins. Each gene was spotted 3 times (side-by-side) in the same grid, and grids were replicated 4 times on each slide so that each gene was spotted a total of 12 times per array (technical replicates). After printing, the slides were left to dry for 24 h in the printer, and the oligos were then attached to the slide surface on a CL-1000 UV crosslinker (UVP Inc., Upland, CA) set to 6,000 × 100 µJ/cm2.
Sample Labeling The array experimental design was a complete interwoven loop design (Garosi et al., 2005). From each time point, 4 individual samples were each labeled with Cy3, and 4 individual samples were each labeled with Cy5. Tissue RNA samples were used to produce Cy-dye labeled cDNA by using the indirect labeling technique. We used the ChipShot Indirect Labeling and Clean-up System kit (Promega, Madison, WI) to produce aminoallyl-cDNA, which was labeled either with Cy3 or Cy5 fluorescent dye (Amersham Biosciences Corp., Piscataway, NJ).
2420
Druyan et al.
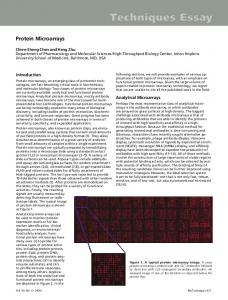
Figure 1. Array hybridization scheme for 2-color labeling. Each sampling time point is shown as embryonic day (E)7, E15, E19, and E20. Each array is represented by an individual arrows or bars (16 total). The sample groups located at each end of the respective arrows were hybridized on the same array. Samples at the tail of the arrow were labeled with Cy3 (open) and samples at the arrowhead were labeled with Cy5 (shaded). To complete all comparisons within the design, samples within a time point group were hybridized against a sample from the same time point, which is represented by the bars within each sample group. This results in 8 independent measurements for each time point. Each of these 8 measures corresponded to an individual sample collected and labeled with either Cy3 or Cy5 as shown.
Hybridization and Image Acquisition After the complete interwoven loop design, for every time point there were 8 individually labeled cDNA, and each one was hybridized to a different array. The labeling and hybridization scheme is shown in Figure 1. Thus, the array loop design included a total of 16 arrays. Each array hybridization included cDNA from 2 distinct time points, with one being labeled with Cy3 and the other being labeled with Cy5. For the prehybridization and hybridization of the microarrays slides, the Pronto Plus! Microarray Hybridization Kit (Corning Inc.) was used. The Cy3- and Cy5-labeled cDNA probes were applied to a prehybridized slide covered with a precleaned glass coverslip (Lifterslip, Portsmouth, NH), and hybridized for 16 h. Microarray slides were scanned on a ScanArray GX PLUS Microarray Scanner (PerkinElmer Life and Analytical Sciences, Shelton, CT) set to 65% laser power.
Quantitative Real-Time PCR Total RNA from individual hearts (6 from each time point) was reverse-transcribed to produce cDNA in a 20-µL volume containing 1 µg of extracted RNA, using an iScript kit (Bio-Rad, Hercules, CA) according to the manufacturer’s protocol. The reaction was incubated
at 25°C for 5 min, followed by 30 min at 42°C and 5 min at 85°C. Individual cDNA were diluted 1:20 before amplification. The mRNA expression levels of selected probes were analyzed by quantitative real-time PCR (qPCR) with a Bio-Rad iQ instrument and with iQSYBR Green Supermix kits according to the manufacturer’s protocols. Gene-specific primers were designed by using Beacon Designer software (Premier Biosoft International, Palo Alto, CA) for SYBR Green detection according to the published cDNA sequences for each of the selected genes (Table 1). Thermocycling parameters were as follows: 94°C for 5 min; 50 cycles of 94°C for 30 s, appropriate annealing temperature in degrees Celsius (Table 1) for 30 s, 72°C for 30 s; 72°C for 8 min. Fluorescence measurements were collected at every cycle during the extension step (72°C). Each gene was amplified independently in triplicate within a single instrument run. Standard curves were also generated to determine the efficiency of amplification by pooling undiluted cDNA from the heart samples across all ages and diluting the pooled cDNA to dilutions of 1:5, 1:25, 1:125, and 1:625. Cycle threshold (Ct) values were calculated for each sample, corresponding to the cycle at which the amplification rate was maximal. Gene expression was normalized for RNA loading by using glyceraldehyde-3-phosphate dehydrogenase (GAPDH) as an internal control. The nfold change was calculated relative to that on E7 by using the DD t method of Pfaffl (2001), including the efficiencies for both the experimental gene and GAPDH. C
Data Processing and Statistical Analysis Microarrays. The scanned images were processed by the following procedure. Data files were generated by extracting the intensity raw data for each slide and dye combination by using ScanAlyze Software (Stanford University, Stanford, CA). Intensity data files were then analyzed by using JMP Genomics (SAS Institute Inc., Cary, NC), including an initial log2 transformation. Data normalization was performed by using locally weighted regression and smoothing, first within array and then across all arrays. Evaluation of the normalization was monitored by distribution analysis of the transformed data. This data set can be found at NCBI GEO and is accessible through GEO Series accession number GPL6043 (Edgar et al., 2002). The resulting normalized log2 intensities were analyzed by using a mixed-model ANOVA, as described by Wolfinger et al. (2001). The mixed model used to identify significant differentially expressed genes using one gene replicate was
Y = m + E + Dye + S + e,
[1]
with embryonic age (E) and Cy-dye (Dye) as fixed effects, and slide (S) as a random effect. Mean intensi-
2421
Focused Arrays In this study, we used a mixed-model ANOVA to determine the differential gene expression patterns
108 185 159 113 195 5′-CGATGAAGGGATCATTGATGGC-3′ 5′-CGCTGCTCAATCCTGTCC-3′ 5′-GTCAGCGGCATTCACAAG-3′ 5′-TCCACACTTTCCCTCTCG-3′ 5′-AAGCATTCTTCAGAGCAC-3′
1 GAPDH = glyceraldehyde-3-phosphate dehydrogenase; cTnT = cardiac troponin T; TOP2B = DNA topoisomerase II-β; TBX20 = transcriptional regulator T-box 20; ANF = atrial natriuretic factor. 2 Tm = annealing temperature.
RESULTS AND DISCUSSION
NM_204305 M10013 NM_205082 NM_204144 NM_204925
Biological processes were identified by using the approach of statistical overrepresentation in the Metacore database (GeneGo Inc., St. Joseph, MI), a highly curated Web-based application for identification of gene ontology processes in input gene sets (Nikolsky et al., 2005). The analysis methodology uses annotation databases and identifies gene ontology biological processes associated with experimentally identified differentially expressed genes, which are then ranked according to their P-value. Metacore was also used for network analysis as a pathway mapping tool. The list of differentially expressed genes identified experimentally was uploaded to Metacore for analysis and construction of any potential biological network(s). The shortest path algorithm was used to map the shortest path for interaction between the differentially expressed genes.
GAPDH cTnT TOP2B TBX20 ANF
Pathway and Process Analysis
5′ primer
with embryonic age (E) as the main fixed effect. All statistical analyses were conducted by using JMP software (SAS Institute Inc.).
3′ primer
[3] Table 1. Primers used for quantitative real-time PCR analysis of embryonic heart gene expression
Y = m + E + e,
5′-GGTGAAAGTCGGAGTCAACGG-3′ 5′-CCCTTCATGCCCAACCTG-3′ 5′-CATATCCTCCTCCGTCCAG-3′ 5′-GTCACAGCCTACCAGAATC-3′ 5′-TAGCATCCAACACTCCTC-3′
with embryonic age (E) and Cy-dye (Dye) as fixed effects, and grid × slide (GS) as a random effect. Mean intensities were compared by using a threshold of significance based on a Bonferroni correction of P = 0.05 (Hochberg, 1988). For the complete array, including all replicates, a mean by grid intensity was calculated for each gene by using the 3 side-by-side probes, resulting in a total of 4 replicated means (1 from each replicated grid) per gene. Real-Time. Data for the Ct ratio from 8 random replicates (sample gene Ct:sample GAPDH Ct) during embryonic development were subjected to one-way ANOVA according to the following model:
106 82.3 76.0 89.9 97.8
Efficiency (%) Size of PCR products (bp)
[2]
Accession no.
Y = m + E + Dye + GS + e,
Target1
Tm2 (°C)
ties were compared by using a threshold of significance based on the false discovery rate (FDR) of P = 0.05 (Benjamini and Hochberg, 1995). One gene replicate analysis was performed by using only the first spotted replicate for each gene (replicate 1 in the first grid of the array). The mixed model used to identify significant differentially expressed genes using the high degree of replication was
57 63 59 59 59
FOCUSED MICROARRAY ANALYSIS OF GENE EXPRESSION
2422
Druyan et al.
Figure 2. Volcano plots of significance level (P-value) versus expression level difference. Each diamond represents one of 320 genes, with the negative log10 of the P-value from the gene model plotted against the difference between least squares means for the indicated effect. Plots in column A result from analysis including all of the replicate spots for each gene, whereas those in column B result from the analysis of only a single spot for each gene. The horizontal dashed line represents the testwise threshold of P = 0.05, as determined by the false discovery rate estimation based on the number of tests in each analysis method. A difference of one residual unit represents a 2-fold change, because raw fluorescence intensities are log2 transformed.
across 4 time points in embryonic development. Our emphasis was on the utility of a focused microarray approach to identify differentially expressed genes when
the change in expression levels was moderate to low (±7%). By using a high degree of replication along with the Bonferroni correction, 50 genes were identified as
2423
FOCUSED MICROARRAY ANALYSIS OF GENE EXPRESSION
Table 2. Genes identified as differentially expressed from embryonic day (E)7 to E20 in the chick embryonic heart, depending on the number of replicates included in the analysis1 Analysis with Bonferroni replication
at 0.052 Comparison
Gene name
Ascension no.
E7 to E15
Tyrosinase HBE LITAF Elastin HOXA3 ANKRD1 MYH7 Cytoskeletal β-actin Tropoelastin SOX4 HIF1A SOD2 STAT 4 HB alphaD PLB Acetyl-CoA acyltransferase YWHAB
E15 to E19
E19 to E20
Analysis with single-spot
false discovery rate at 0.053
P-value (−log10)
Fold change
P-value (−log10)
Fold change
NM_204160 K00824 NM_204267 M18633 NM_204548 NM_204405 NM_001001302 NM_205518 M15889 NM_204484 NM_204297 NM_204211 AB275897 M15378 NM_205410 NM_001039287 NM_001006289
10.15911 6.699165 8.948467 5.119126 4.658569 6.895272 7.078207 7.588729 6.144765 5.010935 2.441159 6.733545 6.226312 7.549373 6.020973 14.57776 12.74972
1.41 1.32 1.24 1.22 1.21 1.19 1.18 1.17 1.13 1.13 1.08 0.88 0.86 0.84 0.80 0.77 0.64
3.928576
1.54
4.30860
0.70
HB alphaA HBB HBE ZYX MLC2a β-Actin COX LITAF SPARC ARNTL2 PLB Elastin cTnT STAT3 ANF/ANP
M15379 NM_001081704 K00824 NM_001004386 J00890 X00182 NM_001030700 NM_204267 NM_204410 NM_204133 NM_205410 M18633 NM_205449 AY641397 NM_204925
12.82065 11.62893 11.94073 10.02832 5.71116 4.752976 4.9674 5.173235 6.262169 5.970409 5.347895 5.380462 6.517458 8.261737 6.913686
2.32 1.97 1.62 1.34 1.16 1.14 0.86 0.85 0.83 0.83 0.80 0.79 0.79 0.76 0.64
3.926501 3.929184 3.949014
2.75 2.09 1.86
ENO1 ARNTL2 EGFr IRF2 Tropoelastin TGFBR1 SERCA2
NM_205120 NM_204133 NM_205497 NM 205196 M15889 NM_204246 M66385
3.177359 4.955487 4.70193 5.129073 5.566319 6.512603 9.89095
1.21 1.18 1.14 0.90 0.90 0.88 0.80
1
Significance level cutoff thresholds were experimentally determined by using a false discovery rate of 0.05 to correct for multiple testing. Significance level, and fold change between day of development (model 2), of the difference between means for gene expression intensity. 3 Significance level, and fold change between day of development (model 1), of the difference between means for gene expression intensity. 2
being differentially expressed from E7, E15, E19, and E20 in a comparison of each of the individual time periods across development, as is presented in panel A of Figure 1. The volcano plots provide a visual characterization of the differential expression pattern of genes, with increasing significance level represented on the y-axis and the difference in expression levels as either positive and negative shown on the x-axis. The threshold of significance was determined by Bonferroni correction set at P = 0.05. When the arrays were analyzed by using only singlespot information for each gene, with FDR set at P = 0.05, as is common in previously reported array studies, only 7 genes were identified as being differentially expressed across the 4 time periods. When the stricter Bonferroni correction was used, no genes were detected as being significantly different. A visual representation
of this analysis using FDR is also presented in Figure 2, panel B. As compared with the analysis including all the replicate spots described above and shown in panel A, there was a noteworthy reduction in genes detected as being significantly differentially expressed. This difference was due to the major contribution of the replicates in eliminating the noise prevalent in microarray experiments. Our statistical model included multiple tests on individual genes, as do all microarray experiments. Many studies do not adequately deal with multiple testing and rely only on the nominal P-values provided by the statistical model used. Therefore, to protect against false discoveries caused by multiple testing, we used the less restrictive step-up FDR threshold for significant P-values for the single spot and the stricter Bonferroni correction for the high degree of replication. We
C
3 The n-fold change was calculated relative to that on E7 comparing the intensity for the arrays or using the DD t method of Pfaffl (2001), including the efficiencies for both the experimental gene and GAPDH. 4 Cycle threshold (Ct) ratios are shown at the ration of the target gene:normalizer ± SE. 5 Significance level, within each gene (model 1), of the difference between the means of intensities or Ct ratios of E7, E15, E19, and E20 normalized to GAPDH (n = 6).
Means of the 4 sampling days normalized to glyceraldehyde-3-phosphate dehydrogenase (GAPDH) within each row (gene) without a common superscript differ significantly (P < 0.05). Mean intensities for the 4 sampling days within each row (gene) without a common superscript differ significantly (P < 0.05). 1 cTnT = cardiac troponin T; TOP2B = DNA topoisomerase II-β; TBX20 = transcriptional regulator T-box 20; ANF = atrial natriuretic factor. 2 qPCR = quantitative real-time PCR. x,y
a–c